SIT718 Real World Analytics: Downer EDI Share Price Analysis Report

Verified

Added on  2022/10/10

|8
|1488
|25
Report
AI Summary
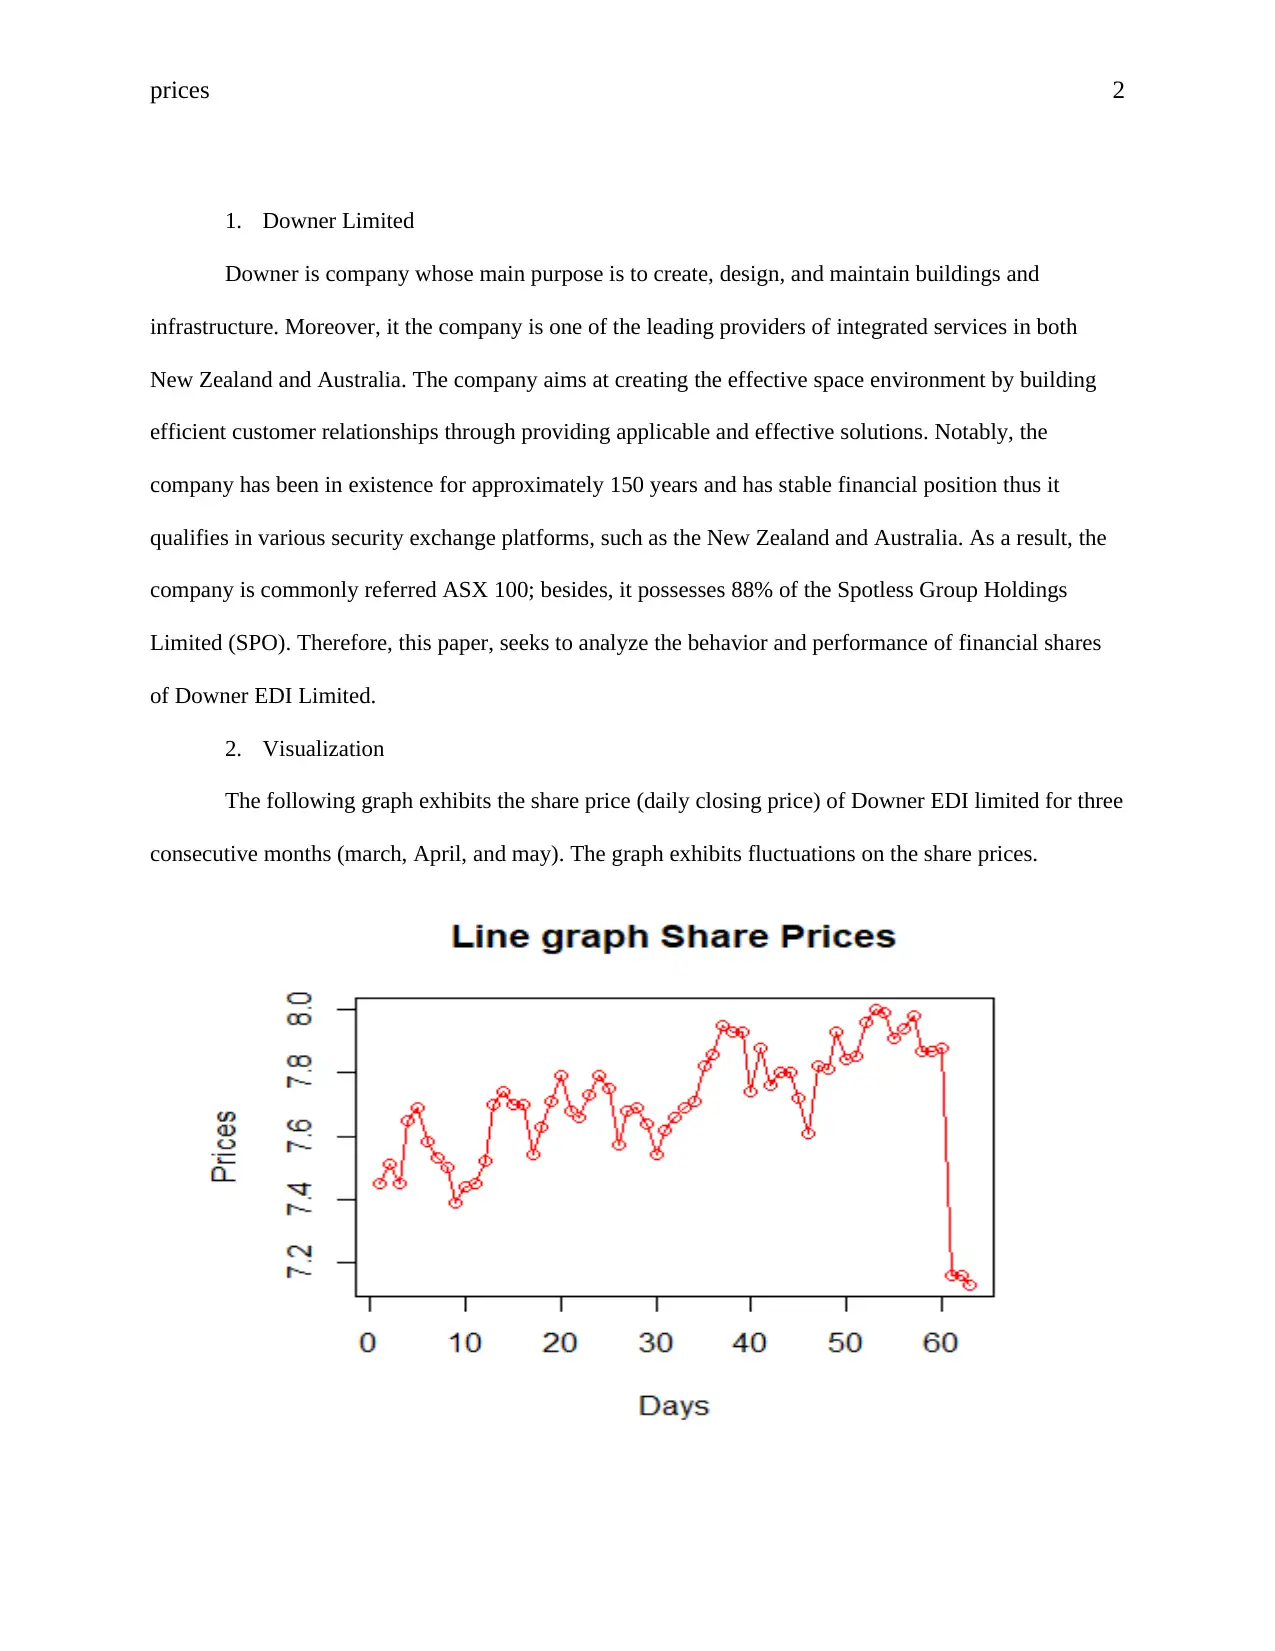
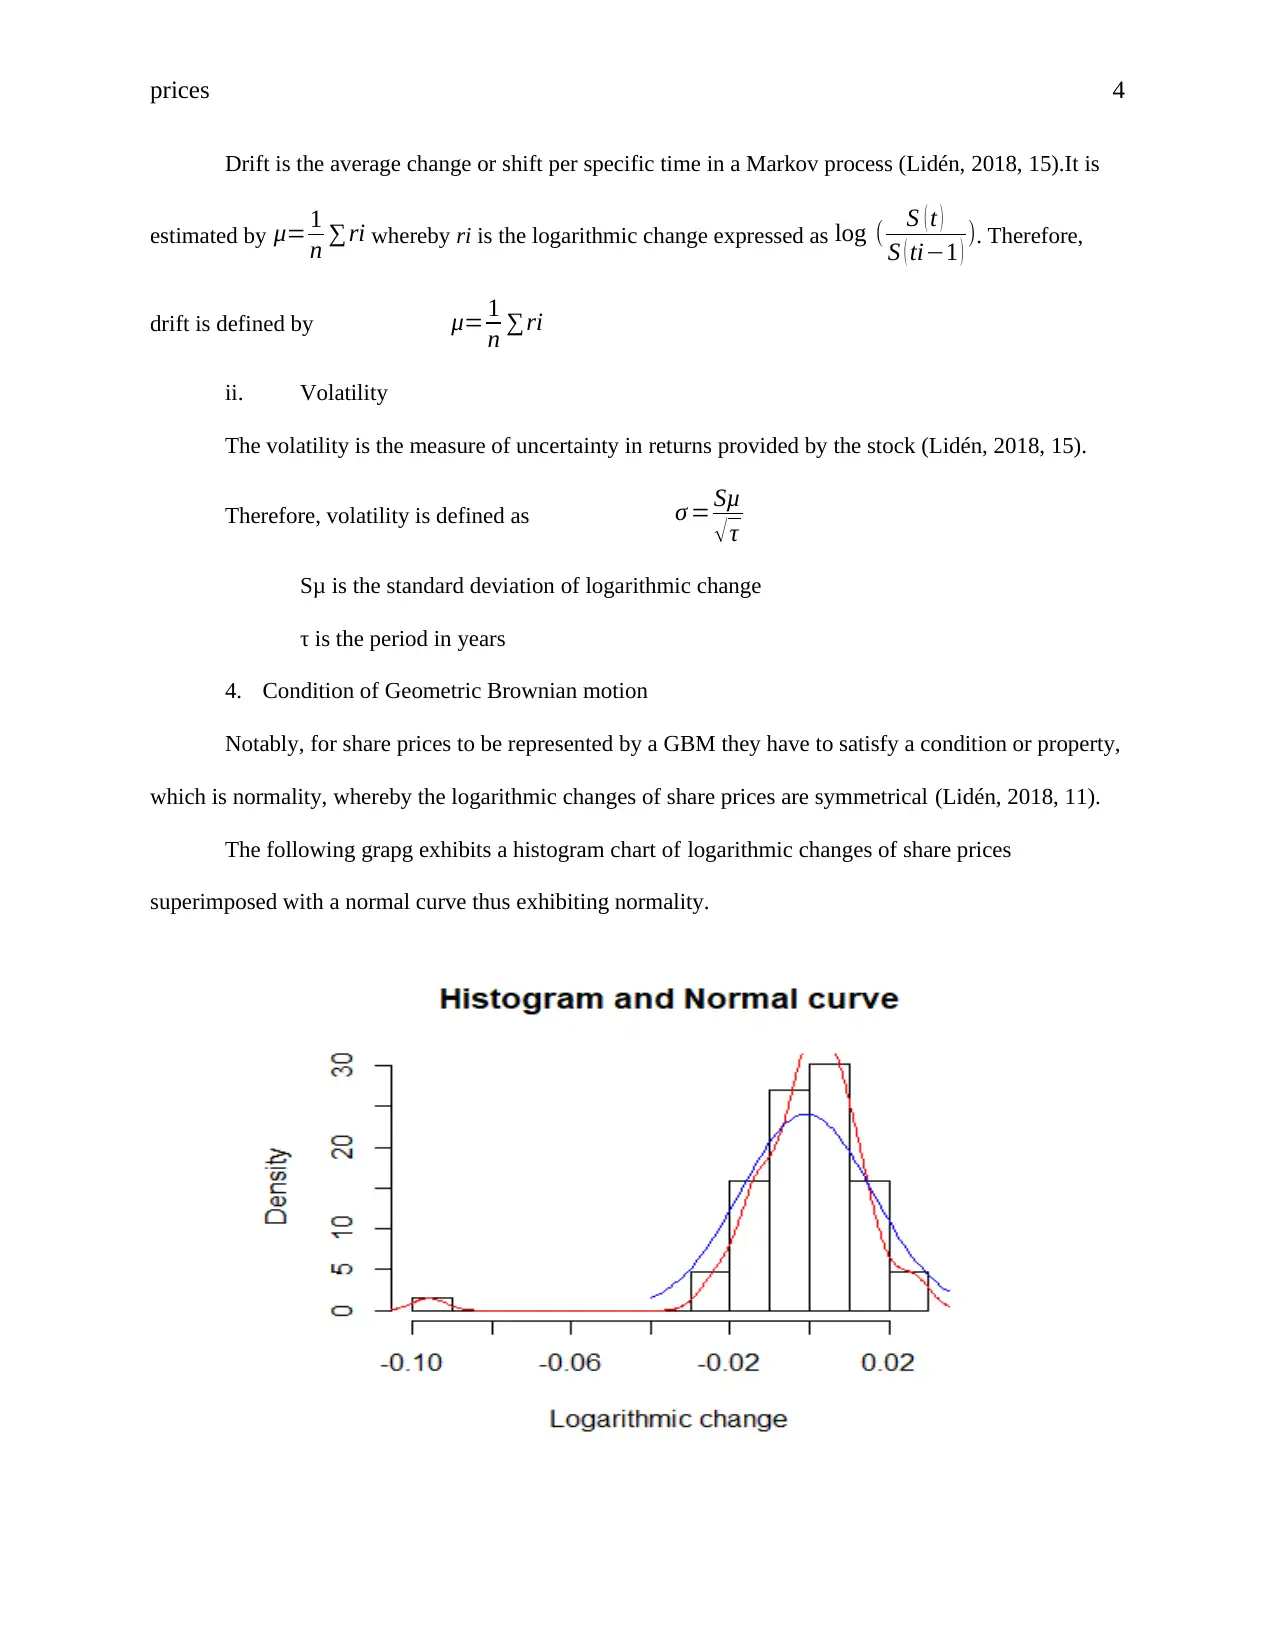
This report analyzes the share price behavior of Downer EDI Limited using historical data from March, April, and May. The analysis employs the Geometric Brownian Motion (GBM) model, calculating drift and volatility to predict future share prices. The report presents the visualizations of the data, detailing the fluctuations in share prices and the application of GBM. The study calculates drift and volatility for different time intervals (three months and the last month), demonstrating how these parameters change and affect the model's predictive accuracy. The report includes an R code for the analysis and concludes by comparing the model's predictions with the actual published share prices, highlighting discrepancies due to factors like new information and financial liabilities, as evident from Downer's debt and liabilities data. The report also references Simply Wall to explain the impact of debt on business.
Document Page
Running header: Share prices 1
Modelling Share Prices
Name:
Course:
Instructor:
Institution:
Date:
tabler-icon-diamond-filled.svg

Secure Best Marks with AI Grader

Need help grading? Try our AI Grader for instant feedback on your assignments.
Document Page
prices 2
1. Downer Limited
Downer is company whose main purpose is to create, design, and maintain buildings and
infrastructure. Moreover, it the company is one of the leading providers of integrated services in both
New Zealand and Australia. The company aims at creating the effective space environment by building
efficient customer relationships through providing applicable and effective solutions. Notably, the
company has been in existence for approximately 150 years and has stable financial position thus it
qualifies in various security exchange platforms, such as the New Zealand and Australia. As a result, the
company is commonly referred ASX 100; besides, it possesses 88% of the Spotless Group Holdings
Limited (SPO). Therefore, this paper, seeks to analyze the behavior and performance of financial shares
of Downer EDI Limited.
2. Visualization
The following graph exhibits the share price (daily closing price) of Downer EDI limited for three
consecutive months (march, April, and may). The graph exhibits fluctuations on the share prices.
Document Page
prices 3
3. Modelling of Share prices
In the financial sector, stock represent a share of ownership in a company thus investors buy
stocks with an expectation of yielding income generated from dividends and growth in value. There are
two factors that determine the current share prices, which include the past history of stock prices and the
any new information about the stock (Agustini, et al., 2018, 1). As a result, the stock prices assume a
Markov process, whereby the expected future prices rely on the present price. One of the techniques used
in the modelling of share prices is the stochastic modelling (Geometric Brownian motion) (GBM). The
Brownian motion, also known as the Winer process has been extensively used in physics to explain the
motion of a particle, subjected to a large number of smaller molecular shocks or disturbances (Imperial,
2018). Notably, the Brownian motion takes negative values thus it is not effective in modeling the share
prices; however, to curb this challenge the non-negative variation of BM, known as the GBM, S(t)
adopted (Imperial, 2018, 3). The GBM is defined by
S(t) = S0 exp X(t)
Whereby X(t) = μ + σ2/2
S0 is the initial value
S(t) is the Share price on the day (t)
μ is the drift
σ is the volatility
Notably, unlike the fixed-income investment the share price has variability associated with
randomness and the underlying Brownian motion, which could drop in value thus causing lose of money
by investors (Agustini, et al., 2018, 1).
i. Drift μ
Document Page
prices 4
Drift is the average change or shift per specific time in a Markov process (Lidén, 2018, 15).It is
estimated by μ= 1
n ri whereby ri is the logarithmic change expressed as log ( S ( t )
S ( ti1 ) ). Therefore,
drift is defined by μ= 1
n ri
ii. Volatility
The volatility is the measure of uncertainty in returns provided by the stock (Lidén, 2018, 15).
Therefore, volatility is defined as σ =
τ
Sμ is the standard deviation of logarithmic change
τ is the period in years
4. Condition of Geometric Brownian motion
Notably, for share prices to be represented by a GBM they have to satisfy a condition or property,
which is normality, whereby the logarithmic changes of share prices are symmetrical (Lidén, 2018, 11).
The following grapg exhibits a histogram chart of logarithmic changes of share prices
superimposed with a normal curve thus exhibiting normality.
tabler-icon-diamond-filled.svg

Secure Best Marks with AI Grader

Need help grading? Try our AI Grader for instant feedback on your assignments.
Document Page
prices 5
5. Calculating parameter values drift (μ) and volatility (σ)
Three months
Drift μ= 1
n ri = 1
63 (0.04658 ) = -0.0007394
Daily = -0.0007394 Annual = -0.0007394 * 252 = -0.1863
Volatility σ =
τ s.d = 0.0166 = 1.66%
Daily = 0.0166 = 1.66% Annual = 0.0166 * √252 = 0.2635 = 26.35%
The last month
Drift μ= 1
n ri = 1
23 (0.08209 ) = -0.00357
Daily = -0.00357 Annual = -0.00357* 252 = -0.89964
Volatility σ =
τ s.d = 0.022817 = 2.2817%
Daily = 0.022817= 2.2817% Annual = 0.022817* √252 = 0.3622 = 36.22%
As evident, increase in time interval reduces the volatility and increases the drift thus they are not
constant with time. Therefore, change in time interval affects the model in predicting the stock prices.
6. Using the three-month period S(t )=S 0 exp (μ+ σ 2
2 )t
Daily = S0 exp(-0.0007394 + 0.00013778) = S0 exp -0.00060162t
28 May 7.87 * e-0.00060162*1 = 7.865 ≈ 7.87
29 May 7.87 * e-0.00060162*2 = 7.861 ≈ 7.86
30 May 7.87 * e-0.00060162*3 = 7.856 ≈ 7.86
31 May 7.87 * e-0.00060162*4 = 7.851 ≈ 7.85
Published Calculated
7.88 7.87
7.16 7.86
7.16 7.86
7.13 7.85
Document Page
prices 6
The results, tend to have a difference due to various factors which are not incorporated by the
model, such as new information.
7. Summary
As evident, Downer EDI Limited has been in existence for approximately 150 years and has
stable financial position thus it qualifies in various security exchange platforms, such as the New Zealand
and Australia. As a result, the company is commonly referred ASX 100; besides, it possesses 88 percent
of SPO. Notably, there are two factors that determine the current share prices, which include the past
history of stock prices and the any new information about the stock. Moreover, it is exhibited that
increase in time interval reduces the volatility and increases the drift thus the parameters are not constant
with time. Therefore, change in time interval affects the model in predicting the stock prices. The results
(calculated and published), tend to have a difference due to various factors which are not incorporated by
the model, such as new information.
A report by Simply Wall (2019) exhibits that debt and other liabilities tend to affect a business,
especially if the company cannot fulfill its purpose either with free cashflow or raising capital, whereby
lenders take control of the business. For instance, the report shows that Downer EDI had debt of
AU$1.44B as at December 2018. Moreover, the company had liabilities of AU$2.88B due within and
year (2018) and AU$1.77b falling due after the deadline (Simply Wall, 2019). On the other hand, the
company had cash in hand of AU$550m and receivables worth AU$1.99b. As a result, the liabilities
outweigh the sum of cash in hand and receivables by AU$2.11, which may be one of the factors resulting
in the difference between the published and predicted stock prices. Therefore, one of the restrictions of
the model is inability to incorporate financial information; moreover, the model only relies on historical
data.
Document Page
prices 7
References
Agustini, F., Affianti, I. R. & Putri, E., 2018. Stock price prediction using geometric
Brownian motion. Journal of Physics Conference Series, 1(974), pp. 1-11.
Imperial, F., 2018. Modelling Stock Prices and Stock Market Behaviour using the
Irrational Fractional Brownian Motion: An Application to the S&P500 in Eight Different
Periods, Madrid: Calle Maria de Molina.
Lidén, J., 2018. Stock Price Predictions using a Geometric Brownian Motion, s.l.:
Uppsala Universitet.
SimplyWall, 2019. Is Downer EDI (ASX:DOW) A Risky Investment?. [Online]
Available at: https://au.finance.yahoo.com/news/downer-edi-asx-dow-risky-195448287.html
[Accessed 6 August 2019].
Appendices R codes
#Importing the data
Downer<-read.csv(file.choose(), header=T)
#Viewing the data
Downer
#Variable names
ls(Downer)
#Plotting the graph of share prices
plot(Downer$Price, type = "o", col = "Red", xlab = "Days", ylab = "Prices", main = "Line
graph Share Prices")
#Noramility test
hist(Downer$Logarithmic.change, freq=F, breaks=10,xlab = "Logarithmic change",
main= "Histogram and Normal curve" )
lines(density(Downer$Logarithmic.change), col="red")
tabler-icon-diamond-filled.svg

Paraphrase This Document

Need a fresh take? Get an instant paraphrase of this document with our AI Paraphraser
Document Page
prices 8
#Descriptives of Logarithmic.change
summary(Downer$Logarithmic.change)
chevron_up_icon
1 out of 8
circle_padding
hide_on_mobile
zoom_out_icon
logo.png

Your All-in-One AI-Powered Toolkit for Academic Success.

Available 24*7 on WhatsApp / Email

[object Object]