Sharemarket Decision Making Report: Financial Analysis and Portfolio
VerifiedAdded on 2022/10/17
|20
|2114
|15
Report
AI Summary
This report analyzes the share prices and financial performance of Vodafone and Suncorp groups to aid in effective decision-making within the context of portfolio management. It begins with an overview of both companies, including key financial data like revenue, profit, assets, and share prices. The report then provides a detailed analysis of share price movements over a specific period, comparing them with the All Ordinaries index. The financial analysis includes the calculation of portfolio returns and the application of ratio analysis (current ratio, return on equity, return on total assets, net profit margin, interest coverage ratio, and debt-equity ratio) to assess the companies' profitability, liquidity, and stability. The report concludes with investment recommendations based on the financial analysis and share price movements, ultimately aiming to guide informed investment decisions and portfolio construction.

Accounting for decision making
Paraphrase This Document
Need a fresh take? Get an instant paraphrase of this document with our AI Paraphraser
Table of Contents
Introduction......................................................................................................................................3
Part 2................................................................................................................................................3
A).................................................................................................................................................3
B).................................................................................................................................................3
C)...............................................................................................................................................11
D)...............................................................................................................................................11
E)................................................................................................................................................12
Part 3..............................................................................................................................................12
A)...............................................................................................................................................12
B)...............................................................................................................................................13
Conclusion.....................................................................................................................................14
References......................................................................................................................................15
Appendix........................................................................................................................................16
Introduction
The report is prepared for the analysis of the business and its position and by the help of that
decision making will be made in an effective manner. The information about the companies will
be collected and also the share prices will be ascertained. The graphs will be prepared to identify
the movement and return which is made on the portfolio will be ascertained. The ratio analysis
will be performed will the collected information and by that, the comparison in the performance
of the businesses will be made.
Part 2
A)
Vodafone group:
Vodafone is the company which is involved in the providing of the telecom services in various
parts of the world. Vittorio Colao is the chief executive officer of the company with a salary of
£1453000. The profit made in 2018 amounts to €4757 million. The dividend has been paid in 8
august 2018 at the rate of 10.23 Eurocents per share (Vodafone group, 2018). The amount of the
total assets is €145611 million. 103564 employees are working in the company in the current
year the share price of the company at last date of tracking is identified to $19.90 at high and for
low, it is $19.70.
Suncorp group:
It is an Australian company which is dealing with banking services. Michael A Cameron is the
CEO of the company and $4236000 has been earned by him as the remuneration (Suncorp group,
2018). $1072 million is the amount of profit which is made by the company. The dividend has
been paid on 30 June 2018 for 81 cents per share. The total assets of the company amount to,
$99333 million in 2018 (Suncorp group, 2018). There is a total of 13815 employees in the
company. The high share price is 13.73 and low-level share price is $13.50.
B)
⊘ This is a preview!⊘
Do you want full access?
Subscribe today to unlock all pages.
Trusted by 1+ million students worldwide

Suncorp group:
Date Close
price
22-07-2019 12.75701
23-07-2019 12.75701
24-07-2019 12.96995
25-07-2019 13.19257
26-07-2019 13.0861
29-07-2019 13.14417
30-07-2019 13.12482
31-07-2019 13.07642
01-08-2019 13.02802
02-08-2019 12.96027
05-08-2019 12.86348
06-08-2019 12.30209
07-08-2019 12.89252
08-08-2019 12.84412
09-08-2019 13.35711
12-08-2019 13.3184
13-08-2019 13.27
14-08-2019 13.38
15-08-2019 13.09
16-08-2019 13.1
19-08-2019 13.13
20-08-2019 13.32
21-08-2019 13.36
22-08-2019 13.48
23-08-2019 13.48
26-08-2019 13.38
27-08-2019 13.5
28-08-2019 13.58
29-08-2019 13.65
30-08-2019 13.81
02-09-2019 13.74
03-09-2019 null
04-09-2019 13.58
05-09-2019 13.68
06-09-2019 13.74
09-09-2019 13.77
10-09-2019 13.69
11-09-2019 13.73
12-09-2019 13.78
Paraphrase This Document
Need a fresh take? Get an instant paraphrase of this document with our AI Paraphraser
13-09-2019 13.89
16-09-2019 13.78
17-09-2019 13.76
18-09-2019 13.69
19-09-2019 13.68
20-09-2019 13.63
23-09-2019 13.66
24-09-2019 13.67
25-09-2019 13.68
7/22/2019
7/27/2019
8/1/2019
8/6/2019
8/11/2019
8/16/2019
8/21/2019
8/26/2019
8/31/2019
9/5/2019
9/10/2019
9/15/2019
9/20/2019
9/25/2019
0
2
4
6
8
10
12
14
16
Suncorp group
Close price
Vodafone group:
Date Close
price
22-07-
2019
15.94
23-07-
2019
16.2
24-07-
2019
16.4
25-07-
2019
16.38
26-07-
2019
18.25
29-07-
2019
18.45
30-07- 18.39
2019
31-07-
2019
18.12
01-08-
2019
18.3
02-08-
2019
18.32
05-08-
2019
17.89
06-08-
2019
17.86
07-08-
2019
17.98
08-08-
2019
18.2
09-08-
2019
18.01
12-08-
2019
17.85
13-08-
2019
18.12
14-08-
2019
17.9
15-08-
2019
17.89
16-08-
2019
18.34
19-08-
2019
18.25
20-08-
2019
17.93
21-08-
2019
18.21
22-08-
2019
18.35
23-08-
2019
18.29
26-08-
2019
18.39
27-08-
2019
18.46
28-08-
2019
18.68
29-08-
2019
18.92
30-08- 18.82
⊘ This is a preview!⊘
Do you want full access?
Subscribe today to unlock all pages.
Trusted by 1+ million students worldwide
2019
03-09-
2019
19
04-09-
2019
19.11
05-09-
2019
18.84
06-09-
2019
19.15
09-09-
2019
19.23
10-09-
2019
19.42
11-09-
2019
19.72
12-09-
2019
19.83
13-09-
2019
19.98
16-09-
2019
19.71
17-09-
2019
19.68
18-09-
2019
19.47
19-09-
2019
19.96
20-09-
2019
19.85
23-09-
2019
19.81
24-09-
2019
19.82
25-09-
2019
19.84
Paraphrase This Document
Need a fresh take? Get an instant paraphrase of this document with our AI Paraphraser
7/22/2019
7/27/2019
8/1/2019
8/6/2019
8/11/2019
8/16/2019
8/21/2019
8/26/2019
8/31/2019
9/5/2019
9/10/2019
9/15/2019
9/20/2019
9/25/2019
0
5
10
15
20
25
Vodafone group
Close price
All ordinaries:
Date Close
price
22-07-
2019
6781.2
23-07-
2019
6812.5
24-07-
2019
6862.4
25-07-
2019
6901.9
26-07-
2019
6879.3
29-07-
2019
6911.4
30-07-
2019
6928.3
31-07-
2019
6896.7
01-08-
2019
6871.9
02-08-
2019
6846.1
05-08-
2019
6710.6
06-08-
2019
6546.5
07-08-
2019
6588.5
08-08-
2019
6642.3
09-08-
2019
6663.4
12-08-
2019
6670.1
13-08-
2019
6648.1
14-08-
2019
6677.5
15-08-
2019
6490.8
16-08-
2019
6485.9
19-08-
2019
6550.5
20-08-
2019
6627.4
21-08-
2019
6572.6
22-08-
2019
6593
23-08-
2019
6614.3
26-08-
2019
6531
27-08-
2019
6565.6
28-08-
2019
6600.8
29-08-
2019
6605.7
30-08-
2019
6698.2
02-09-
2019
6677.5
03-09-
2019
6673.5
04-09-
2019
6656.1
05-09-
2019
6720.8
06-09-
2019
6752.7
09-09-
2019
6760.1
2019
6642.3
09-08-
2019
6663.4
12-08-
2019
6670.1
13-08-
2019
6648.1
14-08-
2019
6677.5
15-08-
2019
6490.8
16-08-
2019
6485.9
19-08-
2019
6550.5
20-08-
2019
6627.4
21-08-
2019
6572.6
22-08-
2019
6593
23-08-
2019
6614.3
26-08-
2019
6531
27-08-
2019
6565.6
28-08-
2019
6600.8
29-08-
2019
6605.7
30-08-
2019
6698.2
02-09-
2019
6677.5
03-09-
2019
6673.5
04-09-
2019
6656.1
05-09-
2019
6720.8
06-09-
2019
6752.7
09-09-
2019
6760.1
⊘ This is a preview!⊘
Do you want full access?
Subscribe today to unlock all pages.
Trusted by 1+ million students worldwide
10-09-
2019
6728
11-09-
2019
6752.2
12-09-
2019
6765.7
13-09-
2019
6777.1
16-09-
2019
6782
17-09-
2019
6801.7
18-09-
2019
6791.2
19-09-
2019
6825.2
20-09-
2019
6839
23-09-
2019
6861.1
24-09-
2019
6856.6
25-09-
2019
6814.7
7/22/2019
7/27/2019
8/1/2019
8/6/2019
8/11/2019
8/16/2019
8/21/2019
8/26/2019
8/31/2019
9/5/2019
9/10/2019
9/15/2019
9/20/2019
9/25/2019
6200
6300
6400
6500
6600
6700
6800
6900
7000
All ordinaries
Close price
C)
2019
6728
11-09-
2019
6752.2
12-09-
2019
6765.7
13-09-
2019
6777.1
16-09-
2019
6782
17-09-
2019
6801.7
18-09-
2019
6791.2
19-09-
2019
6825.2
20-09-
2019
6839
23-09-
2019
6861.1
24-09-
2019
6856.6
25-09-
2019
6814.7
7/22/2019
7/27/2019
8/1/2019
8/6/2019
8/11/2019
8/16/2019
8/21/2019
8/26/2019
8/31/2019
9/5/2019
9/10/2019
9/15/2019
9/20/2019
9/25/2019
6200
6300
6400
6500
6600
6700
6800
6900
7000
All ordinaries
Close price
C)
Paraphrase This Document
Need a fresh take? Get an instant paraphrase of this document with our AI Paraphraser
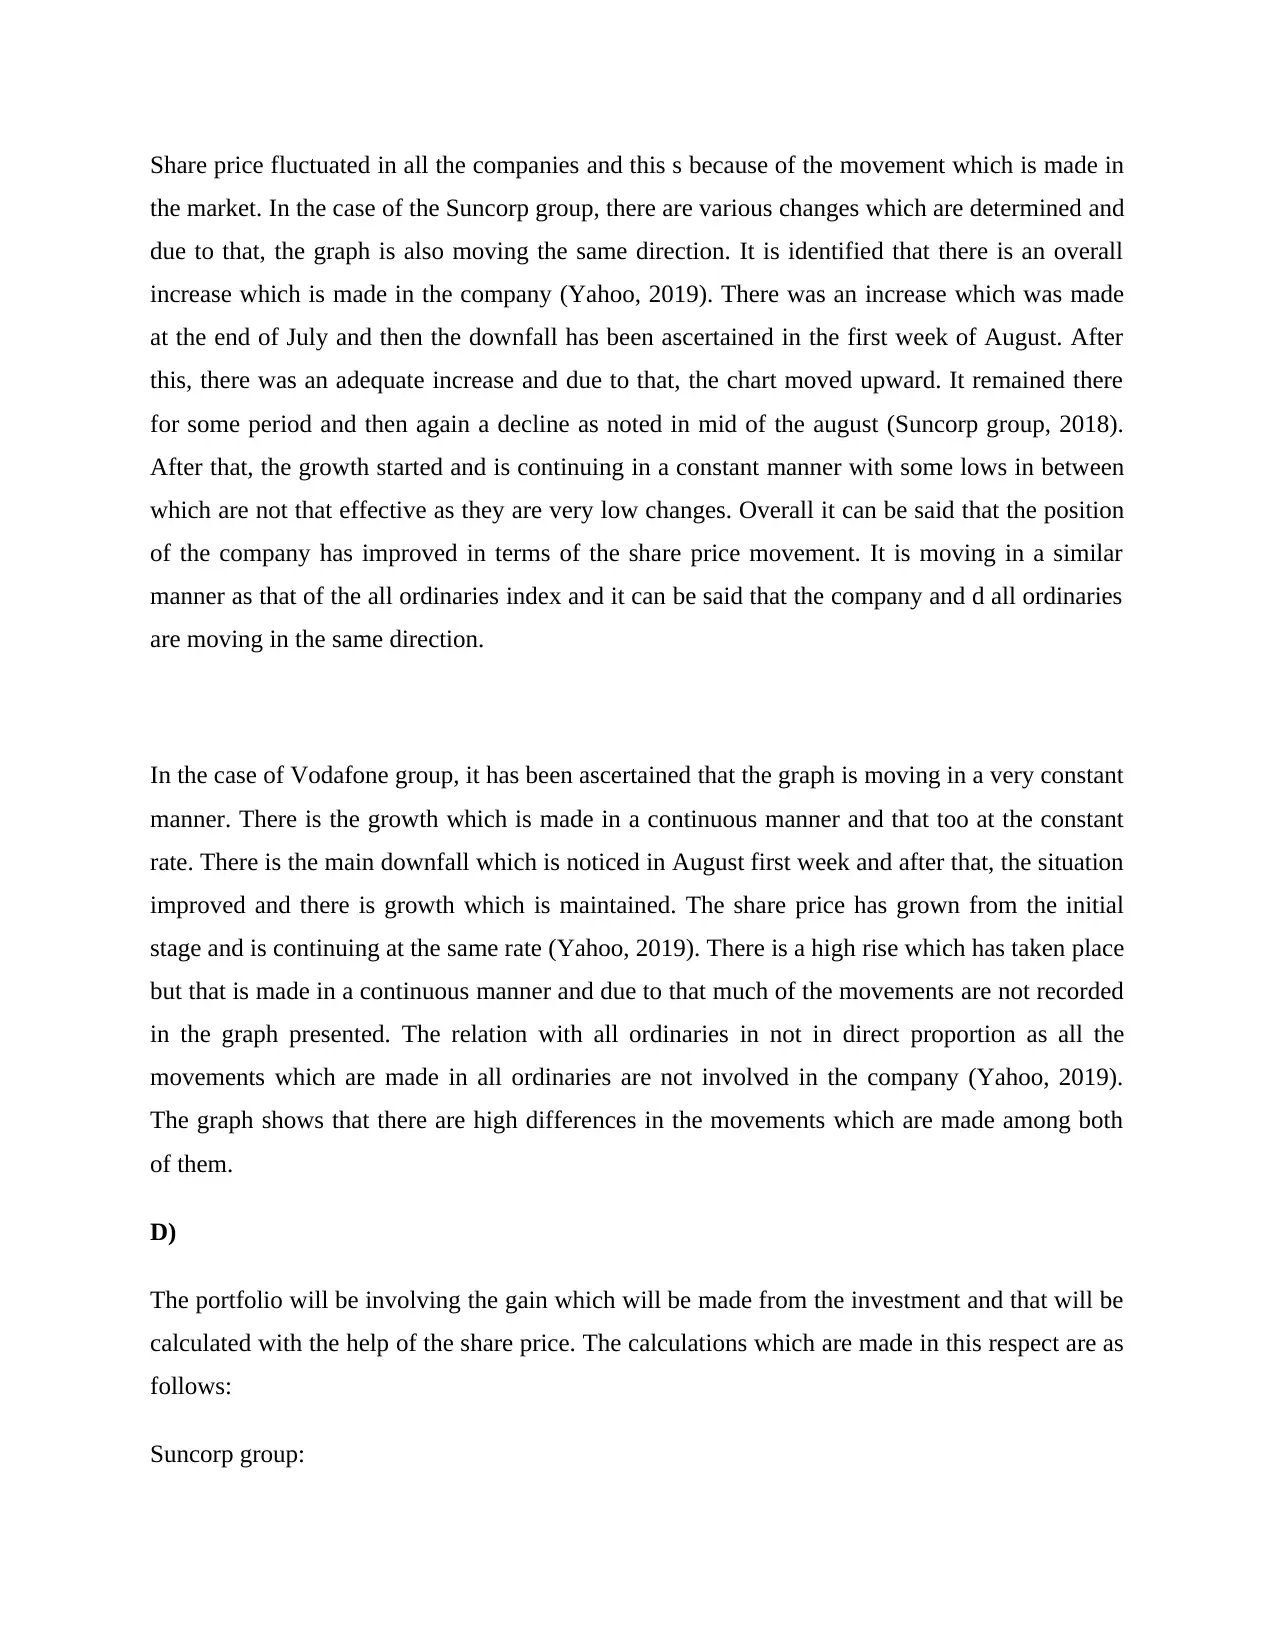
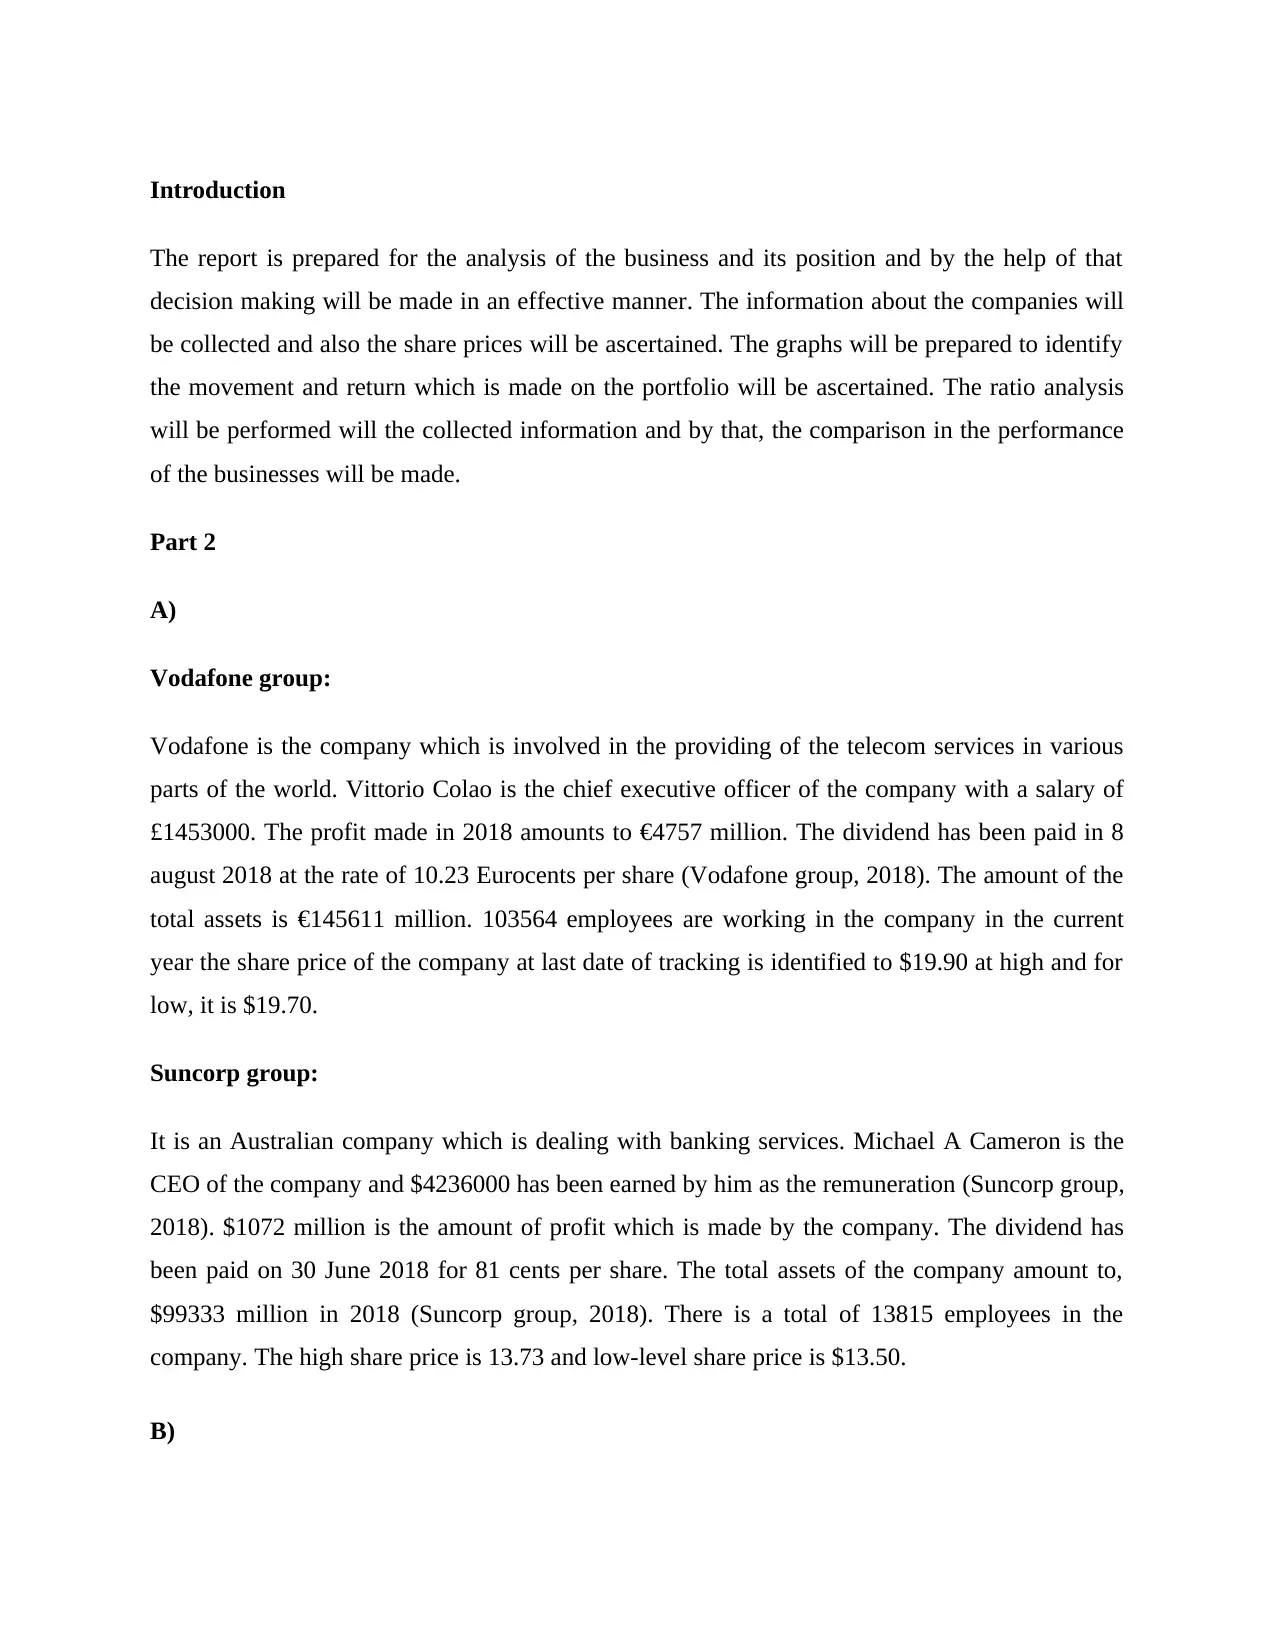
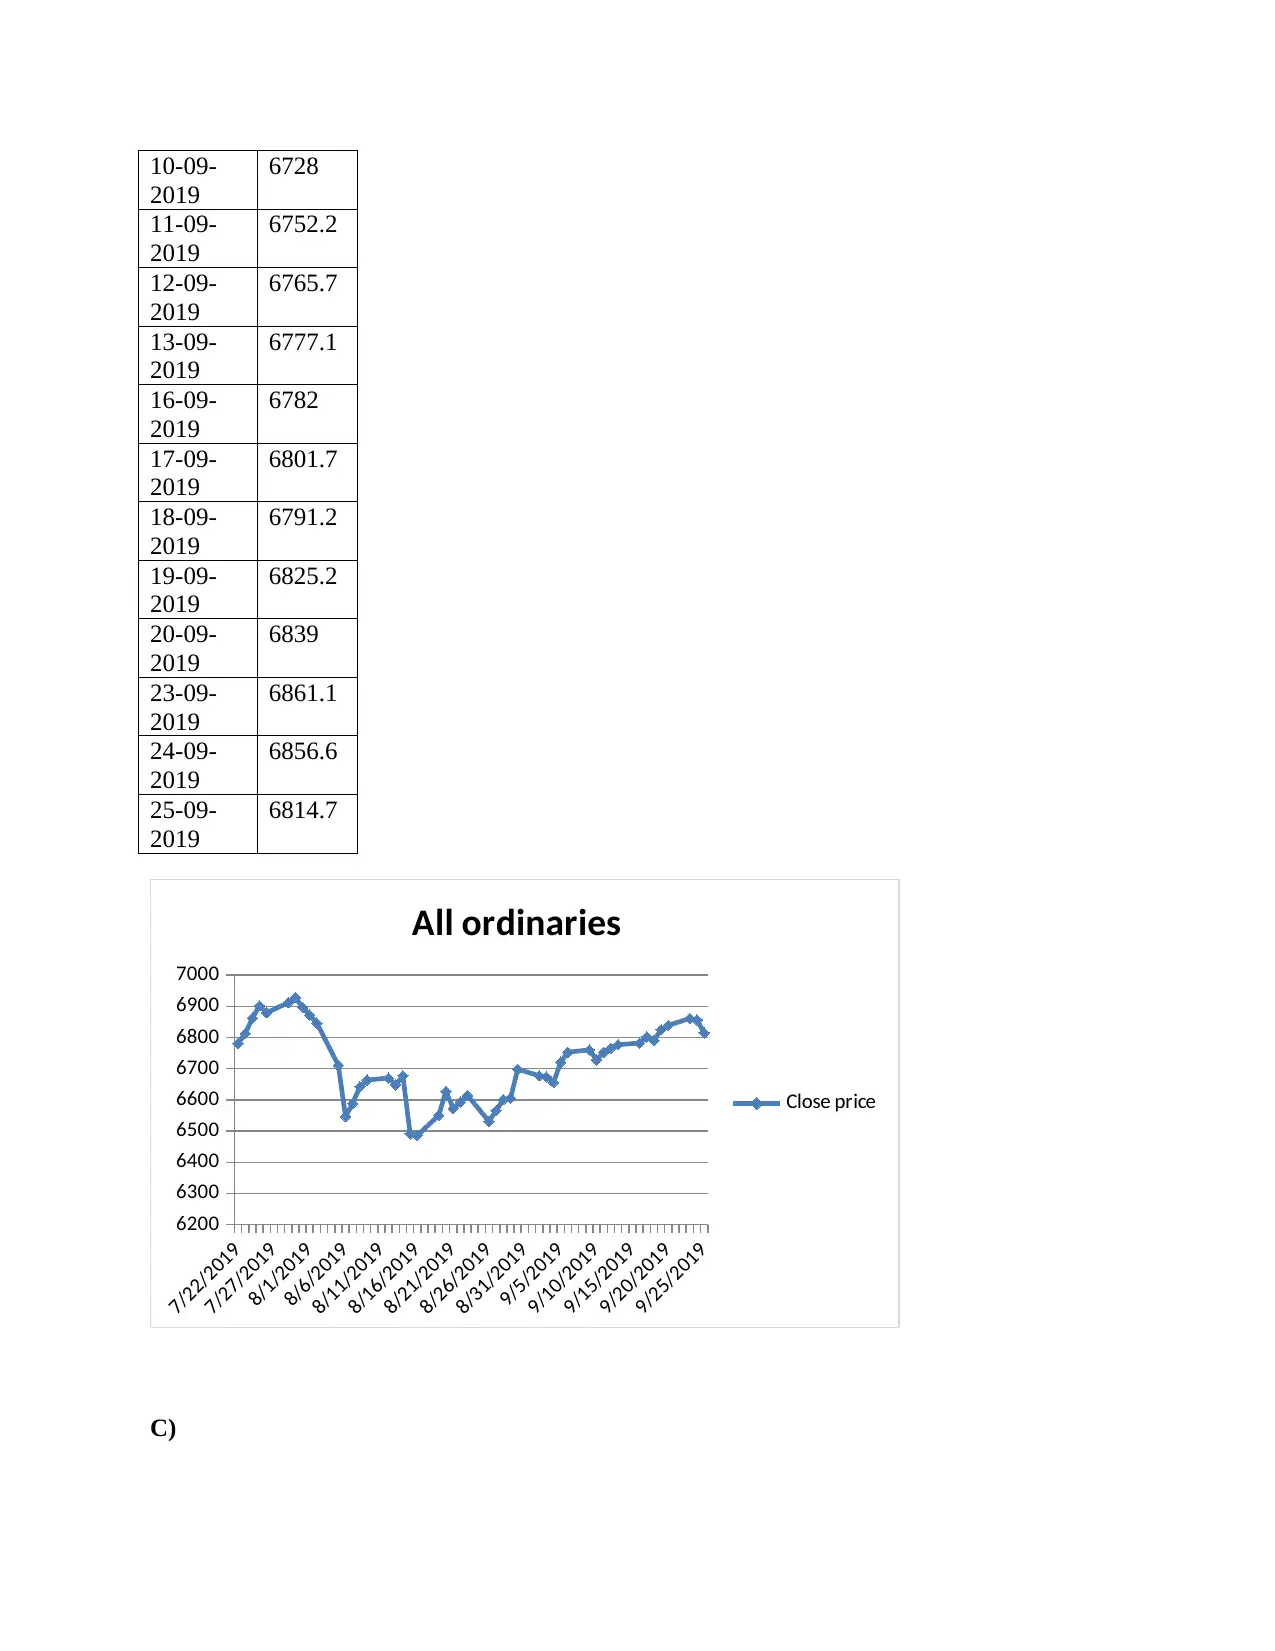
Share price fluctuated in all the companies and this s because of the movement which is made in
the market. In the case of the Suncorp group, there are various changes which are determined and
due to that, the graph is also moving the same direction. It is identified that there is an overall
increase which is made in the company (Yahoo, 2019). There was an increase which was made
at the end of July and then the downfall has been ascertained in the first week of August. After
this, there was an adequate increase and due to that, the chart moved upward. It remained there
for some period and then again a decline as noted in mid of the august (Suncorp group, 2018).
After that, the growth started and is continuing in a constant manner with some lows in between
which are not that effective as they are very low changes. Overall it can be said that the position
of the company has improved in terms of the share price movement. It is moving in a similar
manner as that of the all ordinaries index and it can be said that the company and d all ordinaries
are moving in the same direction.
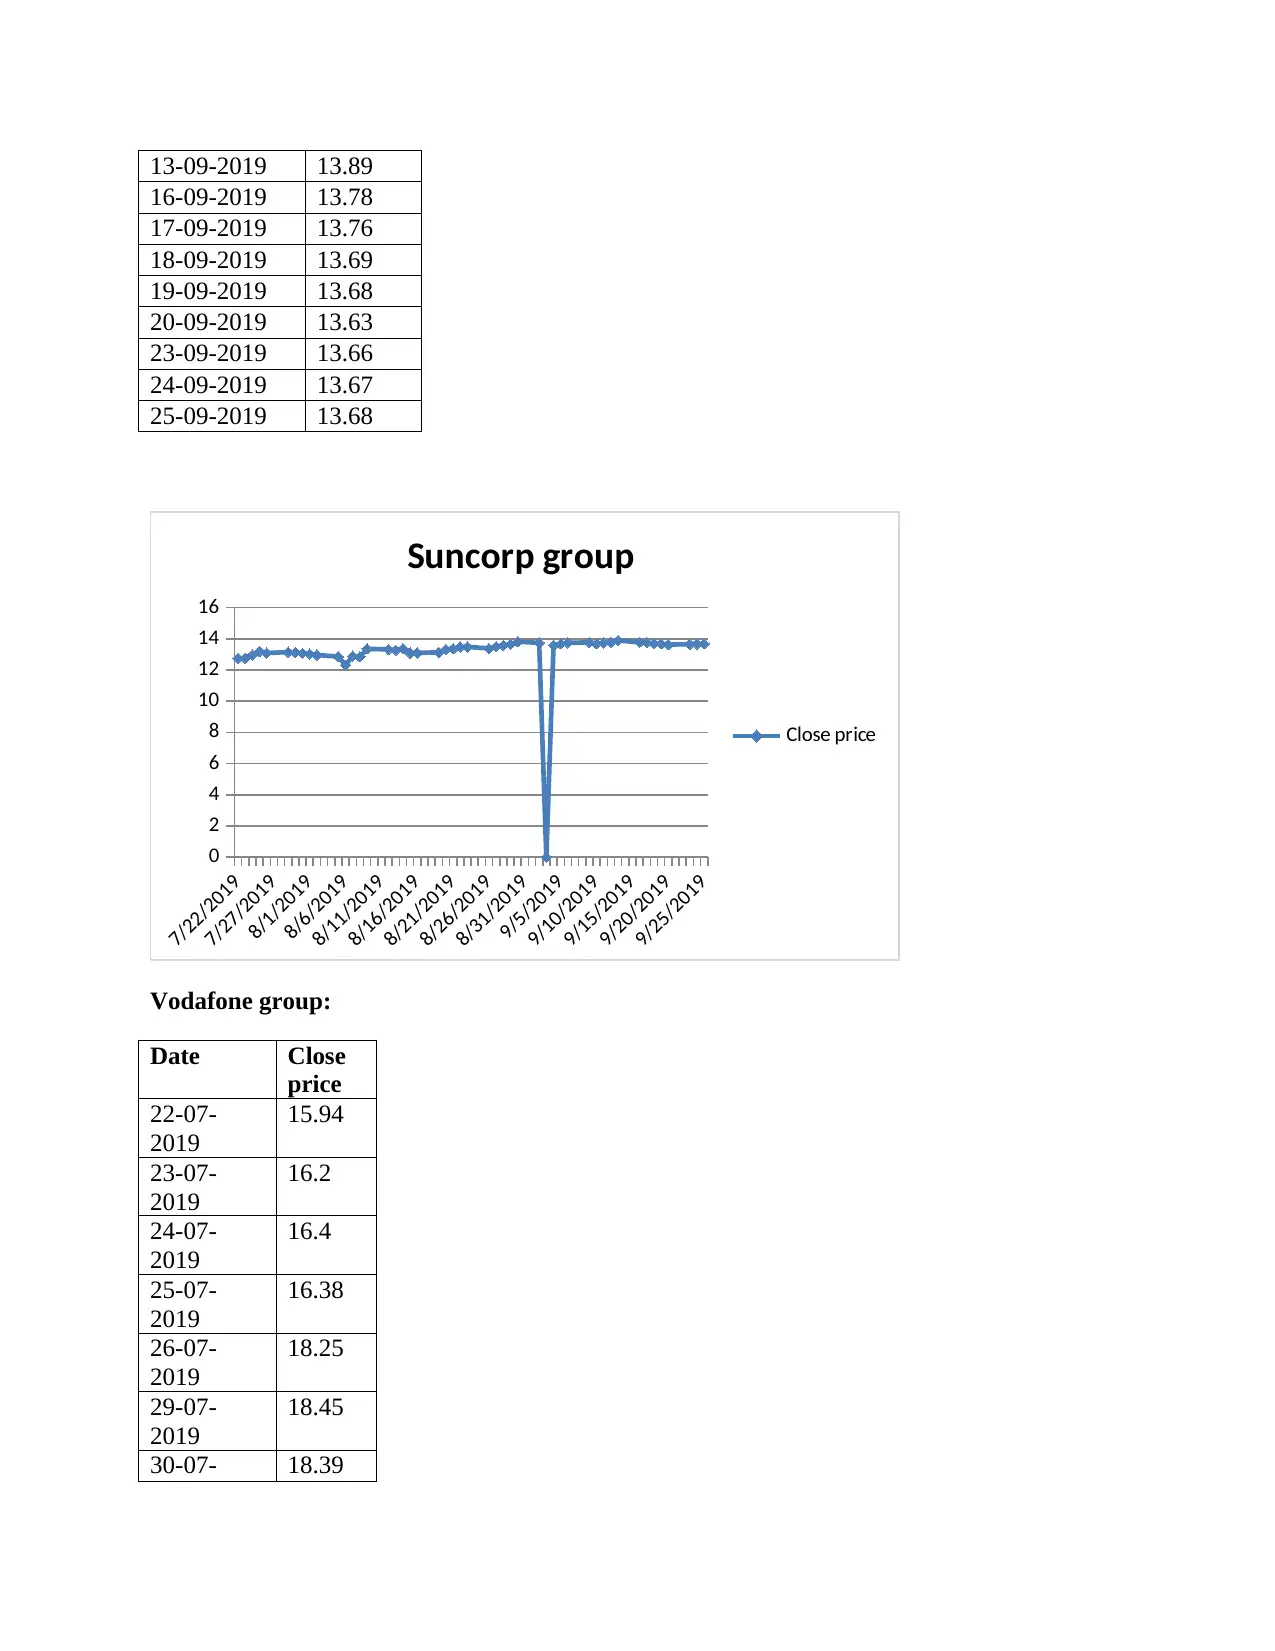
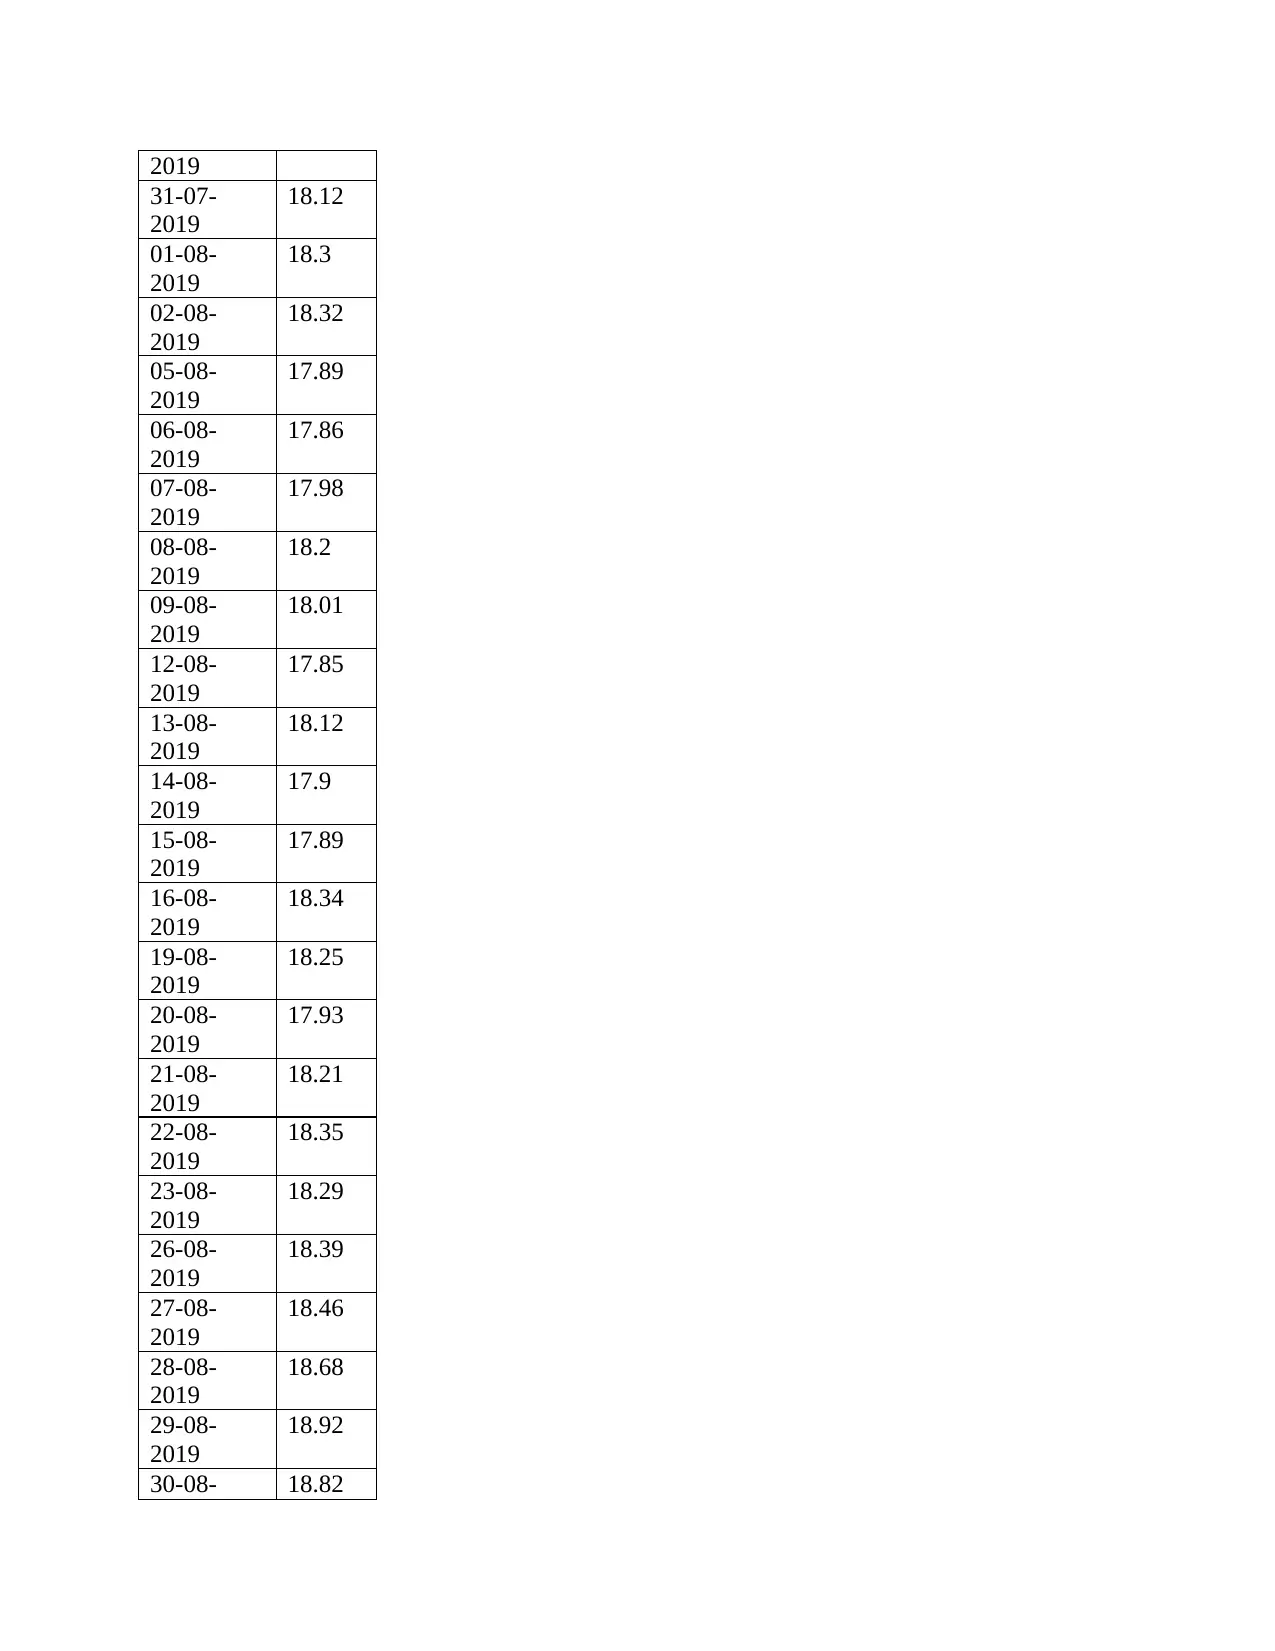
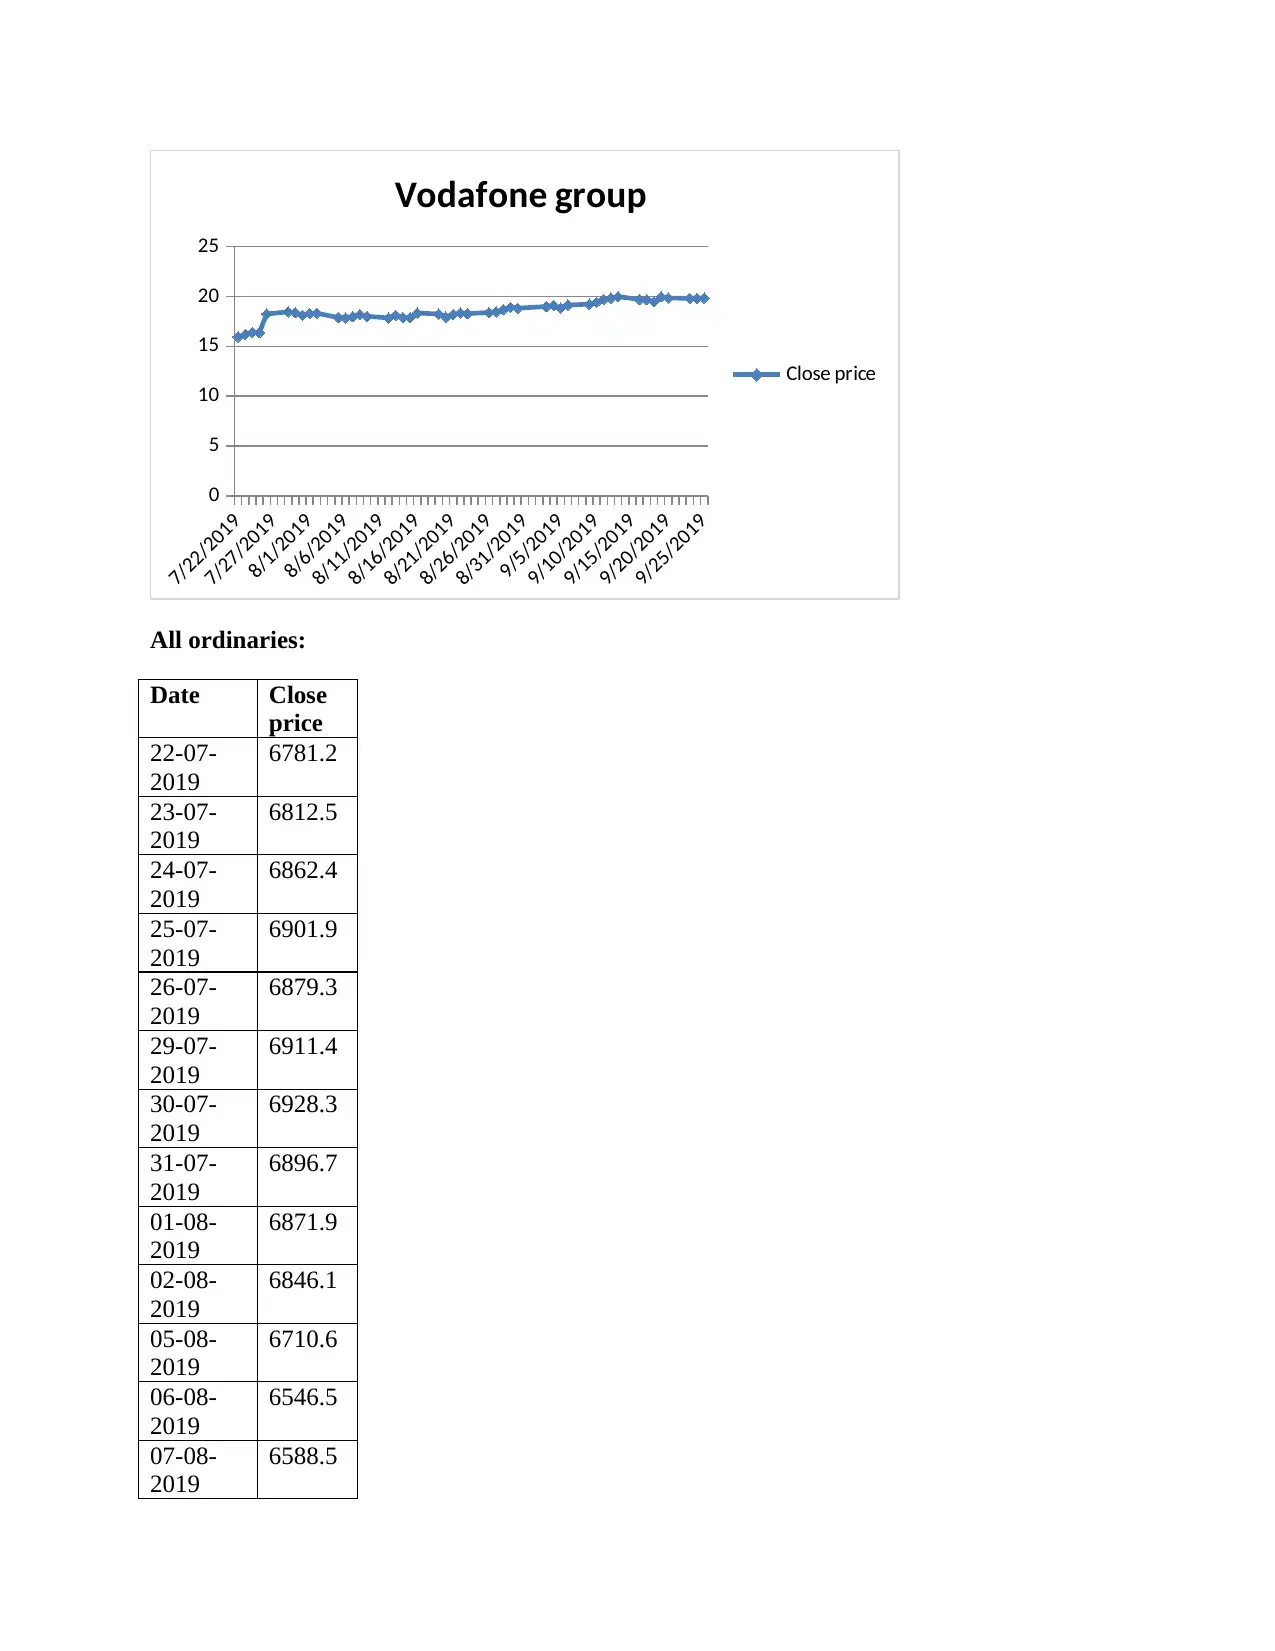
In the case of Vodafone group, it has been ascertained that the graph is moving in a very constant
manner. There is the growth which is made in a continuous manner and that too at the constant
rate. There is the main downfall which is noticed in August first week and after that, the situation
improved and there is growth which is maintained. The share price has grown from the initial
stage and is continuing at the same rate (Yahoo, 2019). There is a high rise which has taken place
but that is made in a continuous manner and due to that much of the movements are not recorded
in the graph presented. The relation with all ordinaries in not in direct proportion as all the
movements which are made in all ordinaries are not involved in the company (Yahoo, 2019).
The graph shows that there are high differences in the movements which are made among both
of them.
D)
The portfolio will be involving the gain which will be made from the investment and that will be
calculated with the help of the share price. The calculations which are made in this respect are as
follows:
Suncorp group:
the market. In the case of the Suncorp group, there are various changes which are determined and
due to that, the graph is also moving the same direction. It is identified that there is an overall
increase which is made in the company (Yahoo, 2019). There was an increase which was made
at the end of July and then the downfall has been ascertained in the first week of August. After
this, there was an adequate increase and due to that, the chart moved upward. It remained there
for some period and then again a decline as noted in mid of the august (Suncorp group, 2018).
After that, the growth started and is continuing in a constant manner with some lows in between
which are not that effective as they are very low changes. Overall it can be said that the position
of the company has improved in terms of the share price movement. It is moving in a similar
manner as that of the all ordinaries index and it can be said that the company and d all ordinaries
are moving in the same direction.
In the case of Vodafone group, it has been ascertained that the graph is moving in a very constant
manner. There is the growth which is made in a continuous manner and that too at the constant
rate. There is the main downfall which is noticed in August first week and after that, the situation
improved and there is growth which is maintained. The share price has grown from the initial
stage and is continuing at the same rate (Yahoo, 2019). There is a high rise which has taken place
but that is made in a continuous manner and due to that much of the movements are not recorded
in the graph presented. The relation with all ordinaries in not in direct proportion as all the
movements which are made in all ordinaries are not involved in the company (Yahoo, 2019).
The graph shows that there are high differences in the movements which are made among both
of them.
D)
The portfolio will be involving the gain which will be made from the investment and that will be
calculated with the help of the share price. The calculations which are made in this respect are as
follows:
Suncorp group:
= (13.68-12.76)/12.76*100
= 7.24%
Vodafone group:
= (19.84-15.94)/15.94*100
= 24.47%
The overall return will be calculated by considering the weights of both the investments which
are in equal proportion and that will yield:
= (7.24*.5)+(24.47*.5)
=15.86%
It can be said from the above calculation that the earnings on the portfolio will be for 15.86%.
E)
The movements which are taking place in the share price have been considered and it has been
determined that in the Suncorp group there are declines which are faced but they are covered in
short time and then the rise is made. There is the growth which is made in total terms and the rat
of the earning is also good which will be beneficial for the investors. Due to this the shares will
be considered and included in the portfolio and buying of them will be considered.
In the case of Vodafone group, there is less risk as the movement is made in a continuous
manner and there is high return which is made. This will be in the interest and the shares will be
purchased to be incorporated in the portfolio.
Part 3
A)
Identification of key financial data:
Particulars Suncorp
group
Vodafone
group
⊘ This is a preview!⊘
Do you want full access?
Subscribe today to unlock all pages.
Trusted by 1+ million students worldwide
1 out of 20
Your All-in-One AI-Powered Toolkit for Academic Success.
+13062052269
info@desklib.com
Available 24*7 on WhatsApp / Email
![[object Object]](/_next/static/media/star-bottom.7253800d.svg)
Unlock your academic potential
Copyright © 2020–2026 A2Z Services. All Rights Reserved. Developed and managed by ZUCOL.