Comprehensive Analysis of a Hybrid Energy System for Sharjah Airport
VerifiedAdded on 2022/11/13
|47
|8992
|91
Report
AI Summary
This report presents a comprehensive analysis of a hybrid energy system proposed for Sharjah Airport. It begins with an overview of the airport's energy requirements and the growing need for sustainable practices within the aviation industry. The study explores the implementation of a hybrid power system, focusing on solar photovoltaic (PV) technology and waste-to-energy conversion. The methodology includes site reconnaissance, detailed descriptions of solar PV and waste-to-energy implementations, and simulations using PVsyst and Homer Pro software to assess the feasibility and performance of the proposed system. The report also includes a carbon savings analysis, discusses potential improvements, and concludes with a summary of the findings, emphasizing the benefits of renewable energy integration for airports. The report also references relevant literature and provides tables and figures to support the analysis. The study highlights the commitment of Sharjah Airport to sustainability and the UAE's goals for reducing carbon emissions, making it a valuable resource for understanding the transition to renewable energy in airport operations.

[Author name]
[Date]
Sharjah Airport hybrid energy system
Declaration
Abstract
Airport's primary role is to give passengers and cargo access to air transport. Over the previous
20 years, the amount of aviation activities has grown quickly, resulting in an increase in the
energy consumption of airports. As a result, airport executives have increased energy costs. At
the same moment worldwide power usage has risen, with the consequent environmental effect,
owing to the requirements of developing economies such as China and India.
This complicated situation of environmental and economic variables has made airport executives
conscious of the need to decrease costs and efficiently use renewable energy, while conserving
the environment. This dissertation aims to introduce a hybrid power system at Sharjah airport in
more latest studies, beginning with a description of key power requirements, power
implementation and power efficiency measures, the establishment and benchmarking of hybrid
systems in airports as well as the modelling and simulation of power sources.
Acknowledgement
1
Paraphrase This Document
Need a fresh take? Get an instant paraphrase of this document with our AI Paraphraser
[Author name]
[Date]
Sharjah Airport hybrid energy system
Table of Contents
Declaration.......................................................................................................................................1
Abstract............................................................................................................................................1
Acknowledgement...........................................................................................................................1
List of figures..................................................................................................................................2
List of tables...................................................................................................................................3
1.0 Introduction.........................................................................................................................4
1.2 literature review..............................................................................................................4
2.0 Methodology.............................................................................................................................7
2.1 Site reconnaissance..............................................................................................................7
2.2 Implementation of Hybrid Energy System........................................................................9
2.2.1 Implementation of Solar PV...................................................................................9
2.2.2 Waste to energy implementation................................................................................13
3.0Analysis and Feasibility study...............................................................................................15
3.1 PVsyst simulation...............................................................................................................16
3.2 Homer pro simulation........................................................................................................24
levelized cost of energy calculations.......................................................................................32
4 Carbon Saving...........................................................................................................................35
5. Possibilities of improvement...................................................................................................38
6. Conclusion................................................................................................................................41
References..................................................................................................................................43
List of figures
Figure 1 an aerial view of the proposed site, (Tsierkezou, 2019)....................................................8
Figure 2 geographical view of the project site.................................................................................8
Figure 3 system schematic for photovoltaics from (Bocskor, Hunyadi and Vince, 2017)............10
Figure 4 an overview of UAE sunlight distribution during peak and low periods........................11
Figure 5 solar panels......................................................................................................................11
Figure 6 sample transformer format..............................................................................................13
Figure 7 sample collection bins kept inside the building..............................................................14
Figure 8 flowchart showing waste to Energy through incineration functionality.........................15
2
[Author name]
[Date]
Sharjah Airport hybrid energy system
Figure 9 PVsyst block diagram, showing the array and system losses.........................................16
Figure 10 geographical site location, through which simulation data was obtained.....................17
Figure 11 meteorological data for the site, imported from meteo data NASA-SSE satellite data
.......................................................................................................................................................17
Figure 12 fixed PV angle, 20 degrees. The angle is fixed since the surface used is already
established. It is estimated to be 20 degrees..................................................................................18
Figure 13 global system configurations.........................................................................................19
Figure 14 site location, images from google maps........................................................................24
Figure 15 types of components in homer......................................................................................25
Figure 16 site selection in Homer pro software.............................................................................25
Figure 17 homer pro model...........................................................................................................25
Figure 18 convertor specifications used for solar conversions......................................................26
Figure 19 solar GHI resources.......................................................................................................28
Figure 20 Temperature resources..................................................................................................28
Figure 21 a letter retrieved from the company’s website; this shows how relevant the project is
the project too the company (Sharjahairport.ae, 2019)..................................................................36
Figure 22 (Sharjahairport.ae, 2019)...............................................................................................37
Figure 23 sample new improvemnet that can be implemented in the project, idea sourced from
(Bocskor, Hunyadi and Vince, 2017)..........................................................................................40
List of tables
Table 1 showing the Sharjah photovoltaic systems energy output................................................21
Table 2 solar panel used................................................................................................................26
Table 3 solar horizontal radiation per month.................................................................................27
Table 4 general solar statistics.......................................................................................................29
Table 5 photovoltaic systems output.............................................................................................29
Table 6 cumulative discount cash flow.........................................................................................29
Table 7 grid rates for all.................................................................................................................30
Table 8 project costs......................................................................................................................31
3
⊘ This is a preview!⊘
Do you want full access?
Subscribe today to unlock all pages.
Trusted by 1+ million students worldwide
[Author name]
[Date]
Sharjah Airport hybrid energy system
1.0 Introduction
Environmental concerns about the use of fossil fuels to generate electricity have sparked interest
in the use of renewable energy resources. Specifically, fast developments in wind turbine
generators and photovoltaic techniques have provided possibilities for the use of wind and solar
resources for global electricity generation. Solar and wind energy systems are omnipresent,
freely accessible and environmentally friendly and, owing to their availability and topological
benefits for local power generations, are regarded as promising power generating sources.
Using various energy sources enables energy production system efficiency and reliability to be
improved and decreases the demands for energy storage compared to devices consisting of only
one renewable energy source. With the complementary features of solar and wind energy for
certain places, embedded renewable solar / wind power generation systems with storage banks
provide an extremely reliable power source that is appropriate for electrical loads requiring
greater reliability such as the health clinic.
The airport of Sharjah has committed itself for a long time to create a sustainable future. “We
work and improve the airport in line with the sustainable development values and recognize that
our achievement can be improved by conducting company in an environmentally, socially and
economically accountable manner” quoted from the airport website.
By pursuing a Reduce, Reuse, Recycle Strategy, we place sustainability at the core of our
activities. Initiatives include rigorous surveillance of the consumption of electricity and water
and an integrated waste management scheme for zero waste (Sharjahairport.ae, 2019).
Airport infrastructure and its constant development emphasis on the vision and capital growth of
a country, which makes the importance to focus on various aspects such as optimized energy
management and power usage. United Arab Emirates aim to reduce its carbon footprint to 30%
by 2030 and affirmed the plan to generate nearly 25% of its electricity from clean energy source
by 2021(sourced from https://www.government.ae).
With reference to the previous years, especially the last decade, the operating environment for
airport has changed drastically which can be noticed in the cost of operation to increase in the
energy needs. Pollutants from conventional generation methods such as combustion of fossil
fuels, impacts the environment in a major manner contributing to global warming. Airport
administration faces a complex scenario, both economically and politically to reduce energy
usage, and to minimize the environment footprint.
1.1 Aims and objects
This dissertation aims to introduce a hybrid power system at Sharjah airport in more latest
studies, beginning with a description of key power requirements, power implementation and
power efficiency measures, the establishment and benchmarking of hybrid systems in airports as
well as the modelling and simulation of power sources
4
Paraphrase This Document
Need a fresh take? Get an instant paraphrase of this document with our AI Paraphraser

[Author name]
[Date]
Sharjah Airport hybrid energy system
1.2 literature review
The use of renewable technologies as clean sources of energy minimizes environmental effects,
generates minimum secondary waste and is sustainable, depending on present and future
financial and social requirements. Airports are located in ideal places where renewable power
sources are installed, enabling their power needs to be supplied at least partially, and
guaranteeing compliance with the highest global security standards . Most practical and scientific
experiences describe a range of renewables techniques that can be used in airport systems.
Airports aim to maintain reducing fees and rental facilities to make them feasible as possible. To
achieve this, airlines are now exploring non-traditional sources of income and measures to save
costs. Meanwhile, suppliers of utilities have lately started to find possible answers for the
acquisition of renewable power options in order to fulfill national, regional and federal
environmental and energy objectives. Since airports often have access to land and equipment for
the hosting and generation of clean and renewable power sources, they can produce their own
power and save costs.
However, Hybrid systems energy is a complicated problem, and requires knowledge of emerging
technologies, mechanisms for fostering, legislative frameworks, as well as operational variables.
Airports are provided with restricted guidance for identifying, evaluating, selecting and
effectively implementing financial power projects for renewable energy.
Airports operate today in a changing environment that is influenced by interconnected world
economies. With the effects of a major recession and air travel on World Post 911 is more
expensive, airports are trying to provide more efficient and identifying services competitive
advantage. In particular, airports see opportunities to make full use of their space and facility
available to distribute their income sources.
However, airports come in various forms from large international metropolises to rural
transportation terminals and each has different needs and assets. According to the latest report
for Congress on the Integrated Airport System National Plan (NPIAS), there are 3,331 operating
General airports use in the United Arab Emirates (65% of all airports in the country), which
qualifies for receive funds under Airport Improvement Program (AIP). Given the wide
differences in their character, each airport will deploy their assets in a strategic and diverse
manner.
The similarity of these airports is their function as different government units. (Ninety-eight
percent of airports in NPIAS are owned by public bodies: 38% of cities, 25% of regions, 17%
county, and 9% multi-jurisdiction. From them, state ownership accounts for 5% and unified ports
authority account for 3%). (3) They all provide flight services to customers and are subject to
oversight of federal regulations. As a result, they must operate like businesses that provide
services and collect costs, while implementing public policy goals in their government
jurisdiction.
5
[Author name]
[Date]
Sharjah Airport hybrid energy system
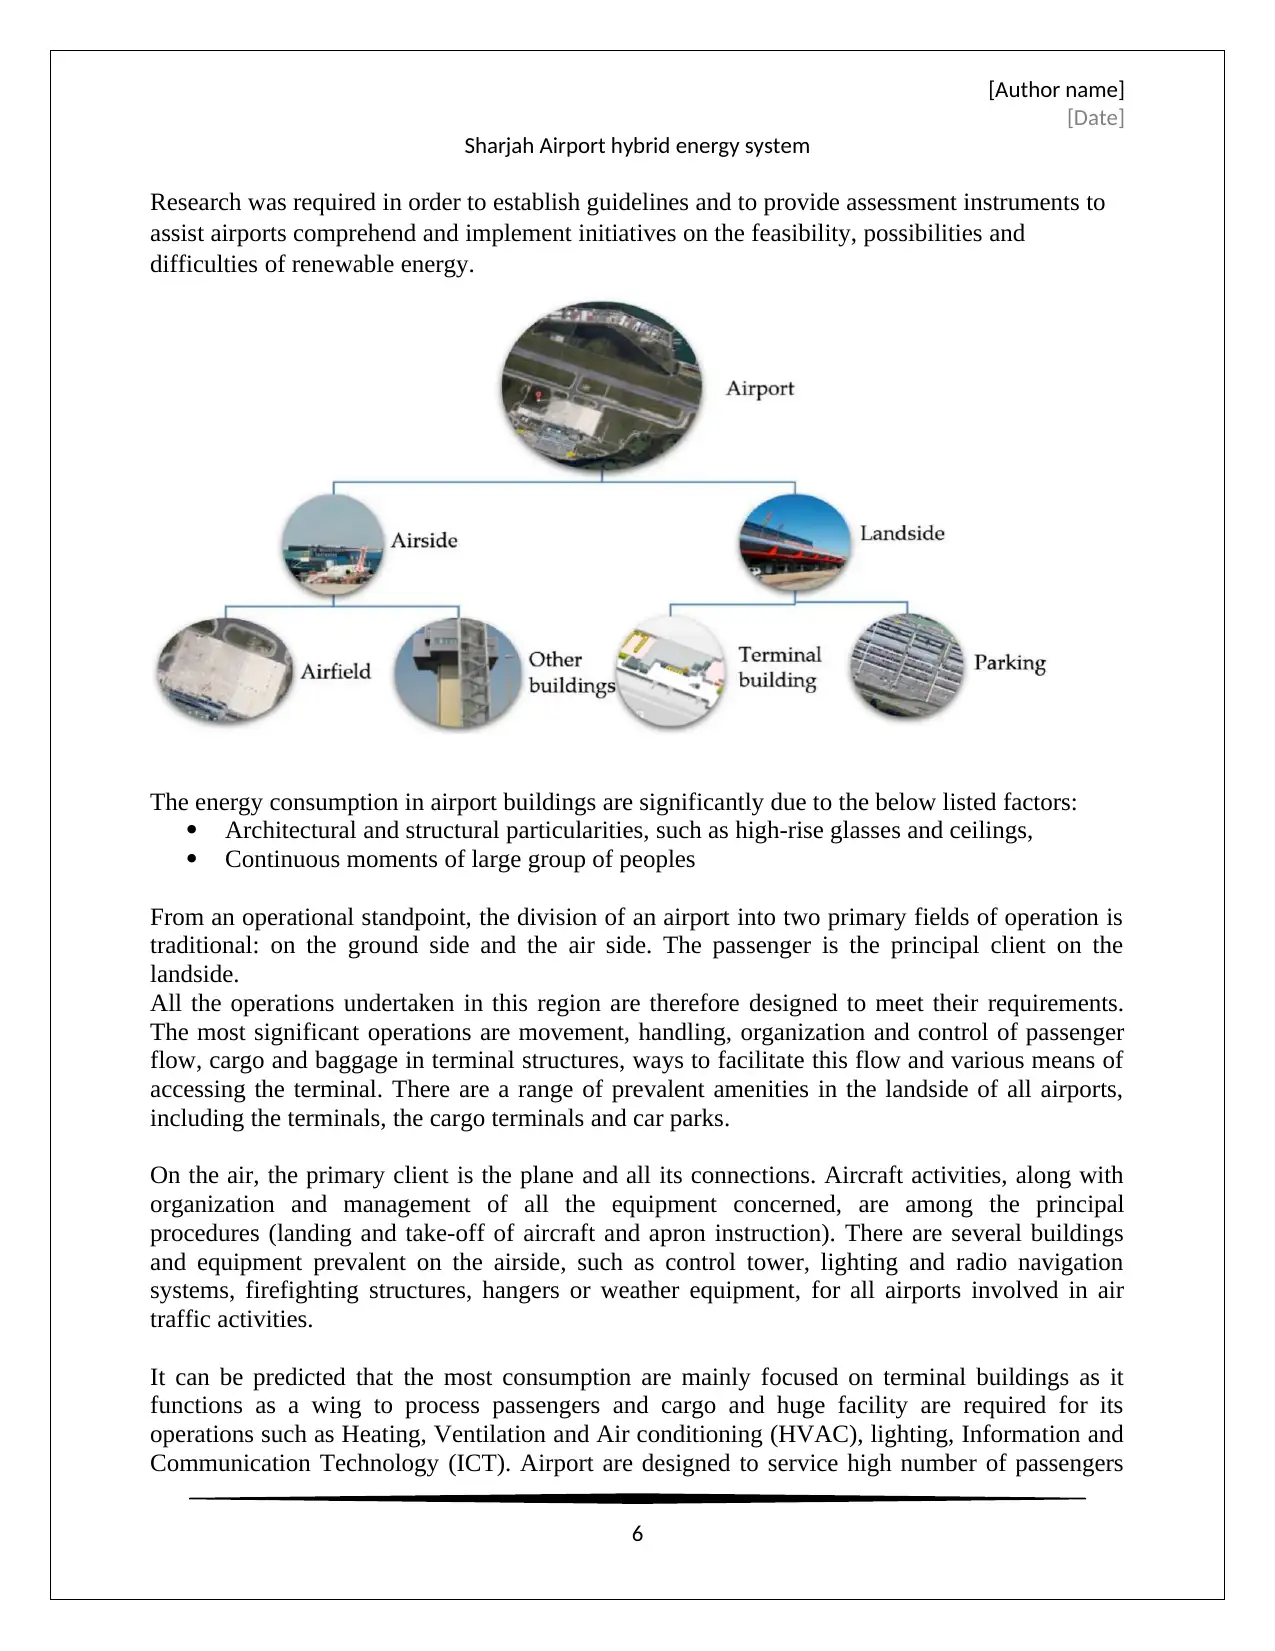
Research was required in order to establish guidelines and to provide assessment instruments to
assist airports comprehend and implement initiatives on the feasibility, possibilities and
difficulties of renewable energy.
The energy consumption in airport buildings are significantly due to the below listed factors:
Architectural and structural particularities, such as high-rise glasses and ceilings,
Continuous moments of large group of peoples
From an operational standpoint, the division of an airport into two primary fields of operation is
traditional: on the ground side and the air side. The passenger is the principal client on the
landside.
All the operations undertaken in this region are therefore designed to meet their requirements.
The most significant operations are movement, handling, organization and control of passenger
flow, cargo and baggage in terminal structures, ways to facilitate this flow and various means of
accessing the terminal. There are a range of prevalent amenities in the landside of all airports,
including the terminals, the cargo terminals and car parks.
On the air, the primary client is the plane and all its connections. Aircraft activities, along with
organization and management of all the equipment concerned, are among the principal
procedures (landing and take-off of aircraft and apron instruction). There are several buildings
and equipment prevalent on the airside, such as control tower, lighting and radio navigation
systems, firefighting structures, hangers or weather equipment, for all airports involved in air
traffic activities.
It can be predicted that the most consumption are mainly focused on terminal buildings as it
functions as a wing to process passengers and cargo and huge facility are required for its
operations such as Heating, Ventilation and Air conditioning (HVAC), lighting, Information and
Communication Technology (ICT). Airport are designed to service high number of passengers
6
[Date]
Sharjah Airport hybrid energy system
Research was required in order to establish guidelines and to provide assessment instruments to
assist airports comprehend and implement initiatives on the feasibility, possibilities and
difficulties of renewable energy.
The energy consumption in airport buildings are significantly due to the below listed factors:
Architectural and structural particularities, such as high-rise glasses and ceilings,
Continuous moments of large group of peoples
From an operational standpoint, the division of an airport into two primary fields of operation is
traditional: on the ground side and the air side. The passenger is the principal client on the
landside.
All the operations undertaken in this region are therefore designed to meet their requirements.
The most significant operations are movement, handling, organization and control of passenger
flow, cargo and baggage in terminal structures, ways to facilitate this flow and various means of
accessing the terminal. There are a range of prevalent amenities in the landside of all airports,
including the terminals, the cargo terminals and car parks.
On the air, the primary client is the plane and all its connections. Aircraft activities, along with
organization and management of all the equipment concerned, are among the principal
procedures (landing and take-off of aircraft and apron instruction). There are several buildings
and equipment prevalent on the airside, such as control tower, lighting and radio navigation
systems, firefighting structures, hangers or weather equipment, for all airports involved in air
traffic activities.
It can be predicted that the most consumption are mainly focused on terminal buildings as it
functions as a wing to process passengers and cargo and huge facility are required for its
operations such as Heating, Ventilation and Air conditioning (HVAC), lighting, Information and
Communication Technology (ICT). Airport are designed to service high number of passengers
6
⊘ This is a preview!⊘
Do you want full access?
Subscribe today to unlock all pages.
Trusted by 1+ million students worldwide
[Author name]
[Date]
Sharjah Airport hybrid energy system
for short peak period, which might rise a concern for electricity provider especially when the
network is isolated from the grid.
Due to the above concerns, many airports in the world has implemented the use of Renewable
Energy sources (RES). A few of the pioneered are as listed below
Cochin International Airport, Kerala, India, is the first airport in world to claim 100% solar
powered Airport. CIA houses 12MWp solar power plant, comprising of 46150 solar panels laid
across 45 acres. With this installed panels, the airport can consume around 50,000 to 60,000 unit
of electricity on daily basis for its operational function, which makes the airport power neutral.
(https://economictimes.indiatimes.com)
Gatwick airport, UK, is the only airport in the world to implement a waste to energy and biomass
generation facility, having the capability to dispose category 1 waste.
In particular, airports consume a great deal of energy. The airport's energy consumption is
stochastic, non-linear and dynamic, influenced by many elements. The study on energy
consumption focuses primarily on terminal structures, although they are only part of the entire
airport. The following describes the primary energy customers at airports, dividing them between
the primary airport fields: the landsides and the airports.
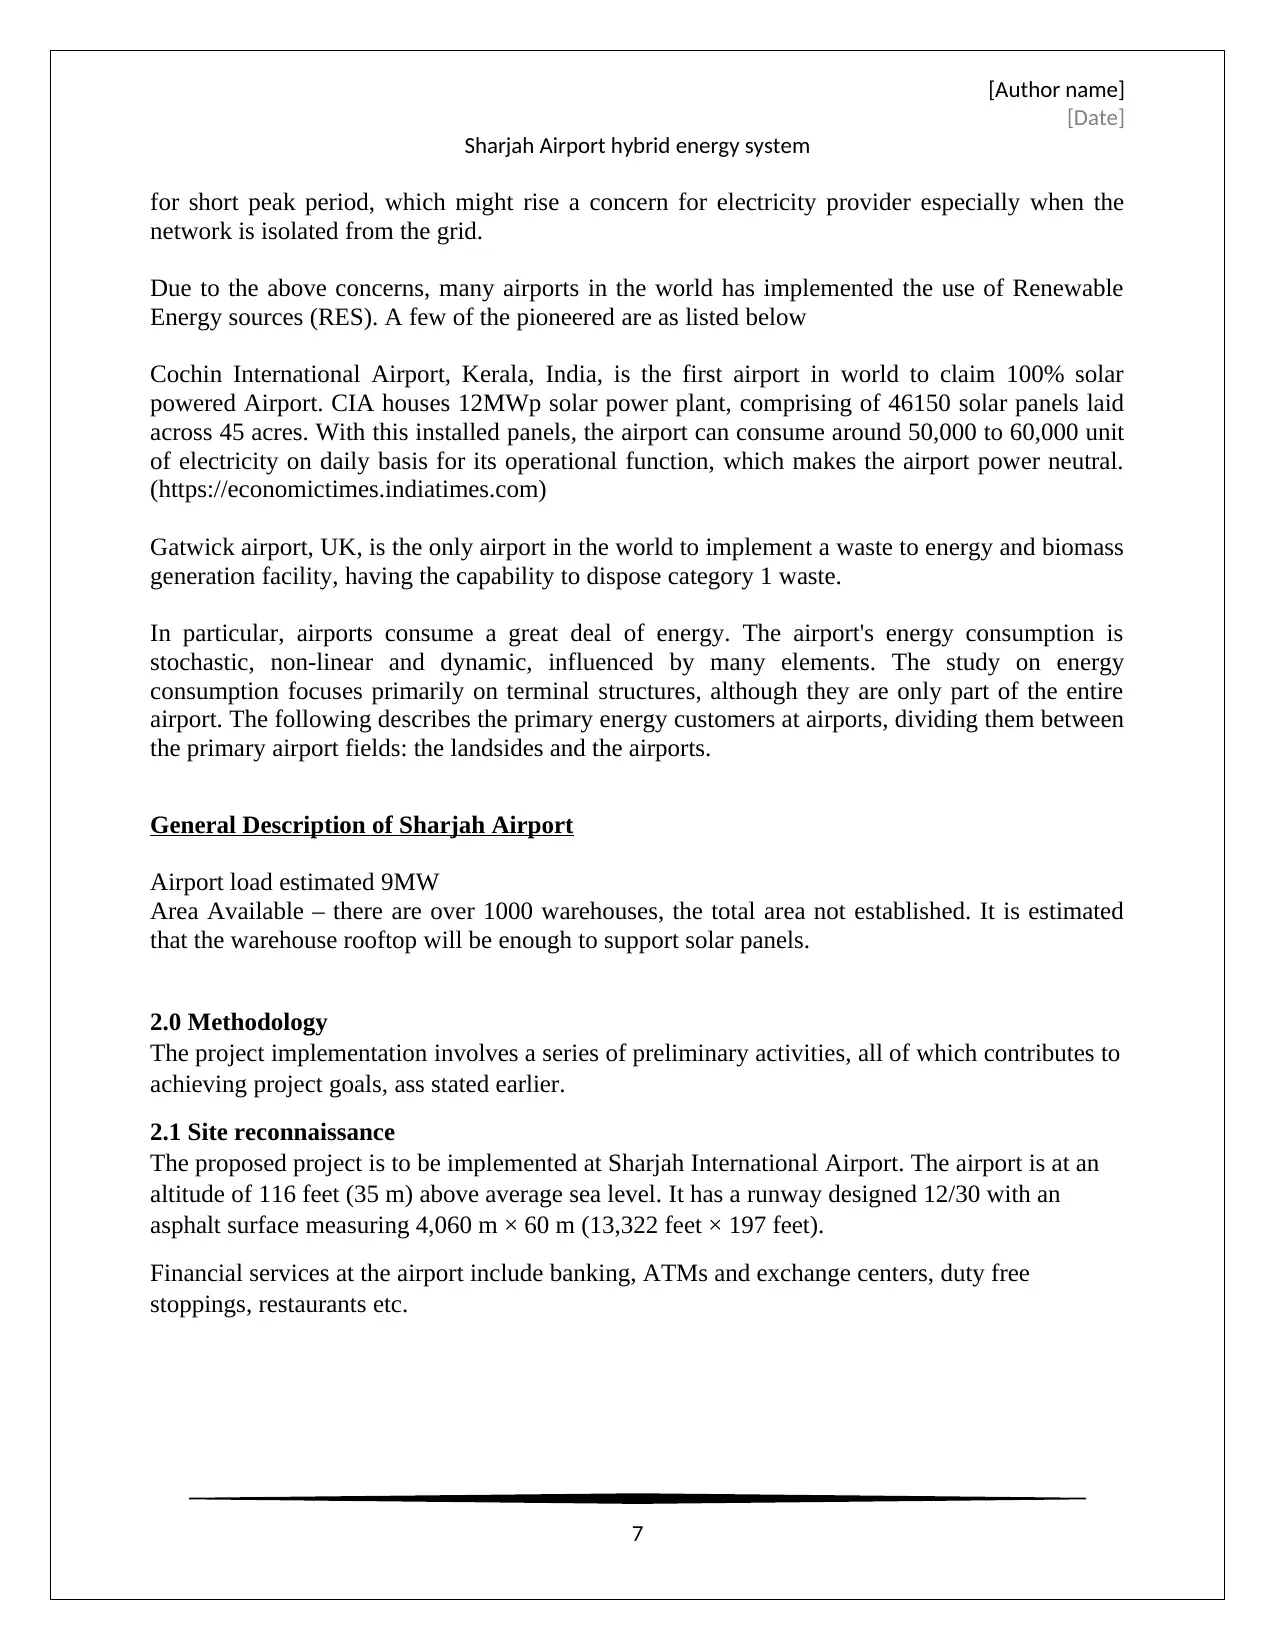
General Description of Sharjah Airport
Airport load estimated 9MW
Area Available – there are over 1000 warehouses, the total area not established. It is estimated
that the warehouse rooftop will be enough to support solar panels.
2.0 Methodology
The project implementation involves a series of preliminary activities, all of which contributes to
achieving project goals, ass stated earlier.
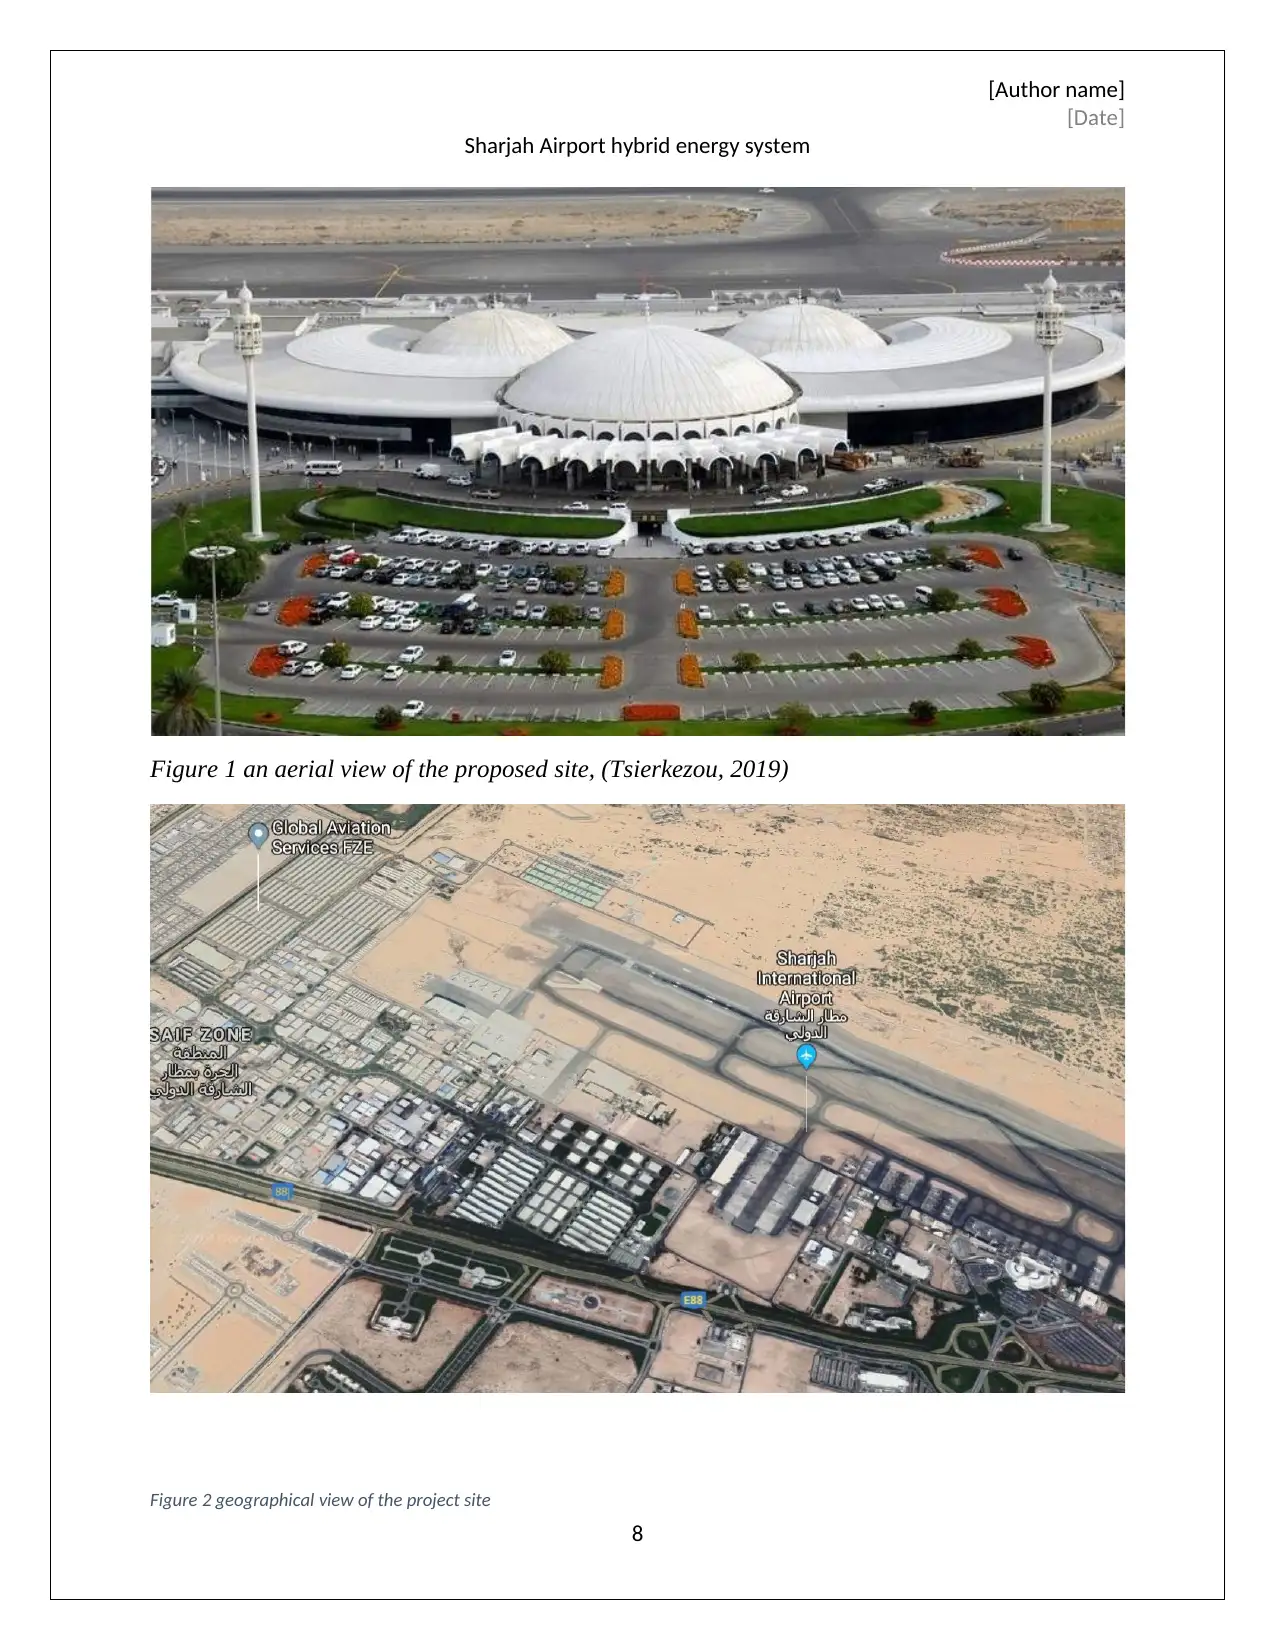
2.1 Site reconnaissance
The proposed project is to be implemented at Sharjah International Airport. The airport is at an
altitude of 116 feet (35 m) above average sea level. It has a runway designed 12/30 with an
asphalt surface measuring 4,060 m × 60 m (13,322 feet × 197 feet).
Financial services at the airport include banking, ATMs and exchange centers, duty free
stoppings, restaurants etc.
7
[Date]
Sharjah Airport hybrid energy system
for short peak period, which might rise a concern for electricity provider especially when the
network is isolated from the grid.
Due to the above concerns, many airports in the world has implemented the use of Renewable
Energy sources (RES). A few of the pioneered are as listed below
Cochin International Airport, Kerala, India, is the first airport in world to claim 100% solar
powered Airport. CIA houses 12MWp solar power plant, comprising of 46150 solar panels laid
across 45 acres. With this installed panels, the airport can consume around 50,000 to 60,000 unit
of electricity on daily basis for its operational function, which makes the airport power neutral.
(https://economictimes.indiatimes.com)
Gatwick airport, UK, is the only airport in the world to implement a waste to energy and biomass
generation facility, having the capability to dispose category 1 waste.
In particular, airports consume a great deal of energy. The airport's energy consumption is
stochastic, non-linear and dynamic, influenced by many elements. The study on energy
consumption focuses primarily on terminal structures, although they are only part of the entire
airport. The following describes the primary energy customers at airports, dividing them between
the primary airport fields: the landsides and the airports.
General Description of Sharjah Airport
Airport load estimated 9MW
Area Available – there are over 1000 warehouses, the total area not established. It is estimated
that the warehouse rooftop will be enough to support solar panels.
2.0 Methodology
The project implementation involves a series of preliminary activities, all of which contributes to
achieving project goals, ass stated earlier.
2.1 Site reconnaissance
The proposed project is to be implemented at Sharjah International Airport. The airport is at an
altitude of 116 feet (35 m) above average sea level. It has a runway designed 12/30 with an
asphalt surface measuring 4,060 m × 60 m (13,322 feet × 197 feet).
Financial services at the airport include banking, ATMs and exchange centers, duty free
stoppings, restaurants etc.
7
Paraphrase This Document
Need a fresh take? Get an instant paraphrase of this document with our AI Paraphraser
[Author name]
[Date]
Sharjah Airport hybrid energy system
Figure 1 an aerial view of the proposed site, (Tsierkezou, 2019)
8
Figure 2 geographical view of the project site
[Date]
Sharjah Airport hybrid energy system
Figure 1 an aerial view of the proposed site, (Tsierkezou, 2019)
8
Figure 2 geographical view of the project site
[Author name]
[Date]
Sharjah Airport hybrid energy system
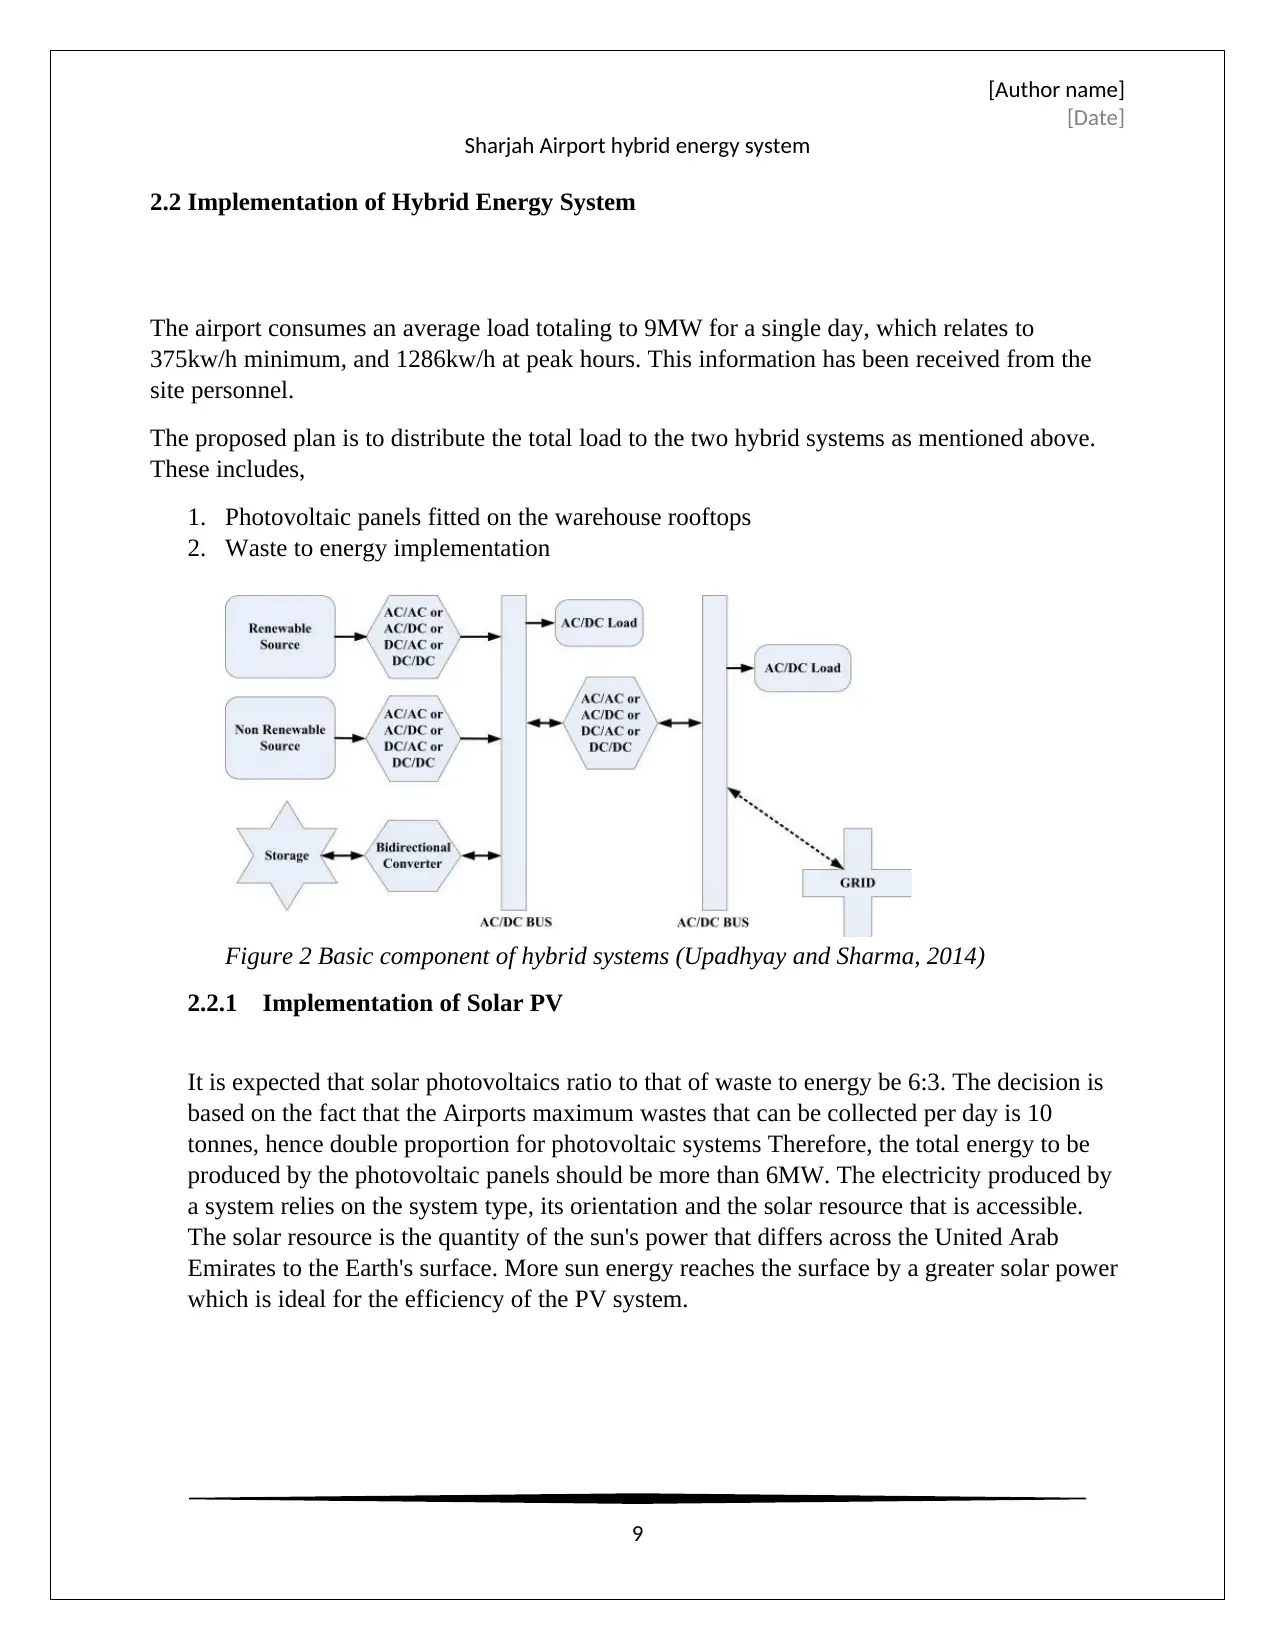
2.2 Implementation of Hybrid Energy System
The airport consumes an average load totaling to 9MW for a single day, which relates to
375kw/h minimum, and 1286kw/h at peak hours. This information has been received from the
site personnel.
The proposed plan is to distribute the total load to the two hybrid systems as mentioned above.
These includes,
1. Photovoltaic panels fitted on the warehouse rooftops
2. Waste to energy implementation
Figure 2 Basic component of hybrid systems (Upadhyay and Sharma, 2014)
2.2.1 Implementation of Solar PV
It is expected that solar photovoltaics ratio to that of waste to energy be 6:3. The decision is
based on the fact that the Airports maximum wastes that can be collected per day is 10
tonnes, hence double proportion for photovoltaic systems Therefore, the total energy to be
produced by the photovoltaic panels should be more than 6MW. The electricity produced by
a system relies on the system type, its orientation and the solar resource that is accessible.
The solar resource is the quantity of the sun's power that differs across the United Arab
Emirates to the Earth's surface. More sun energy reaches the surface by a greater solar power
which is ideal for the efficiency of the PV system.
9
[Date]
Sharjah Airport hybrid energy system
2.2 Implementation of Hybrid Energy System
The airport consumes an average load totaling to 9MW for a single day, which relates to
375kw/h minimum, and 1286kw/h at peak hours. This information has been received from the
site personnel.
The proposed plan is to distribute the total load to the two hybrid systems as mentioned above.
These includes,
1. Photovoltaic panels fitted on the warehouse rooftops
2. Waste to energy implementation
Figure 2 Basic component of hybrid systems (Upadhyay and Sharma, 2014)
2.2.1 Implementation of Solar PV
It is expected that solar photovoltaics ratio to that of waste to energy be 6:3. The decision is
based on the fact that the Airports maximum wastes that can be collected per day is 10
tonnes, hence double proportion for photovoltaic systems Therefore, the total energy to be
produced by the photovoltaic panels should be more than 6MW. The electricity produced by
a system relies on the system type, its orientation and the solar resource that is accessible.
The solar resource is the quantity of the sun's power that differs across the United Arab
Emirates to the Earth's surface. More sun energy reaches the surface by a greater solar power
which is ideal for the efficiency of the PV system.
9
⊘ This is a preview!⊘
Do you want full access?
Subscribe today to unlock all pages.
Trusted by 1+ million students worldwide
[Author name]
[Date]
Sharjah Airport hybrid energy system
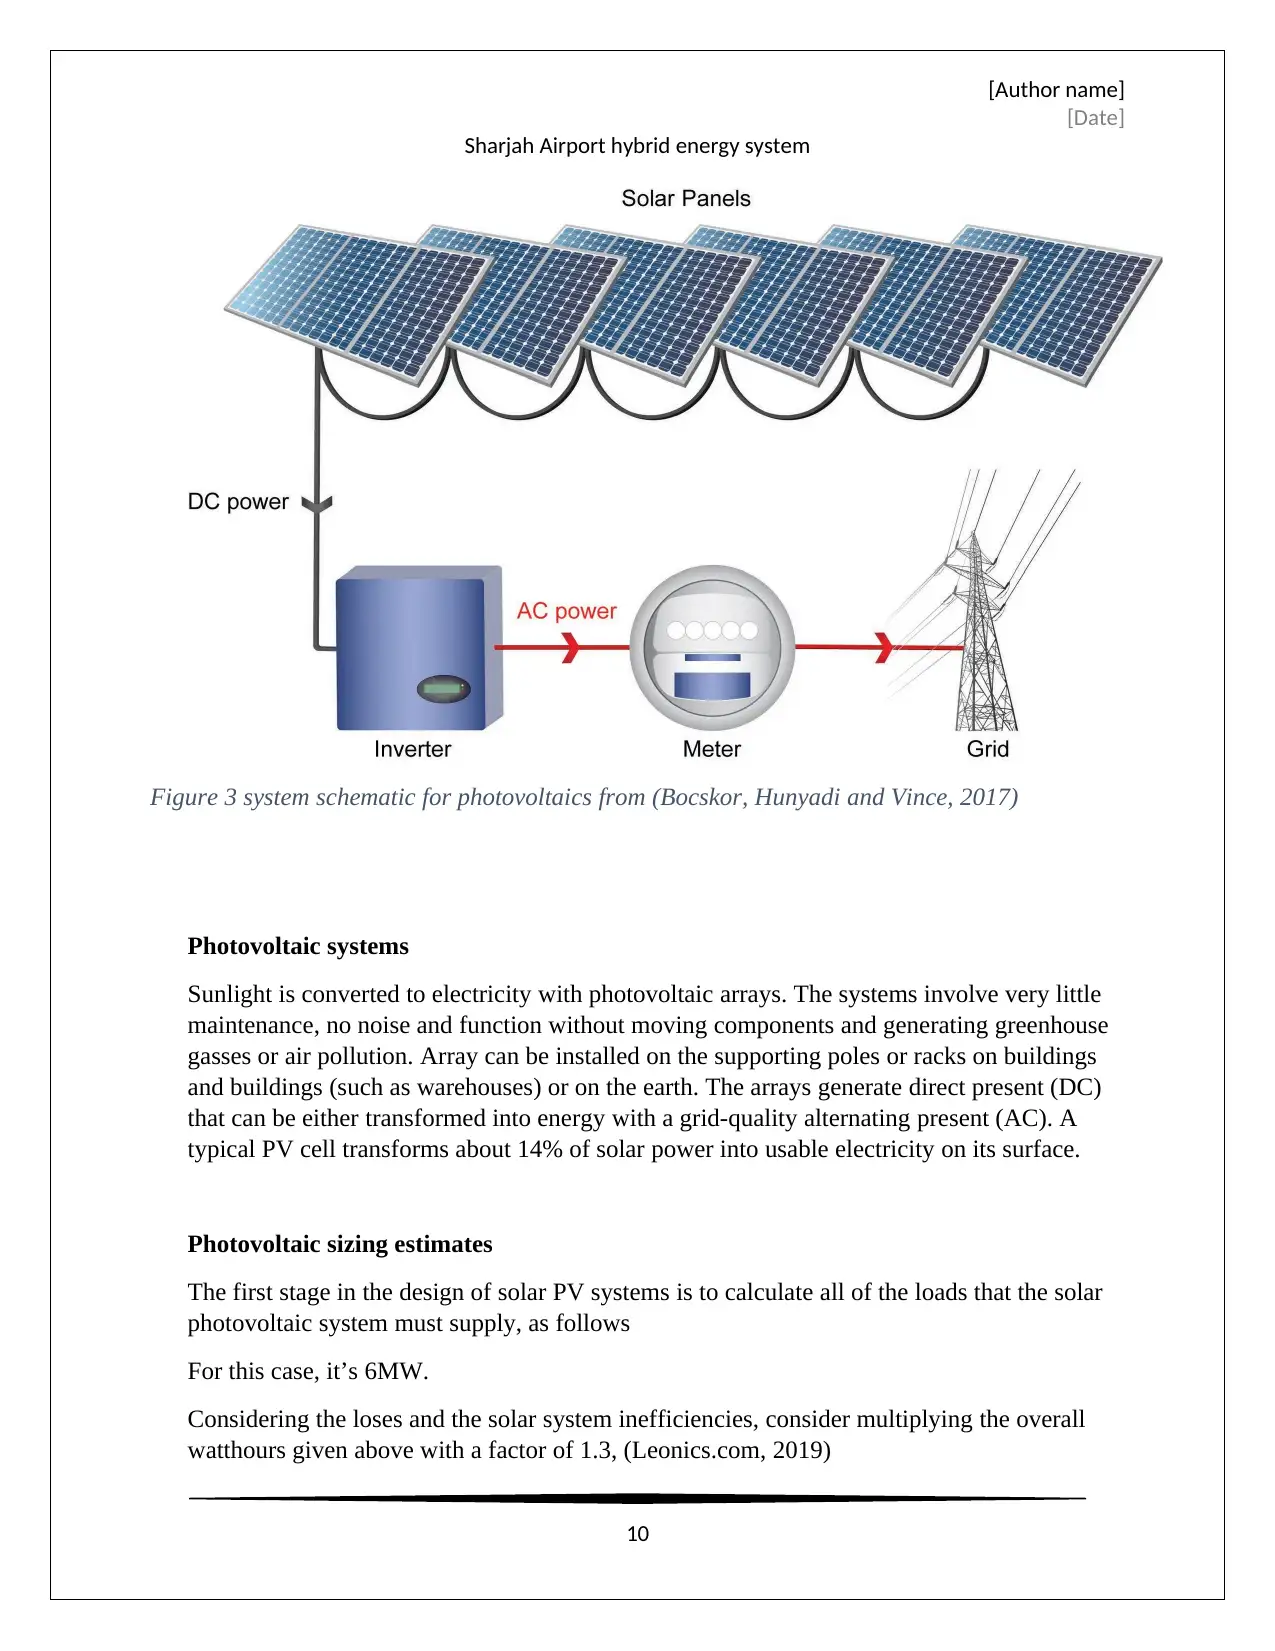
Figure 3 system schematic for photovoltaics from (Bocskor, Hunyadi and Vince, 2017)
Photovoltaic systems
Sunlight is converted to electricity with photovoltaic arrays. The systems involve very little
maintenance, no noise and function without moving components and generating greenhouse
gasses or air pollution. Array can be installed on the supporting poles or racks on buildings
and buildings (such as warehouses) or on the earth. The arrays generate direct present (DC)
that can be either transformed into energy with a grid-quality alternating present (AC). A
typical PV cell transforms about 14% of solar power into usable electricity on its surface.
Photovoltaic sizing estimates
The first stage in the design of solar PV systems is to calculate all of the loads that the solar
photovoltaic system must supply, as follows
For this case, it’s 6MW.
Considering the loses and the solar system inefficiencies, consider multiplying the overall
watthours given above with a factor of 1.3, (Leonics.com, 2019)
10
[Date]
Sharjah Airport hybrid energy system
Figure 3 system schematic for photovoltaics from (Bocskor, Hunyadi and Vince, 2017)
Photovoltaic systems
Sunlight is converted to electricity with photovoltaic arrays. The systems involve very little
maintenance, no noise and function without moving components and generating greenhouse
gasses or air pollution. Array can be installed on the supporting poles or racks on buildings
and buildings (such as warehouses) or on the earth. The arrays generate direct present (DC)
that can be either transformed into energy with a grid-quality alternating present (AC). A
typical PV cell transforms about 14% of solar power into usable electricity on its surface.
Photovoltaic sizing estimates
The first stage in the design of solar PV systems is to calculate all of the loads that the solar
photovoltaic system must supply, as follows
For this case, it’s 6MW.
Considering the loses and the solar system inefficiencies, consider multiplying the overall
watthours given above with a factor of 1.3, (Leonics.com, 2019)
10
Paraphrase This Document
Need a fresh take? Get an instant paraphrase of this document with our AI Paraphraser
[Author name]
[Date]
Sharjah Airport hybrid energy system
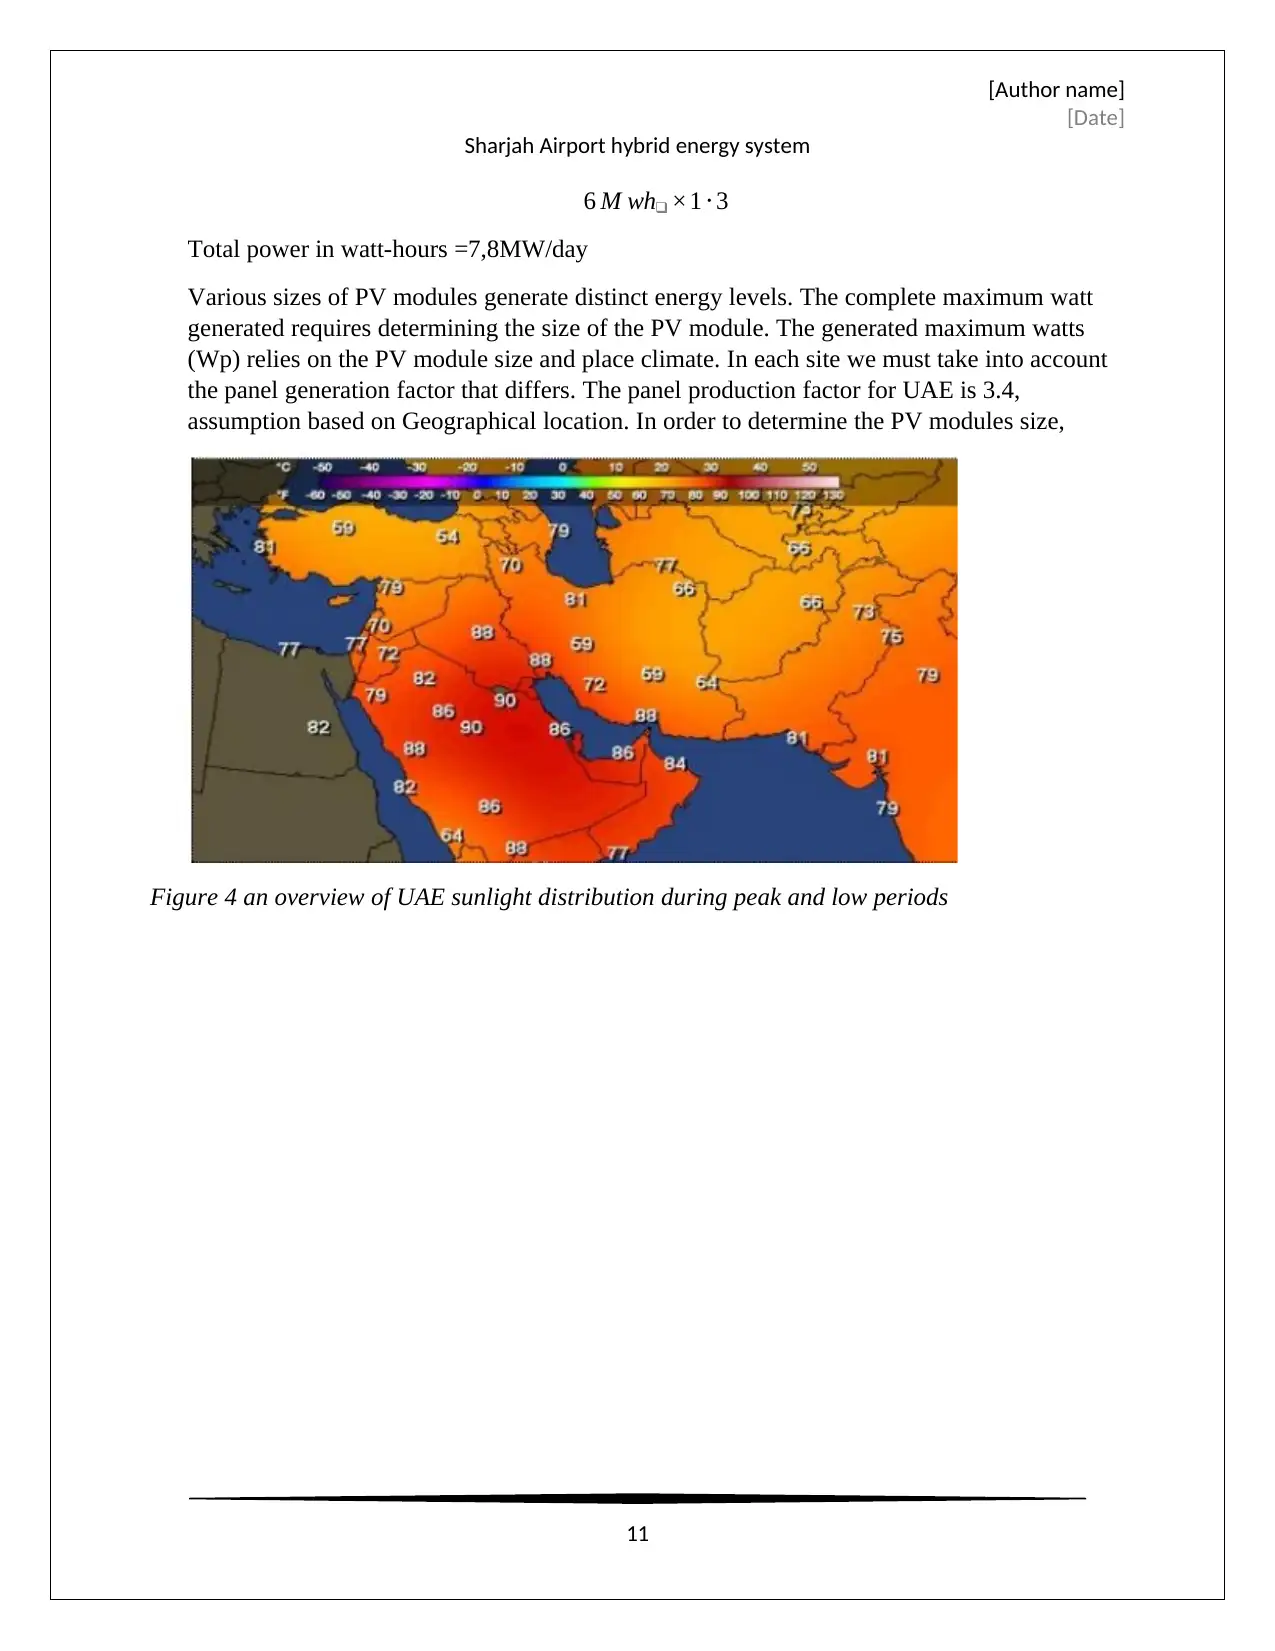
6 M wh❑ ×1 ⋅3
Total power in watt-hours =7,8MW/day
Various sizes of PV modules generate distinct energy levels. The complete maximum watt
generated requires determining the size of the PV module. The generated maximum watts
(Wp) relies on the PV module size and place climate. In each site we must take into account
the panel generation factor that differs. The panel production factor for UAE is 3.4,
assumption based on Geographical location. In order to determine the PV modules size,
Figure 4 an overview of UAE sunlight distribution during peak and low periods
11
[Date]
Sharjah Airport hybrid energy system
6 M wh❑ ×1 ⋅3
Total power in watt-hours =7,8MW/day
Various sizes of PV modules generate distinct energy levels. The complete maximum watt
generated requires determining the size of the PV module. The generated maximum watts
(Wp) relies on the PV module size and place climate. In each site we must take into account
the panel generation factor that differs. The panel production factor for UAE is 3.4,
assumption based on Geographical location. In order to determine the PV modules size,
Figure 4 an overview of UAE sunlight distribution during peak and low periods
11
[Author name]
[Date]
Sharjah Airport hybrid energy system
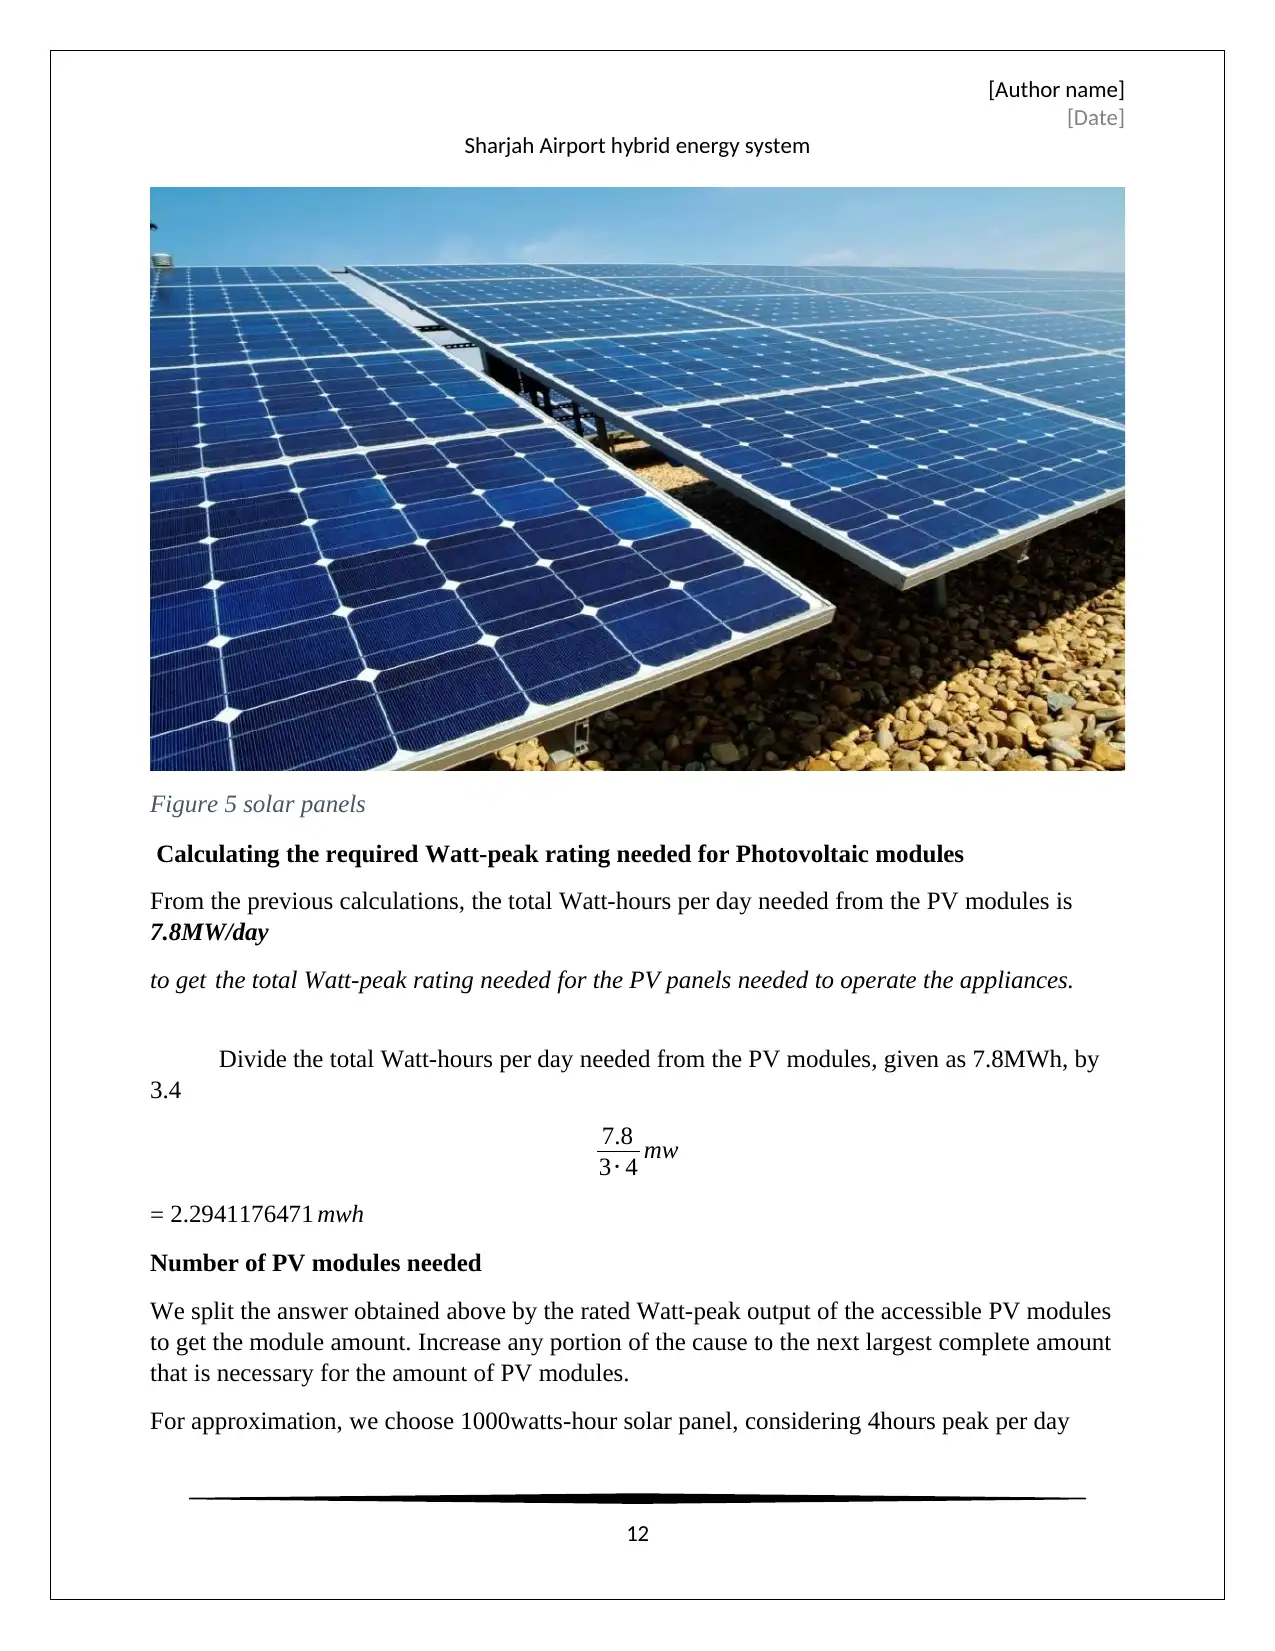
Figure 5 solar panels
Calculating the required Watt-peak rating needed for Photovoltaic modules
From the previous calculations, the total Watt-hours per day needed from the PV modules is
7.8MW/day
to get the total Watt-peak rating needed for the PV panels needed to operate the appliances.
Divide the total Watt-hours per day needed from the PV modules, given as 7.8MWh, by
3.4
7.8
3⋅ 4 mw
= 2.2941176471 mwh
Number of PV modules needed
We split the answer obtained above by the rated Watt-peak output of the accessible PV modules
to get the module amount. Increase any portion of the cause to the next largest complete amount
that is necessary for the amount of PV modules.
For approximation, we choose 1000watts-hour solar panel, considering 4hours peak per day
12
[Date]
Sharjah Airport hybrid energy system
Figure 5 solar panels
Calculating the required Watt-peak rating needed for Photovoltaic modules
From the previous calculations, the total Watt-hours per day needed from the PV modules is
7.8MW/day
to get the total Watt-peak rating needed for the PV panels needed to operate the appliances.
Divide the total Watt-hours per day needed from the PV modules, given as 7.8MWh, by
3.4
7.8
3⋅ 4 mw
= 2.2941176471 mwh
Number of PV modules needed
We split the answer obtained above by the rated Watt-peak output of the accessible PV modules
to get the module amount. Increase any portion of the cause to the next largest complete amount
that is necessary for the amount of PV modules.
For approximation, we choose 1000watts-hour solar panel, considering 4hours peak per day
12
⊘ This is a preview!⊘
Do you want full access?
Subscribe today to unlock all pages.
Trusted by 1+ million students worldwide
1 out of 47
Related Documents


Your All-in-One AI-Powered Toolkit for Academic Success.
+13062052269
info@desklib.com
Available 24*7 on WhatsApp / Email
![[object Object]](/_next/static/media/star-bottom.7253800d.svg)
Unlock your academic potential
Copyright © 2020–2025 A2Z Services. All Rights Reserved. Developed and managed by ZUCOL.