Alex Sharpe's Portfolio: Risk, Return and Investment Strategies
VerifiedAdded on 2022/10/07
|10
|2437
|453
Project
AI Summary
This assignment analyzes Alex Sharpe's investment portfolio, exploring risk and return in the context of market investments and individual stocks. It examines the impact of shifting from a passive to an active investing strategy, considering the addition of individual company stocks. The analysis includes calculations of returns, standard deviations, and correlations for various stocks and the S&P ASX 200 index. The assignment then constructs and evaluates different portfolio combinations, calculating returns, standard deviations, and Sharpe ratios to determine the optimal portfolio for Alex. Regression analysis is performed to estimate alpha and beta for each stock, providing insights into their systematic risk. Finally, the assignment discusses the benefits and issues associated with investing in Exchange Traded Funds (ETFs) as part of an active investment strategy, comparing them to mutual funds and their suitability for long-term wealth creation.
Question 1:
Alex is invested in the index fund based on S&P 500 that represents a market portfolio. The
risk and return in the context of Alex Sharpe’s investment activities is defined in terms of
market risk and return i.e. risk and return of investing in a broad equity market. The risk is
the potential of loss due to the overall volatility of the market that is the systematic risk as all
the unsystematic risk due to a particular security is eliminated due to the diversification
benefits. The return is the potential gain earned by undertaking this market risk.
The risk in this regard is measured in terms of the standard deviation of the market returns.
The return is measured by adding risk free rate to the market risk premium that is premium of
taking market risk. To measure the return, the amount invested is multiplied by this market
return. The actual return to Alex will be this return minus any administration/management
fees.
After shifting from the passive investing strategy to an active investing strategy the risk
return characteristics of his investment portfolio will change. She is thinking of adding stocks
of individual companies to her equity portfolio. The risk of the new portfolio will now
depend upon the correlation between the return of the new stock and index return. The return
of new portfolio will depend upon the market return and new stock’s return.
Risk = Square-root of (W(m)^2 * Std dev(m)^2 + W(i)^2 * Std dev(i)^2 + 2* W(m) * W(i)
* Correlation i,m)
Return = W(m) * Market-Return + W(i) * Stock-Return
Where,
W(m), W(i): Proportion of total portfolio invested in market-index and new stock
respectively.
Std dev(m), Std dev(i): Standard deviation of market-return and stock’s return respectively.
Correlation i,m: Correlation between new stock’s return and market return.
Paraphrase This Document
Need a fresh take? Get an instant paraphrase of this document with our AI Paraphraser
Question 2:
DOWNER
EDI - TOT
RETURN IND
QANTAS
AIRWAYS - TOT
RETURN IND
WOOLWORTHS
GROUP - TOT
RETURN IND
S&P/ASX 200
- TOT
RETURN IND
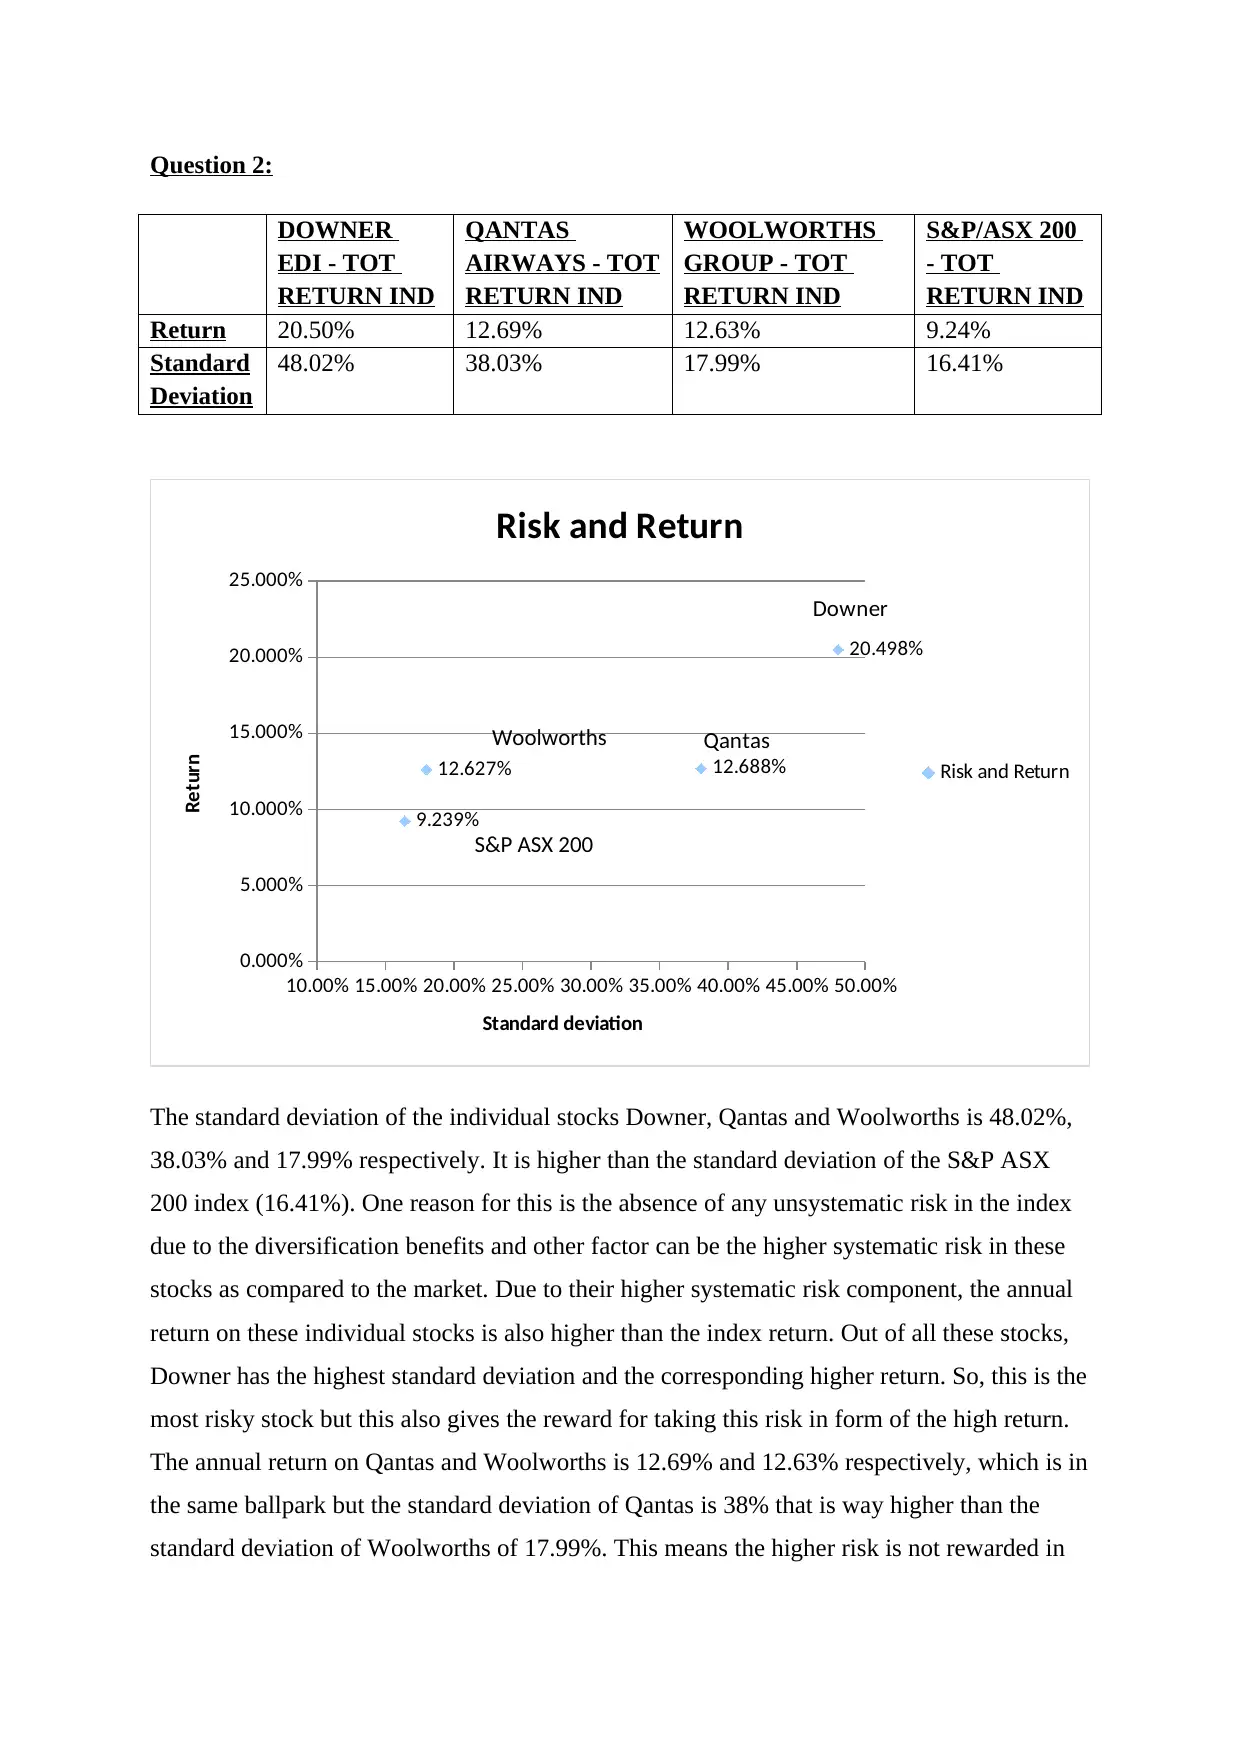
Return 20.50% 12.69% 12.63% 9.24%
Standard
Deviation
48.02% 38.03% 17.99% 16.41%
10.00% 15.00% 20.00% 25.00% 30.00% 35.00% 40.00% 45.00% 50.00%
0.000%
5.000%
10.000%
15.000%
20.000%
25.000%
20.498%
12.688%12.627%
9.239%
Risk and Return
Risk and Return
Standard deviation
Return Qantas
Downer
The standard deviation of the individual stocks Downer, Qantas and Woolworths is 48.02%,
38.03% and 17.99% respectively. It is higher than the standard deviation of the S&P ASX
200 index (16.41%). One reason for this is the absence of any unsystematic risk in the index
due to the diversification benefits and other factor can be the higher systematic risk in these
stocks as compared to the market. Due to their higher systematic risk component, the annual
return on these individual stocks is also higher than the index return. Out of all these stocks,
Downer has the highest standard deviation and the corresponding higher return. So, this is the
most risky stock but this also gives the reward for taking this risk in form of the high return.
The annual return on Qantas and Woolworths is 12.69% and 12.63% respectively, which is in
the same ballpark but the standard deviation of Qantas is 38% that is way higher than the
standard deviation of Woolworths of 17.99%. This means the higher risk is not rewarded in
Woolworths
S&P ASX 200
DOWNER
EDI - TOT
RETURN IND
QANTAS
AIRWAYS - TOT
RETURN IND
WOOLWORTHS
GROUP - TOT
RETURN IND
S&P/ASX 200
- TOT
RETURN IND
Return 20.50% 12.69% 12.63% 9.24%
Standard
Deviation
48.02% 38.03% 17.99% 16.41%
10.00% 15.00% 20.00% 25.00% 30.00% 35.00% 40.00% 45.00% 50.00%
0.000%
5.000%
10.000%
15.000%
20.000%
25.000%
20.498%
12.688%12.627%
9.239%
Risk and Return
Risk and Return
Standard deviation
Return Qantas
Downer
The standard deviation of the individual stocks Downer, Qantas and Woolworths is 48.02%,
38.03% and 17.99% respectively. It is higher than the standard deviation of the S&P ASX
200 index (16.41%). One reason for this is the absence of any unsystematic risk in the index
due to the diversification benefits and other factor can be the higher systematic risk in these
stocks as compared to the market. Due to their higher systematic risk component, the annual
return on these individual stocks is also higher than the index return. Out of all these stocks,
Downer has the highest standard deviation and the corresponding higher return. So, this is the
most risky stock but this also gives the reward for taking this risk in form of the high return.
The annual return on Qantas and Woolworths is 12.69% and 12.63% respectively, which is in
the same ballpark but the standard deviation of Qantas is 38% that is way higher than the
standard deviation of Woolworths of 17.99%. This means the higher risk is not rewarded in
Woolworths
S&P ASX 200
the case of Qantas shares as this risk might be due to some stock-specific issues that could be
avoided by diversification.
avoided by diversification.
⊘ This is a preview!⊘
Do you want full access?
Subscribe today to unlock all pages.
Trusted by 1+ million students worldwide
Question 3:
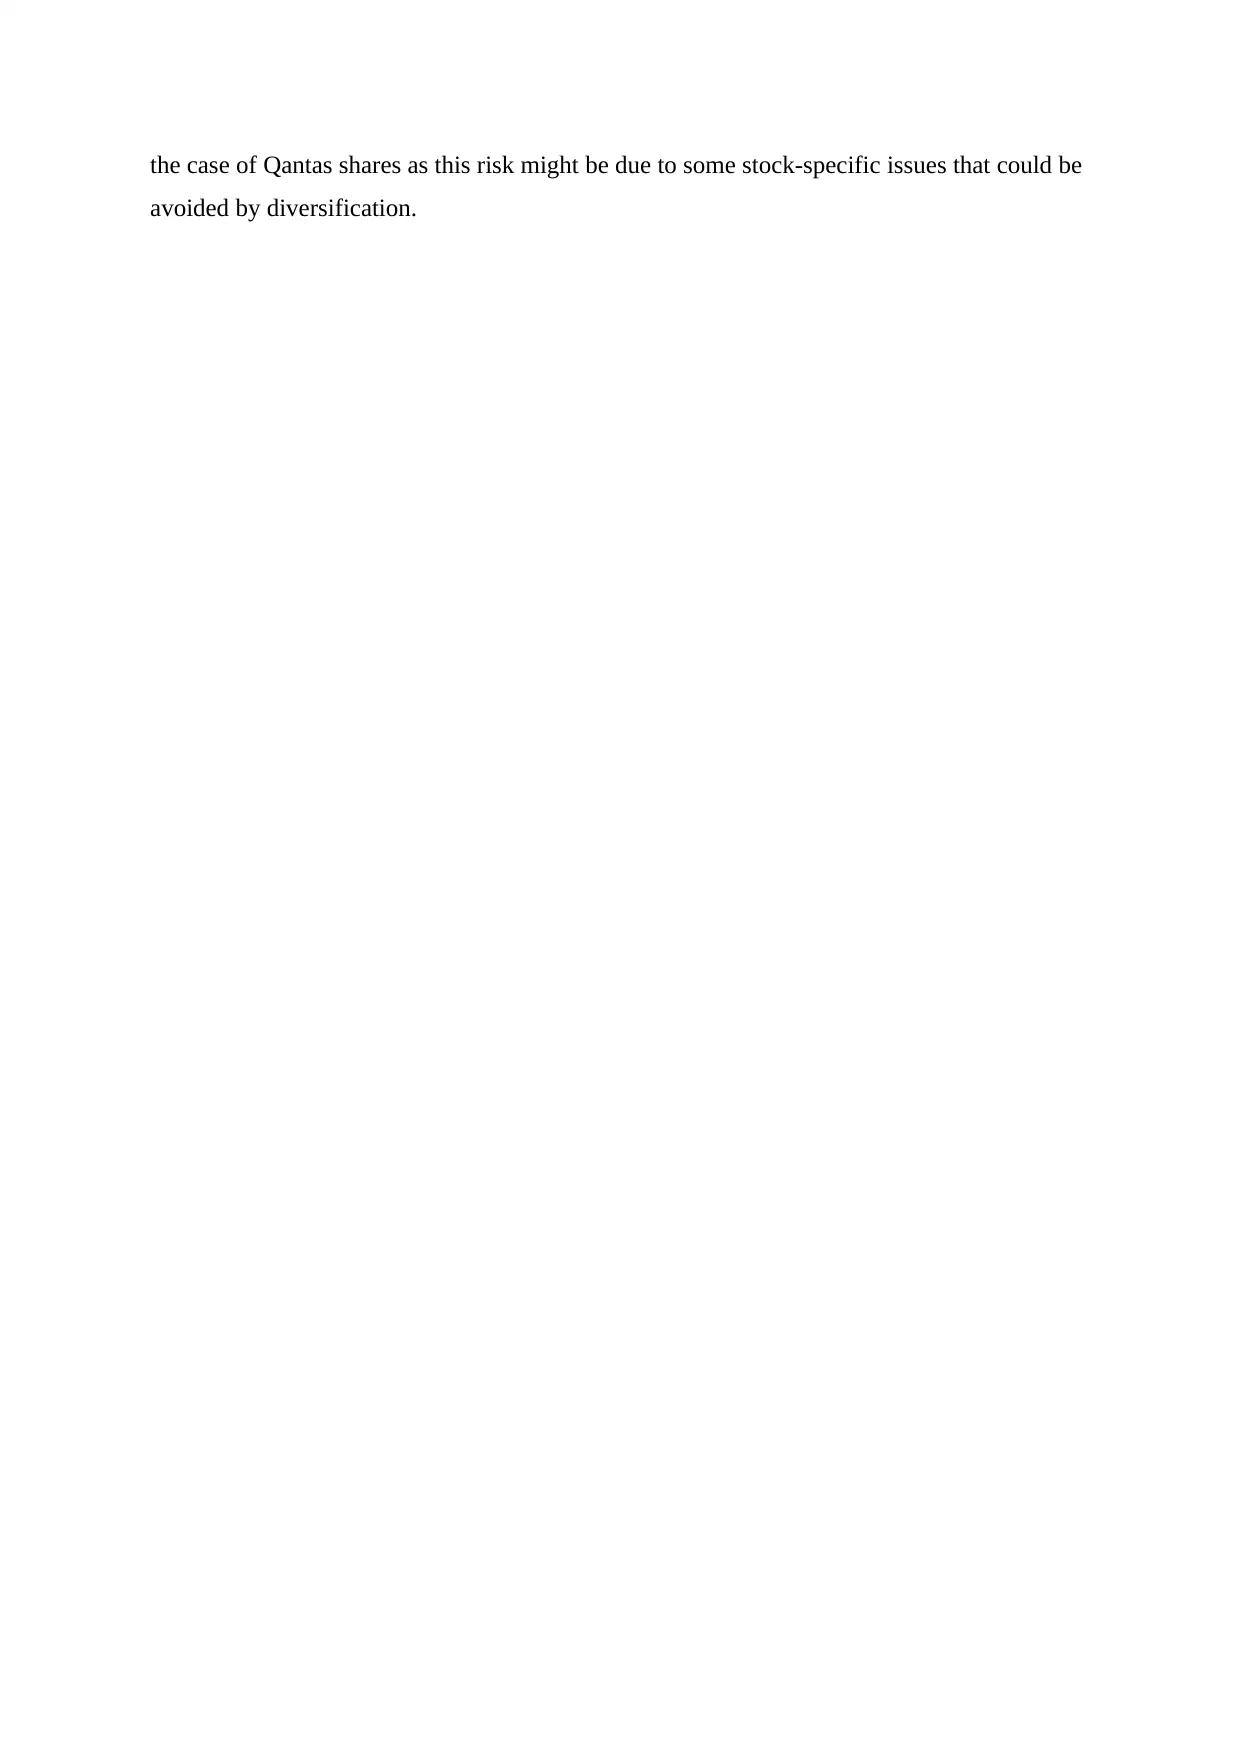
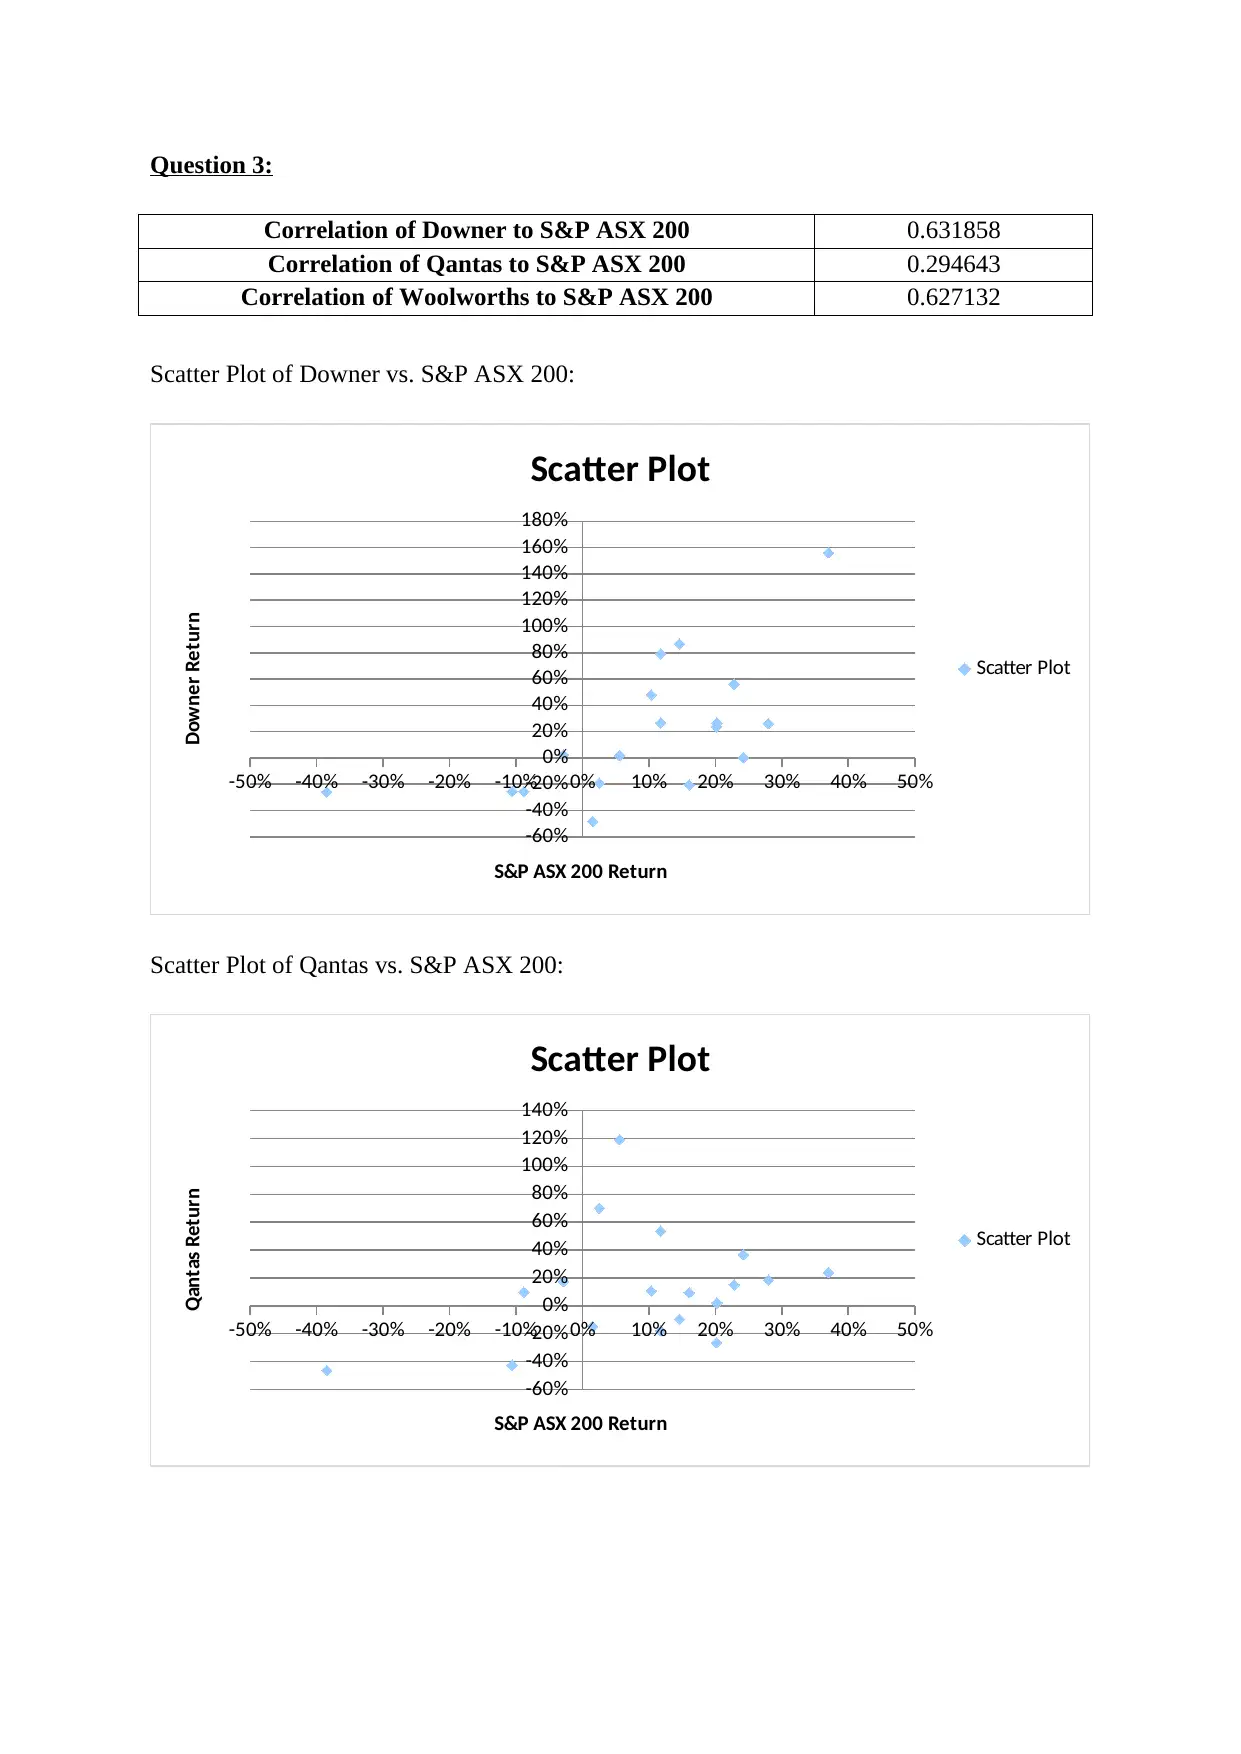
Correlation of Downer to S&P ASX 200 0.631858
Correlation of Qantas to S&P ASX 200 0.294643
Correlation of Woolworths to S&P ASX 200 0.627132
Scatter Plot of Downer vs. S&P ASX 200:
-50% -40% -30% -20% -10% 0% 10% 20% 30% 40% 50%
-60%
-40%
-20%
0%
20%
40%
60%
80%
100%
120%
140%
160%
180%
Scatter Plot
Scatter Plot
S&P ASX 200 Return
Downer Return
Scatter Plot of Qantas vs. S&P ASX 200:
-50% -40% -30% -20% -10% 0% 10% 20% 30% 40% 50%
-60%
-40%
-20%
0%
20%
40%
60%
80%
100%
120%
140%
Scatter Plot
Scatter Plot
S&P ASX 200 Return
Qantas Return
Paraphrase This Document
Need a fresh take? Get an instant paraphrase of this document with our AI Paraphraser
Scatter Plot of Qantas vs. S&P ASX 200:
-50% -40% -30% -20% -10% 0% 10% 20% 30% 40% 50%
-30%
-20%
-10%
0%
10%
20%
30%
40%
50%
Scatter Plot
Scatter Plot
S&P ASX 200 Return
Woolworths Return
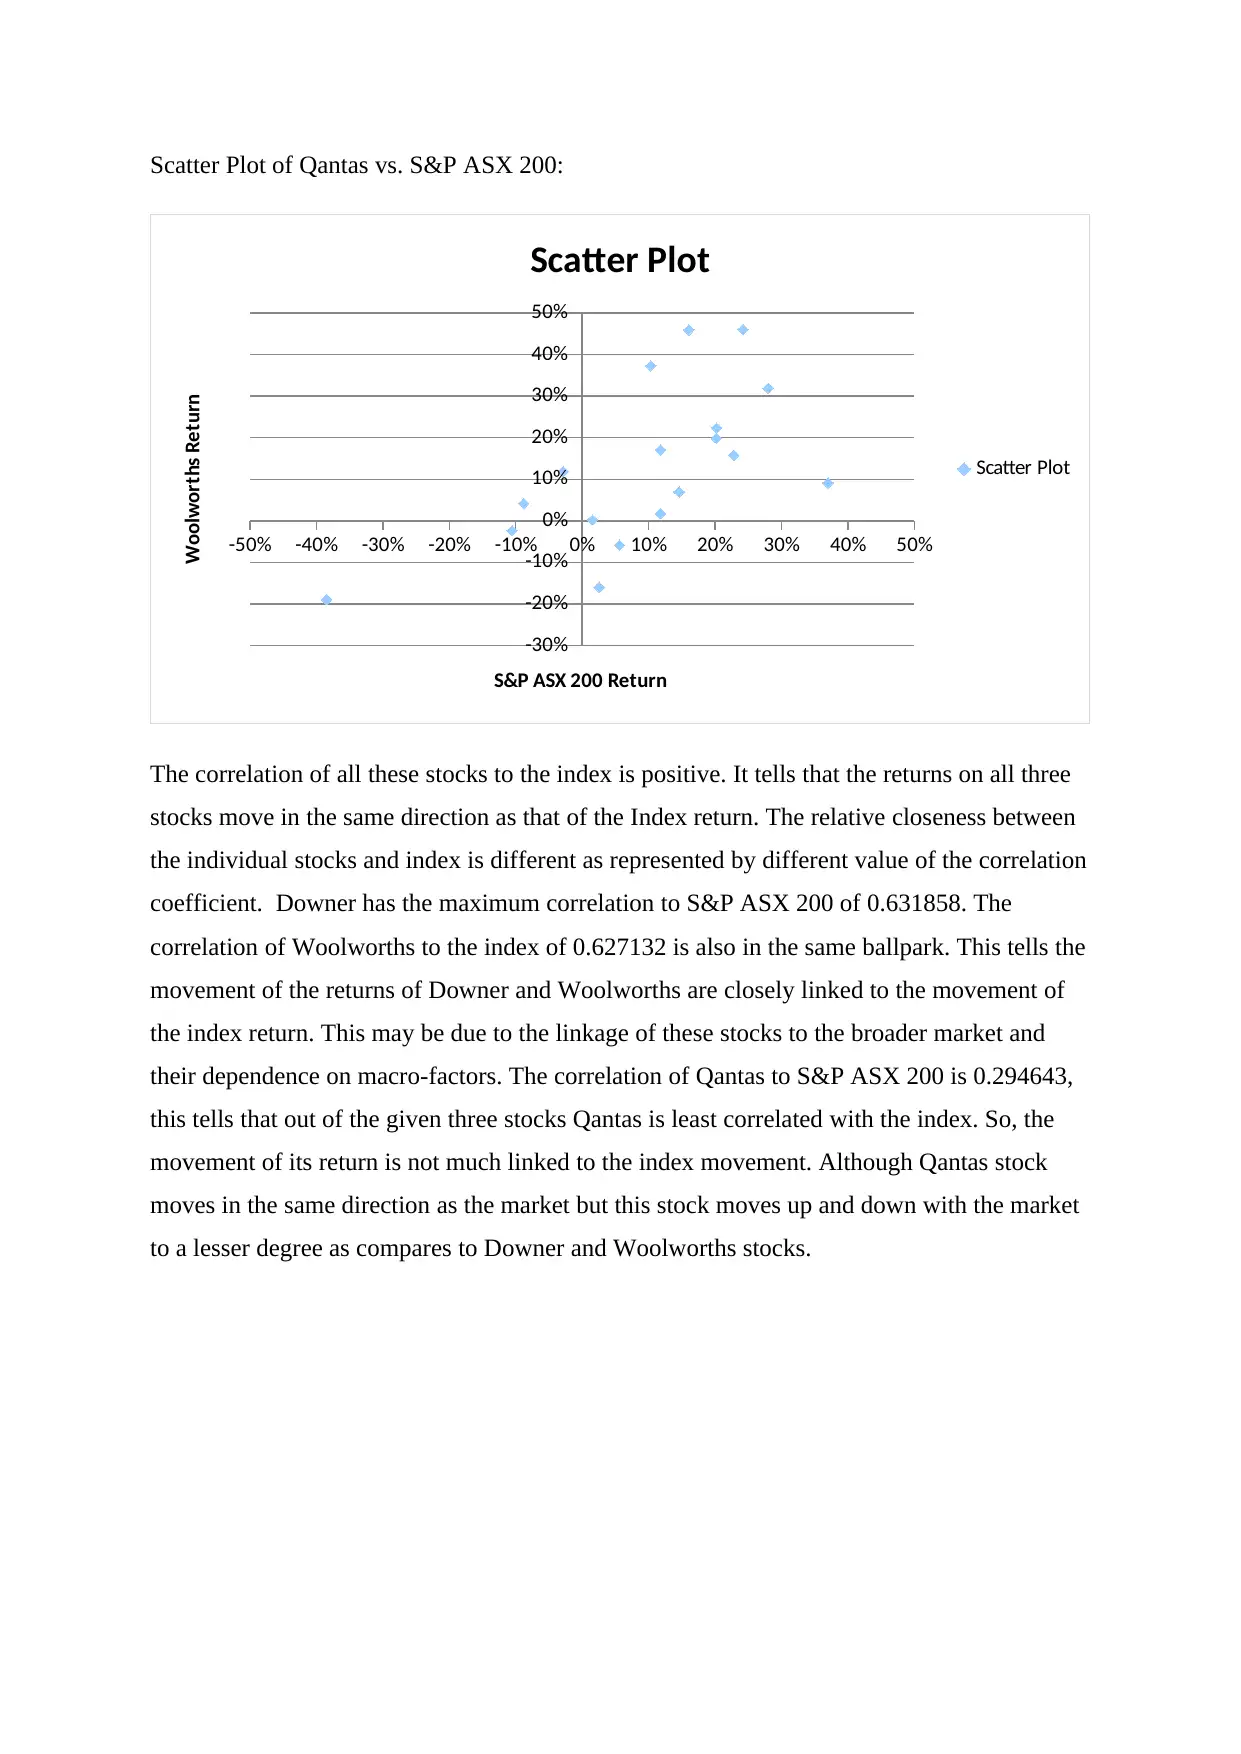
The correlation of all these stocks to the index is positive. It tells that the returns on all three
stocks move in the same direction as that of the Index return. The relative closeness between
the individual stocks and index is different as represented by different value of the correlation
coefficient. Downer has the maximum correlation to S&P ASX 200 of 0.631858. The
correlation of Woolworths to the index of 0.627132 is also in the same ballpark. This tells the
movement of the returns of Downer and Woolworths are closely linked to the movement of
the index return. This may be due to the linkage of these stocks to the broader market and
their dependence on macro-factors. The correlation of Qantas to S&P ASX 200 is 0.294643,
this tells that out of the given three stocks Qantas is least correlated with the index. So, the
movement of its return is not much linked to the index movement. Although Qantas stock
moves in the same direction as the market but this stock moves up and down with the market
to a lesser degree as compares to Downer and Woolworths stocks.
-50% -40% -30% -20% -10% 0% 10% 20% 30% 40% 50%
-30%
-20%
-10%
0%
10%
20%
30%
40%
50%
Scatter Plot
Scatter Plot
S&P ASX 200 Return
Woolworths Return
The correlation of all these stocks to the index is positive. It tells that the returns on all three
stocks move in the same direction as that of the Index return. The relative closeness between
the individual stocks and index is different as represented by different value of the correlation
coefficient. Downer has the maximum correlation to S&P ASX 200 of 0.631858. The
correlation of Woolworths to the index of 0.627132 is also in the same ballpark. This tells the
movement of the returns of Downer and Woolworths are closely linked to the movement of
the index return. This may be due to the linkage of these stocks to the broader market and
their dependence on macro-factors. The correlation of Qantas to S&P ASX 200 is 0.294643,
this tells that out of the given three stocks Qantas is least correlated with the index. So, the
movement of its return is not much linked to the index movement. Although Qantas stock
moves in the same direction as the market but this stock moves up and down with the market
to a lesser degree as compares to Downer and Woolworths stocks.
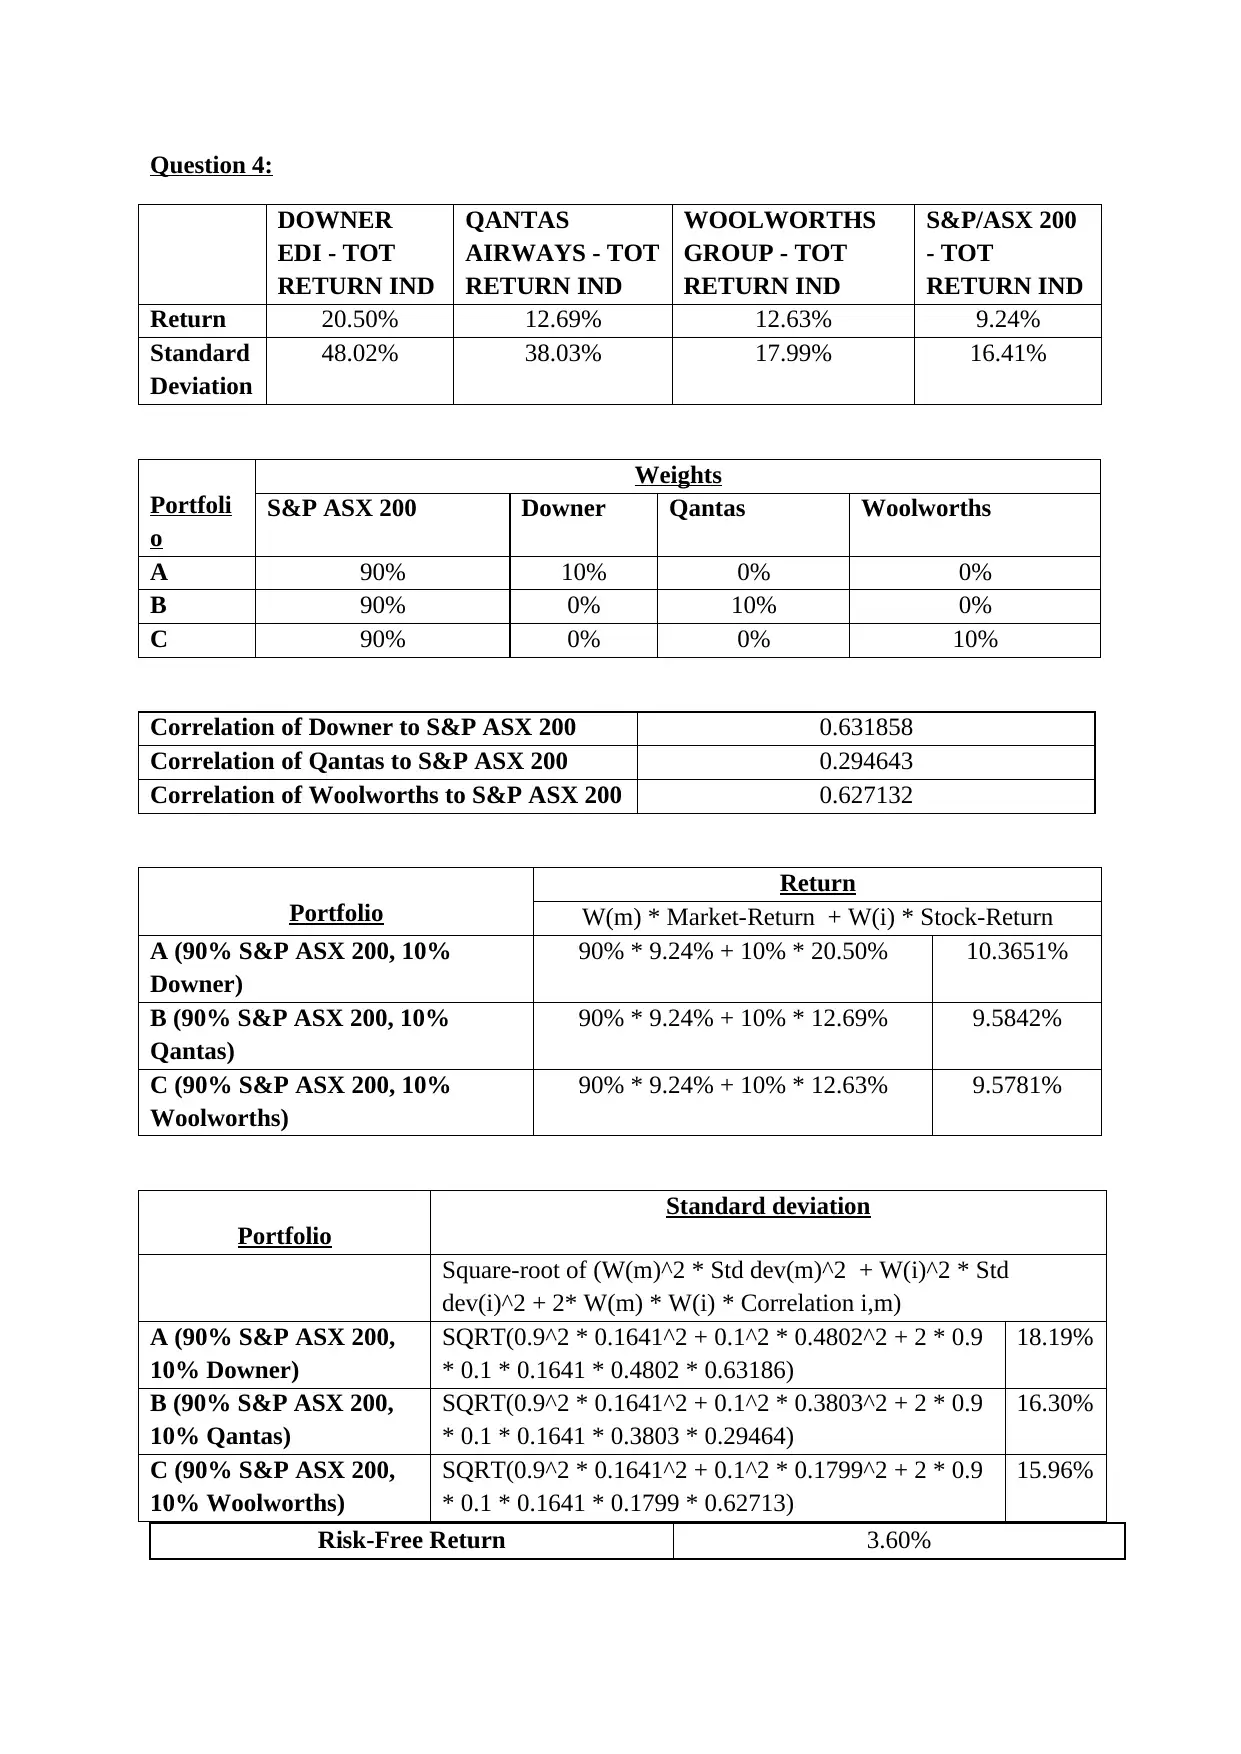
Question 4:
DOWNER
EDI - TOT
RETURN IND
QANTAS
AIRWAYS - TOT
RETURN IND
WOOLWORTHS
GROUP - TOT
RETURN IND
S&P/ASX 200
- TOT
RETURN IND
Return 20.50% 12.69% 12.63% 9.24%
Standard
Deviation
48.02% 38.03% 17.99% 16.41%
Portfoli
o
Weights
S&P ASX 200 Downer Qantas Woolworths
A 90% 10% 0% 0%
B 90% 0% 10% 0%
C 90% 0% 0% 10%
Correlation of Downer to S&P ASX 200 0.631858
Correlation of Qantas to S&P ASX 200 0.294643
Correlation of Woolworths to S&P ASX 200 0.627132
Portfolio
Return
W(m) * Market-Return + W(i) * Stock-Return
A (90% S&P ASX 200, 10%
Downer)
90% * 9.24% + 10% * 20.50% 10.3651%
B (90% S&P ASX 200, 10%
Qantas)
90% * 9.24% + 10% * 12.69% 9.5842%
C (90% S&P ASX 200, 10%
Woolworths)
90% * 9.24% + 10% * 12.63% 9.5781%
Portfolio
Standard deviation
Square-root of (W(m)^2 * Std dev(m)^2 + W(i)^2 * Std
dev(i)^2 + 2* W(m) * W(i) * Correlation i,m)
A (90% S&P ASX 200,
10% Downer)
SQRT(0.9^2 * 0.1641^2 + 0.1^2 * 0.4802^2 + 2 * 0.9
* 0.1 * 0.1641 * 0.4802 * 0.63186)
18.19%
B (90% S&P ASX 200,
10% Qantas)
SQRT(0.9^2 * 0.1641^2 + 0.1^2 * 0.3803^2 + 2 * 0.9
* 0.1 * 0.1641 * 0.3803 * 0.29464)
16.30%
C (90% S&P ASX 200,
10% Woolworths)
SQRT(0.9^2 * 0.1641^2 + 0.1^2 * 0.1799^2 + 2 * 0.9
* 0.1 * 0.1641 * 0.1799 * 0.62713)
15.96%
Risk-Free Return 3.60%
⊘ This is a preview!⊘
Do you want full access?
Subscribe today to unlock all pages.
Trusted by 1+ million students worldwide
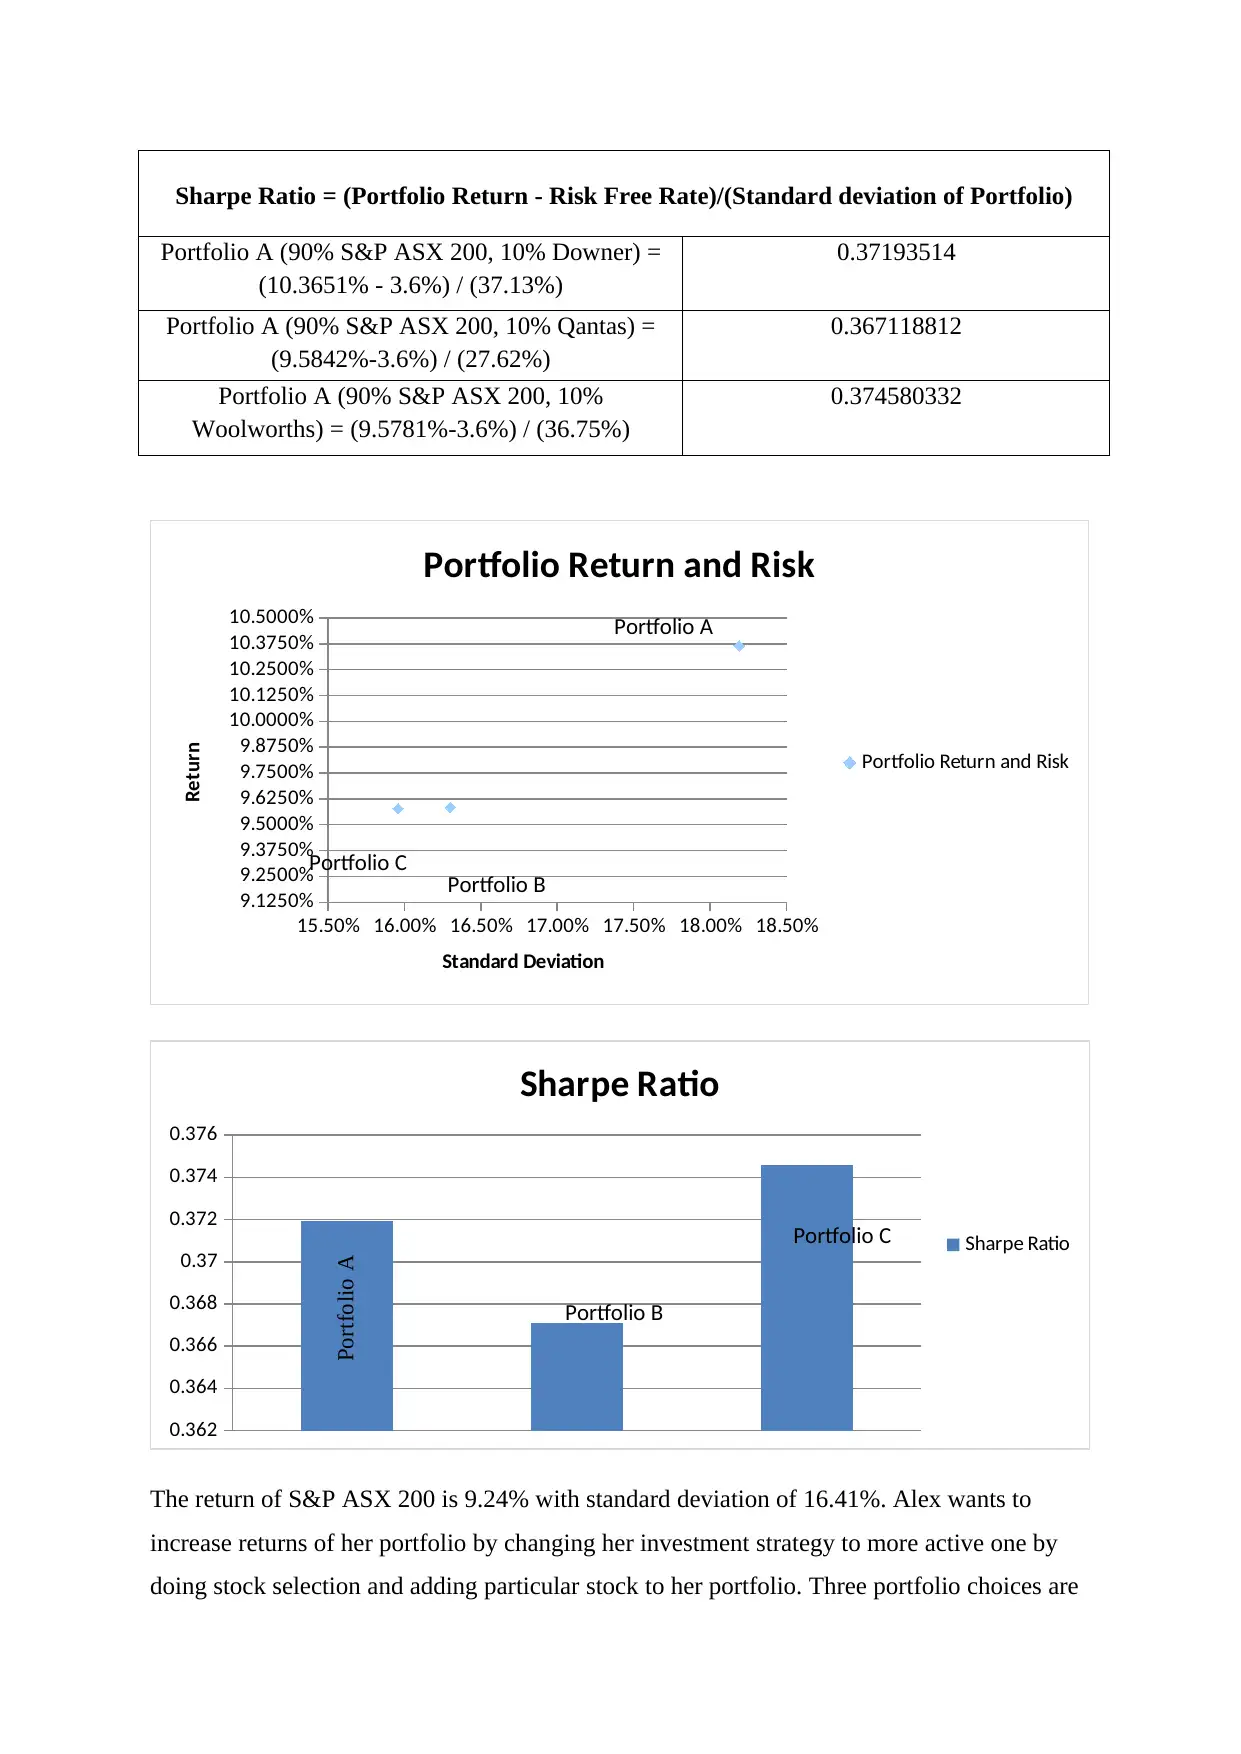
Sharpe Ratio = (Portfolio Return - Risk Free Rate)/(Standard deviation of Portfolio)
Portfolio A (90% S&P ASX 200, 10% Downer) =
(10.3651% - 3.6%) / (37.13%)
0.37193514
Portfolio A (90% S&P ASX 200, 10% Qantas) =
(9.5842%-3.6%) / (27.62%)
0.367118812
Portfolio A (90% S&P ASX 200, 10%
Woolworths) = (9.5781%-3.6%) / (36.75%)
0.374580332
15.50% 16.00% 16.50% 17.00% 17.50% 18.00% 18.50%
9.1250%
9.2500%
9.3750%
9.5000%
9.6250%
9.7500%
9.8750%
10.0000%
10.1250%
10.2500%
10.3750%
10.5000%
Portfolio Return and Risk
Portfolio Return and Risk
Standard Deviation
Return
0.362
0.364
0.366
0.368
0.37
0.372
0.374
0.376
Sharpe Ratio
Sharpe Ratio
Portfolio A
The return of S&P ASX 200 is 9.24% with standard deviation of 16.41%. Alex wants to
increase returns of her portfolio by changing her investment strategy to more active one by
doing stock selection and adding particular stock to her portfolio. Three portfolio choices are
Portfolio B
Portfolio C
Portfolio B
Portfolio A
Portfolio C
Paraphrase This Document
Need a fresh take? Get an instant paraphrase of this document with our AI Paraphraser
portfolio A with 90% S&P ASX 200, 10% Downer, portfolio B with 90% S&P ASX 200,
10% Qantas and portfolio C with 90% S&P ASX 200, 10% Woolworths. Portfolio A will
give return of 10.3651% with standard deviation of 18.19%, Portfolio B will give return of
9.5842% with standard deviation of 16.30% and Portfolio C will give return of 9.5781% with
standard deviation of 15.96%. Portfolio A will give the maximum return as Downer stock
combined to S&P ASX 200 in this portfolio is a risky stock and it gives higher return. This
higher risk and its high correlation with index increases the overall risk of the portfolio too
much. Alex not only wants higher return of new portfolio but she also wants this portfolio to
provide sufficient compensation for any additional risk taken. So, the portfolio with
maximum Sharpe Ratio would be best for her as that portfolio will provide maximum return
in excess of the risk free rate per unit of the overall risk taken. Portfolio C (90% S&P ASX
200, 10% Woolworths) with maximum Sharpe Ratio of 0.374580332 would be best for her
out of these three portfolio choices.
Question 5:
Regressing Downer on S&P ASX 200:
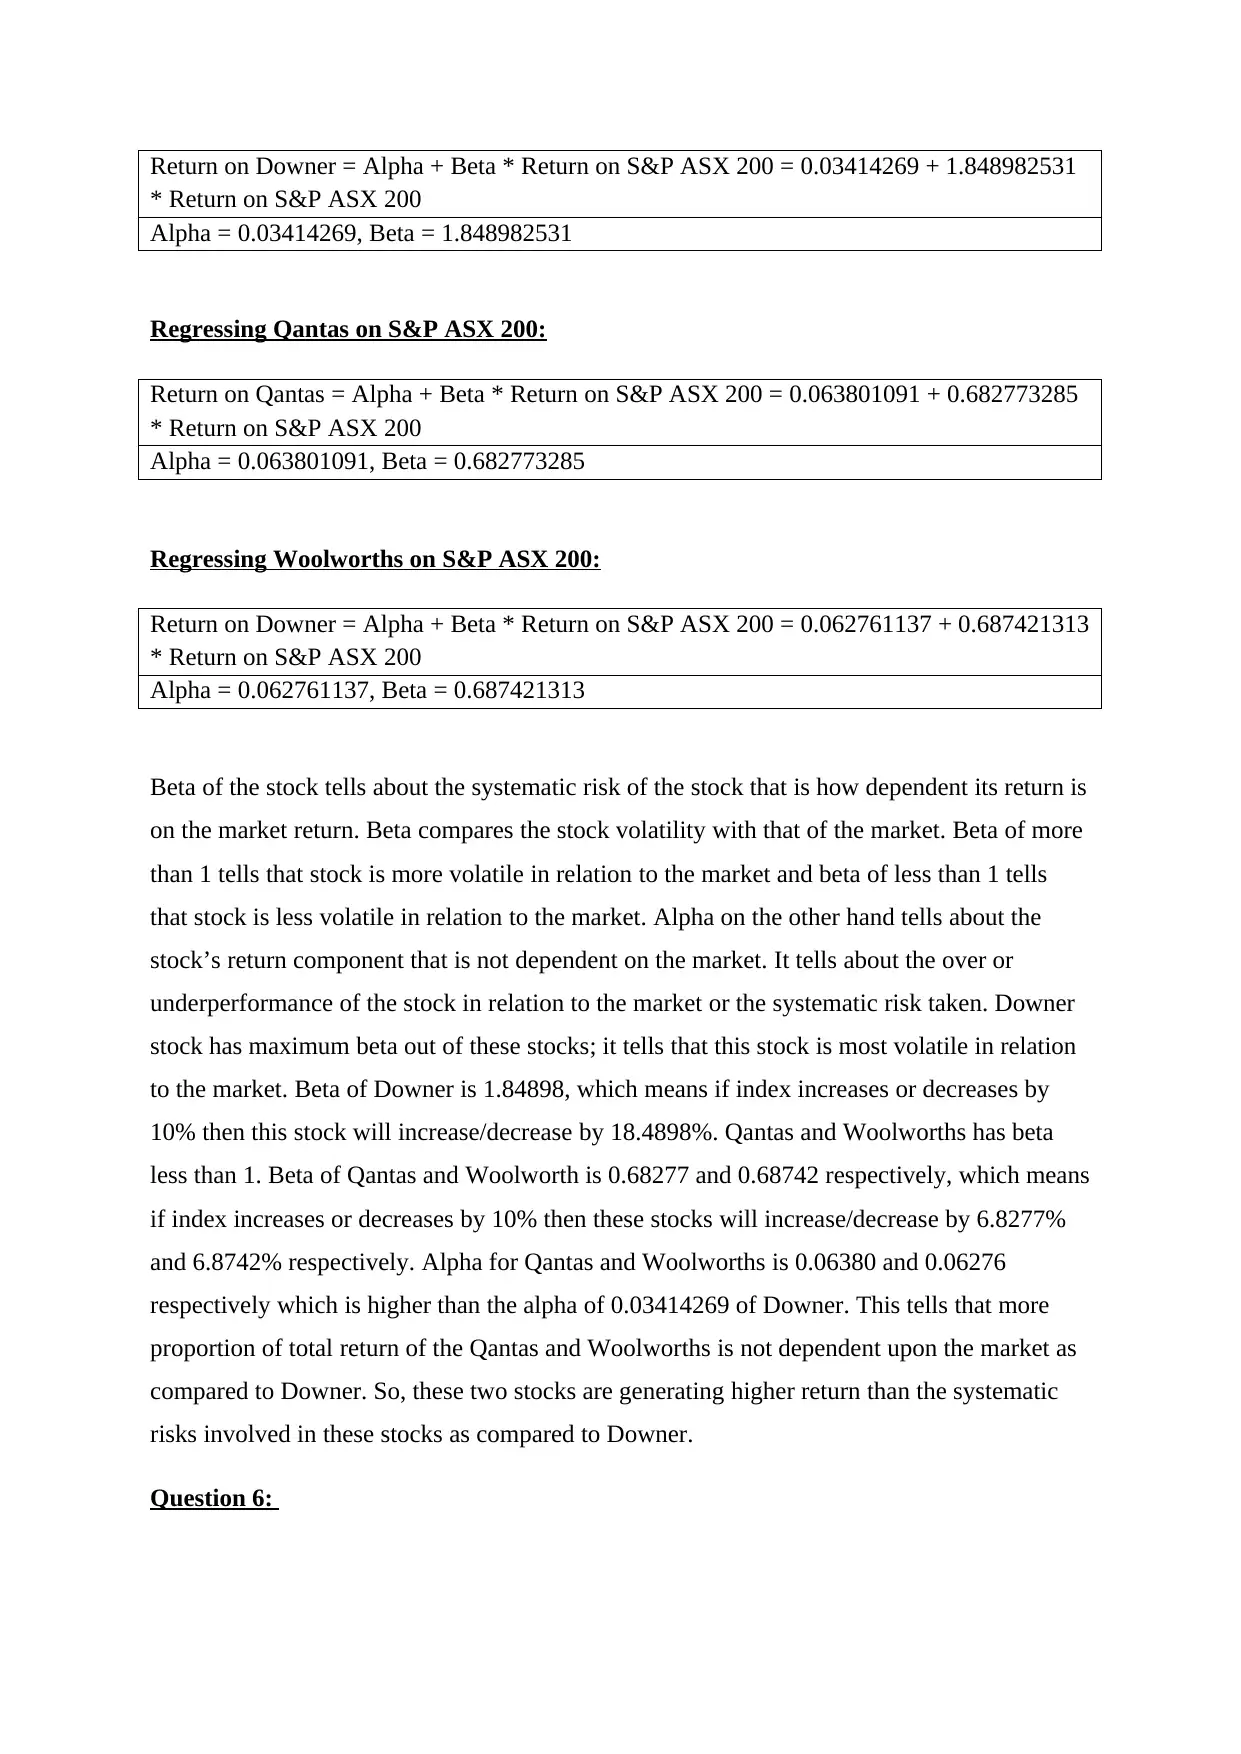
Return on Downer = Alpha + Beta * Return on S&P ASX 200 = 0.03414269 + 1.848982531
* Return on S&P ASX 200
Alpha = 0.03414269, Beta = 1.848982531
Regressing Qantas on S&P ASX 200:
Return on Qantas = Alpha + Beta * Return on S&P ASX 200 = 0.063801091 + 0.682773285
* Return on S&P ASX 200
Alpha = 0.063801091, Beta = 0.682773285
Regressing Woolworths on S&P ASX 200:
Return on Downer = Alpha + Beta * Return on S&P ASX 200 = 0.062761137 + 0.687421313
* Return on S&P ASX 200
Alpha = 0.062761137, Beta = 0.687421313
Beta of the stock tells about the systematic risk of the stock that is how dependent its return is
on the market return. Beta compares the stock volatility with that of the market. Beta of more
than 1 tells that stock is more volatile in relation to the market and beta of less than 1 tells
that stock is less volatile in relation to the market. Alpha on the other hand tells about the
stock’s return component that is not dependent on the market. It tells about the over or
underperformance of the stock in relation to the market or the systematic risk taken. Downer
stock has maximum beta out of these stocks; it tells that this stock is most volatile in relation
to the market. Beta of Downer is 1.84898, which means if index increases or decreases by
10% then this stock will increase/decrease by 18.4898%. Qantas and Woolworths has beta
less than 1. Beta of Qantas and Woolworth is 0.68277 and 0.68742 respectively, which means
if index increases or decreases by 10% then these stocks will increase/decrease by 6.8277%
and 6.8742% respectively. Alpha for Qantas and Woolworths is 0.06380 and 0.06276
respectively which is higher than the alpha of 0.03414269 of Downer. This tells that more
proportion of total return of the Qantas and Woolworths is not dependent upon the market as
compared to Downer. So, these two stocks are generating higher return than the systematic
risks involved in these stocks as compared to Downer.
Question 6:
* Return on S&P ASX 200
Alpha = 0.03414269, Beta = 1.848982531
Regressing Qantas on S&P ASX 200:
Return on Qantas = Alpha + Beta * Return on S&P ASX 200 = 0.063801091 + 0.682773285
* Return on S&P ASX 200
Alpha = 0.063801091, Beta = 0.682773285
Regressing Woolworths on S&P ASX 200:
Return on Downer = Alpha + Beta * Return on S&P ASX 200 = 0.062761137 + 0.687421313
* Return on S&P ASX 200
Alpha = 0.062761137, Beta = 0.687421313
Beta of the stock tells about the systematic risk of the stock that is how dependent its return is
on the market return. Beta compares the stock volatility with that of the market. Beta of more
than 1 tells that stock is more volatile in relation to the market and beta of less than 1 tells
that stock is less volatile in relation to the market. Alpha on the other hand tells about the
stock’s return component that is not dependent on the market. It tells about the over or
underperformance of the stock in relation to the market or the systematic risk taken. Downer
stock has maximum beta out of these stocks; it tells that this stock is most volatile in relation
to the market. Beta of Downer is 1.84898, which means if index increases or decreases by
10% then this stock will increase/decrease by 18.4898%. Qantas and Woolworths has beta
less than 1. Beta of Qantas and Woolworth is 0.68277 and 0.68742 respectively, which means
if index increases or decreases by 10% then these stocks will increase/decrease by 6.8277%
and 6.8742% respectively. Alpha for Qantas and Woolworths is 0.06380 and 0.06276
respectively which is higher than the alpha of 0.03414269 of Downer. This tells that more
proportion of total return of the Qantas and Woolworths is not dependent upon the market as
compared to Downer. So, these two stocks are generating higher return than the systematic
risks involved in these stocks as compared to Downer.
Question 6:
⊘ This is a preview!⊘
Do you want full access?
Subscribe today to unlock all pages.
Trusted by 1+ million students worldwide
ETFs are similar to the mutual funds in many ways but there are various benefits and issues
associated with investing in ETFs.
Benefits:
Alex is considering shifting from passive to more active investing approach. ETFs are
generally more efficient in this context as it allows intraday trading and they have low
expense ratio. The another benefit of ETFs alongside their real time pricing is that they give
more control over price as various order types can be used to execute ETF trades. ETFs are
also more tax efficient as compared to the mutual funds. ETFs, as mentioned, are generally
more tax-efficient than index mutual funds because ETFs are sold on exchange to other
buyers and fund does not have to sell assets. So, ETFs do not have capital gains taxes over
their investment life. Due to all these benefits ETFs are better choice for active investment
strategy that Alex is considering.
Issues:
There are higher trading costs related with ETFs, they do provide intraday trading and better
price control but there is transaction cost charged on ETFs whereas there are no such charges
on mutual funds. ETFs do not provide any automatic dividend reinvestment like the mutual
funds and there are charges that need to be paid for further investment into ETFs. This makes
ETFs unsuitable for long term wealth creation as operating and transaction fees over long
term can hurt investors. Also unlike the mutual funds it is not possible to automatically put
funds into or out of ETFs at regular intervals as there are no partial shares of ETFs whereas
any amount can be fully invested in the mutual funds. So, it can be more costly and complex
for Alex to use ETFs to accumulate savings for her children’s education.
1 out of 10
Your All-in-One AI-Powered Toolkit for Academic Success.
+13062052269
info@desklib.com
Available 24*7 on WhatsApp / Email
![[object Object]](/_next/static/media/star-bottom.7253800d.svg)
Unlock your academic potential
Copyright © 2020–2026 A2Z Services. All Rights Reserved. Developed and managed by ZUCOL.