Shift-Share Analysis and Economic Futures of Parramatta Report

Verified

Added on  2022/10/11

|8
|1522
|7
Report
AI Summary
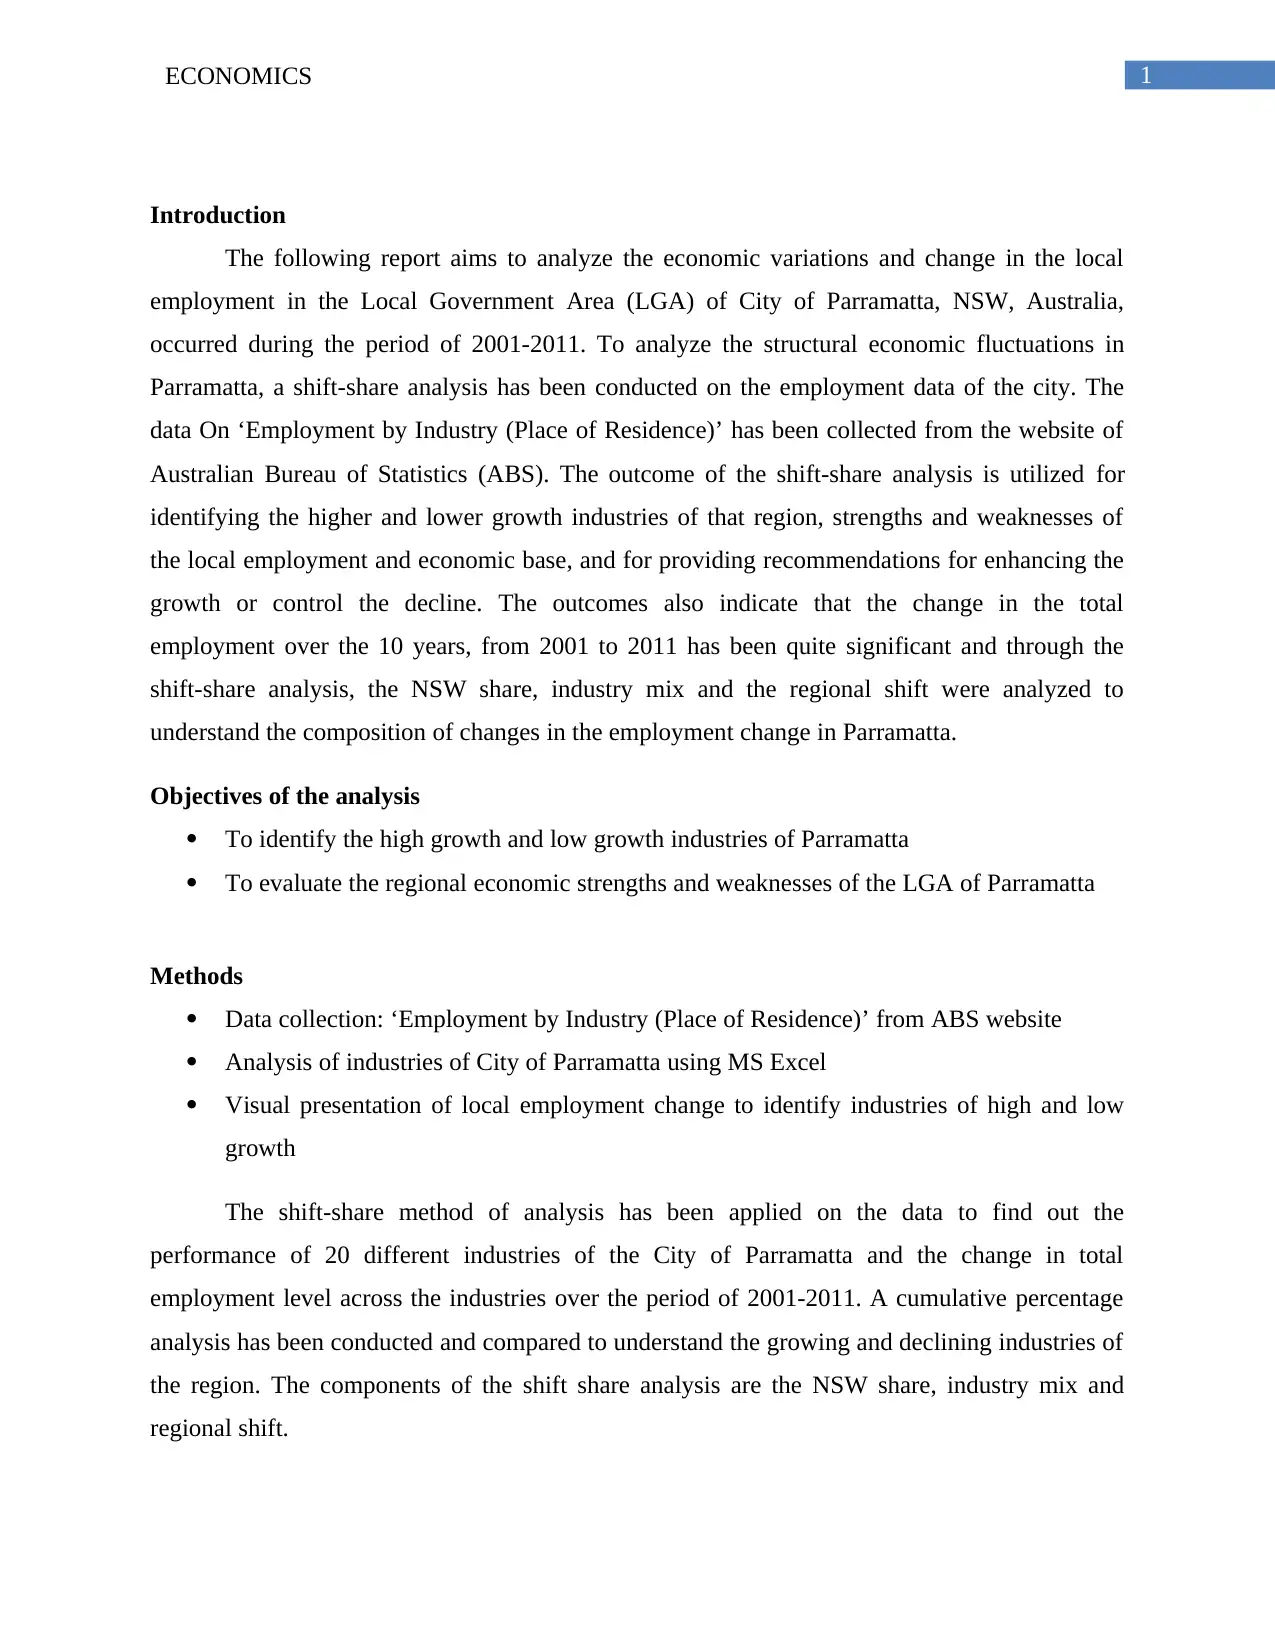
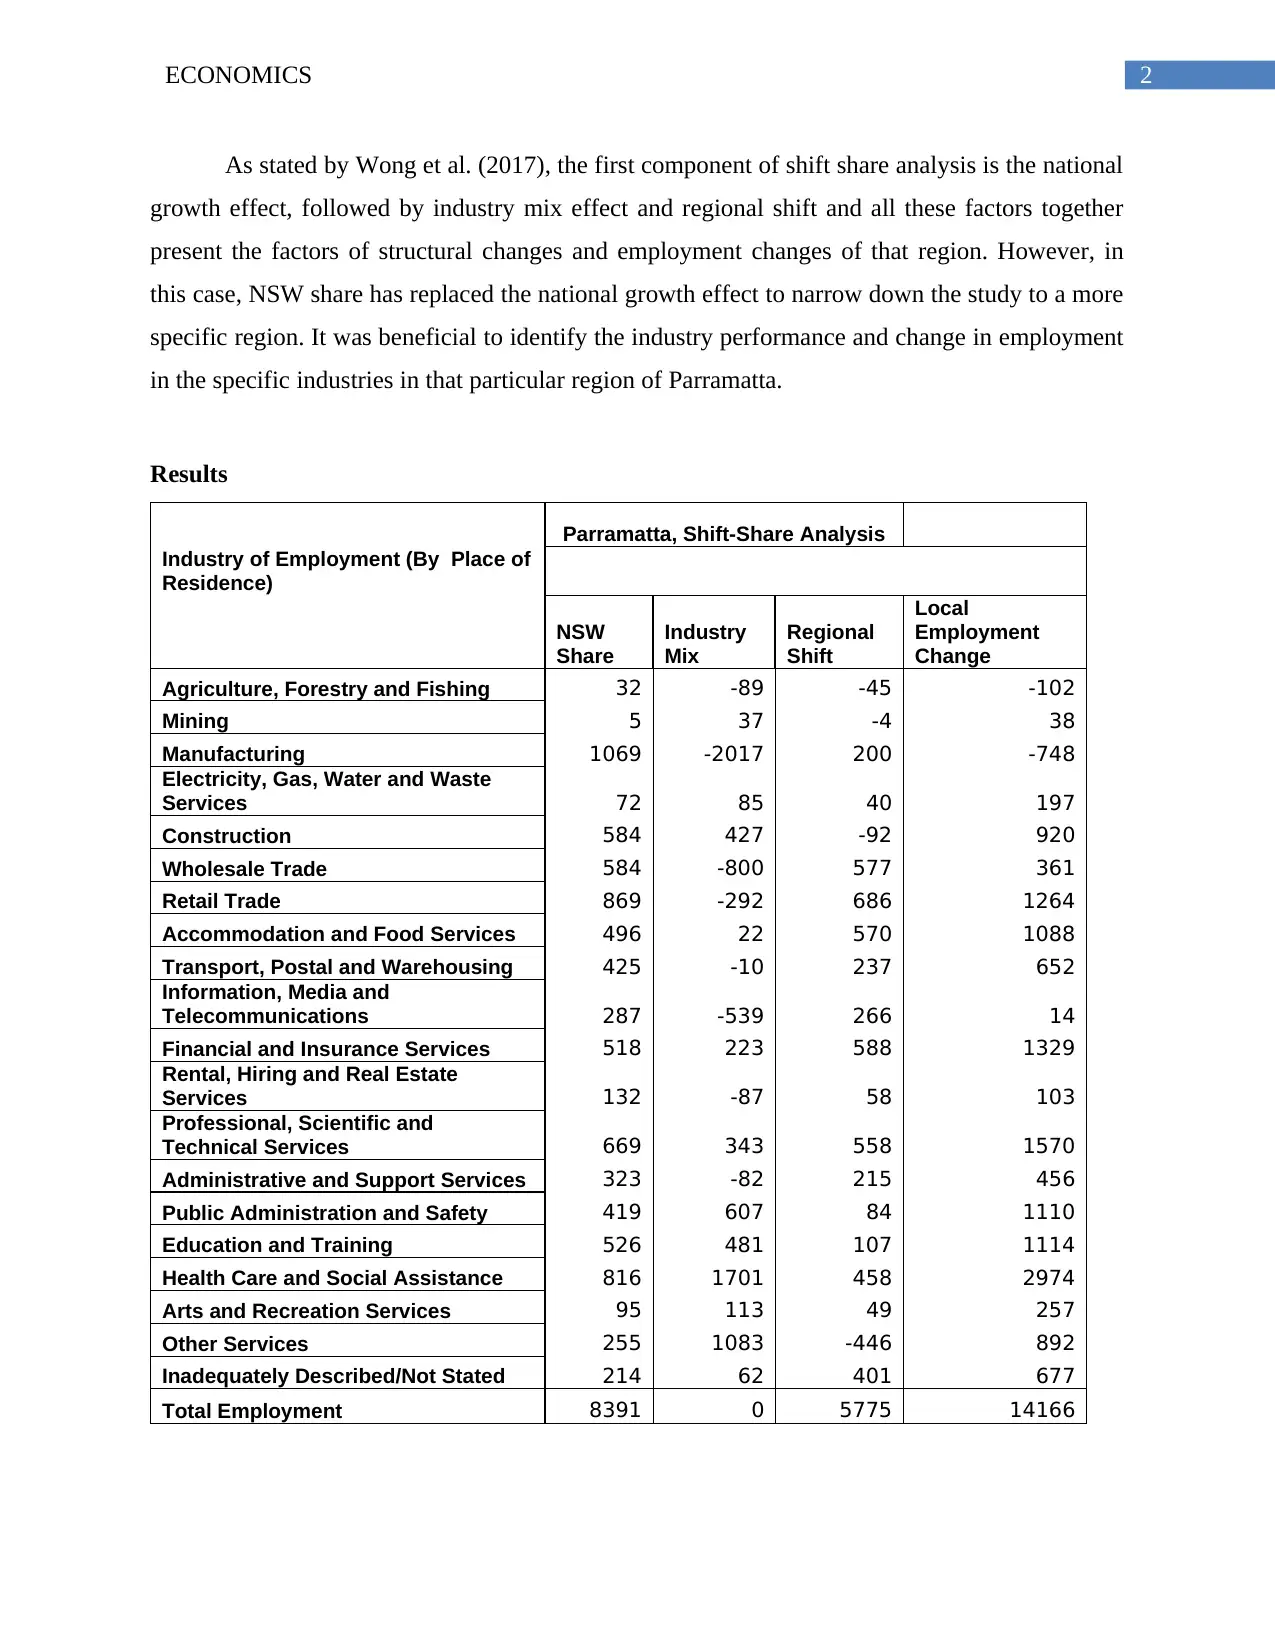
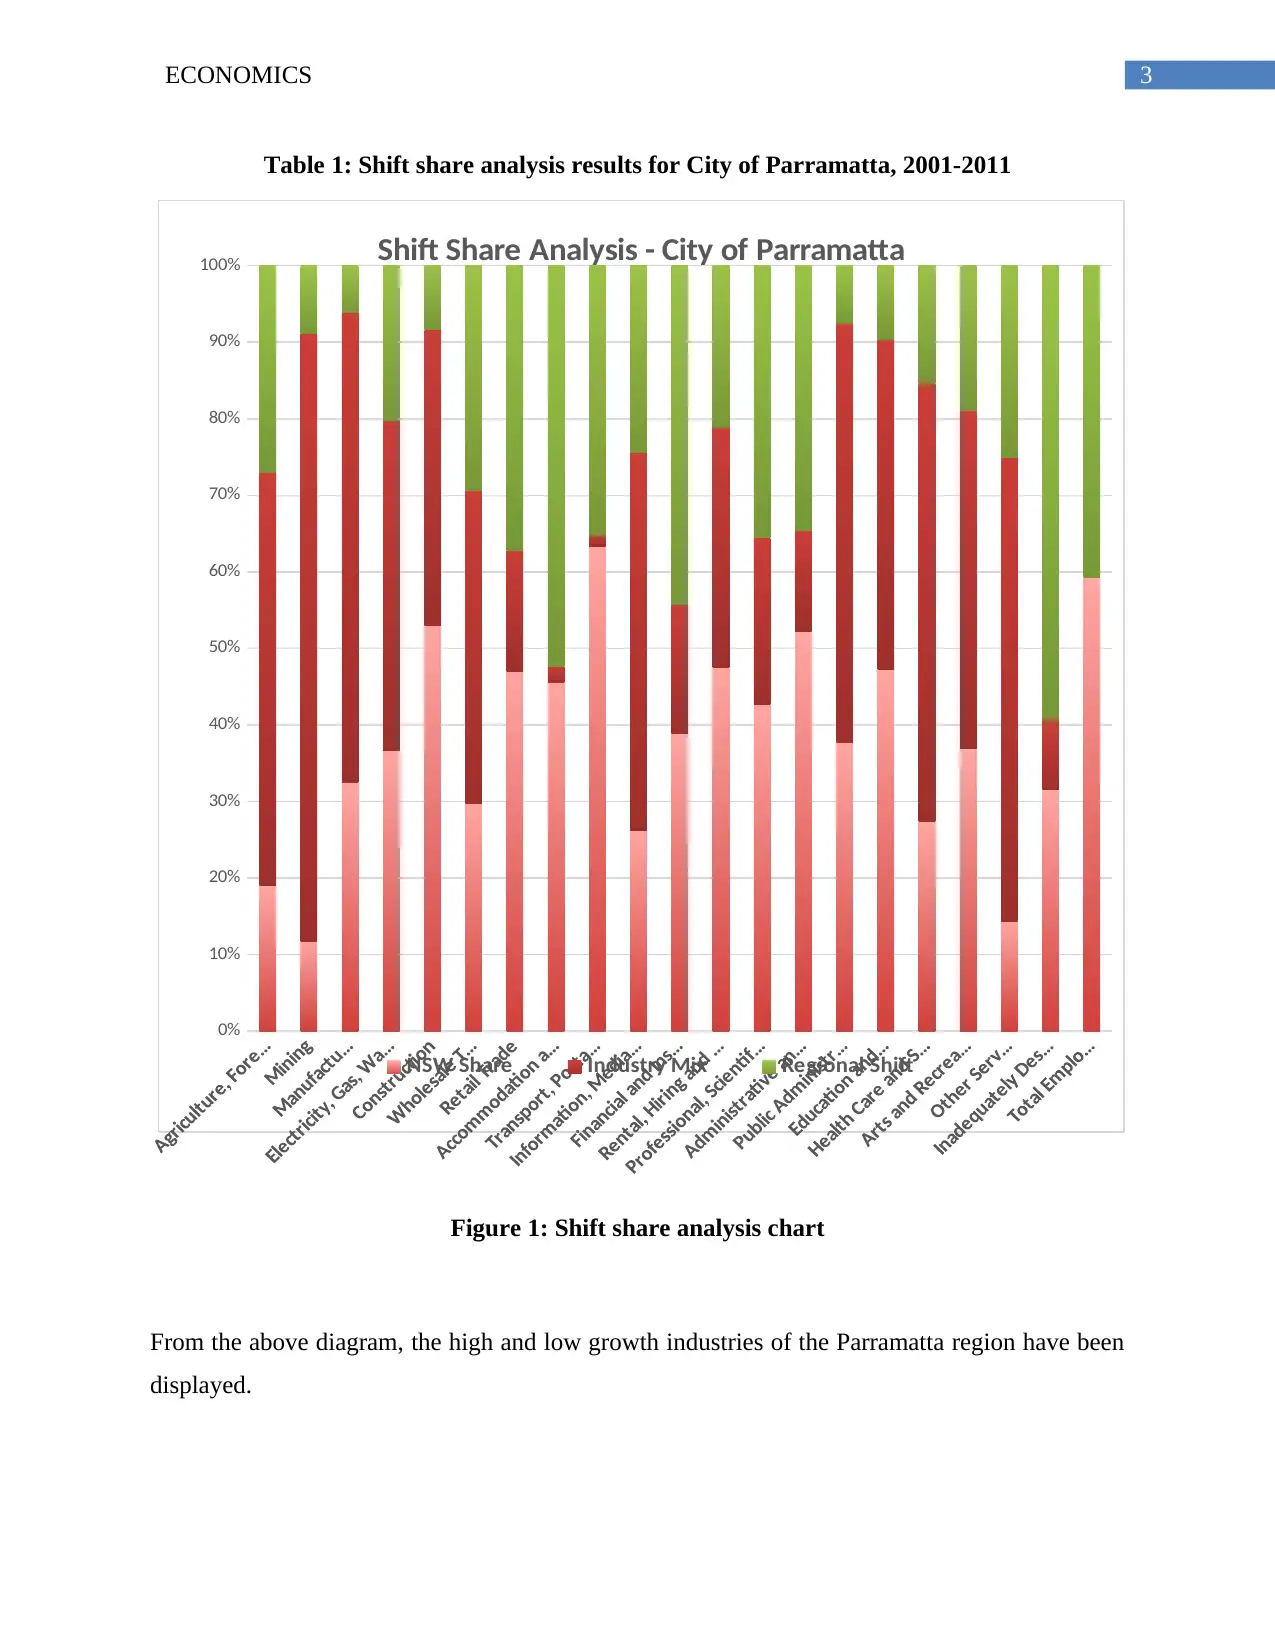
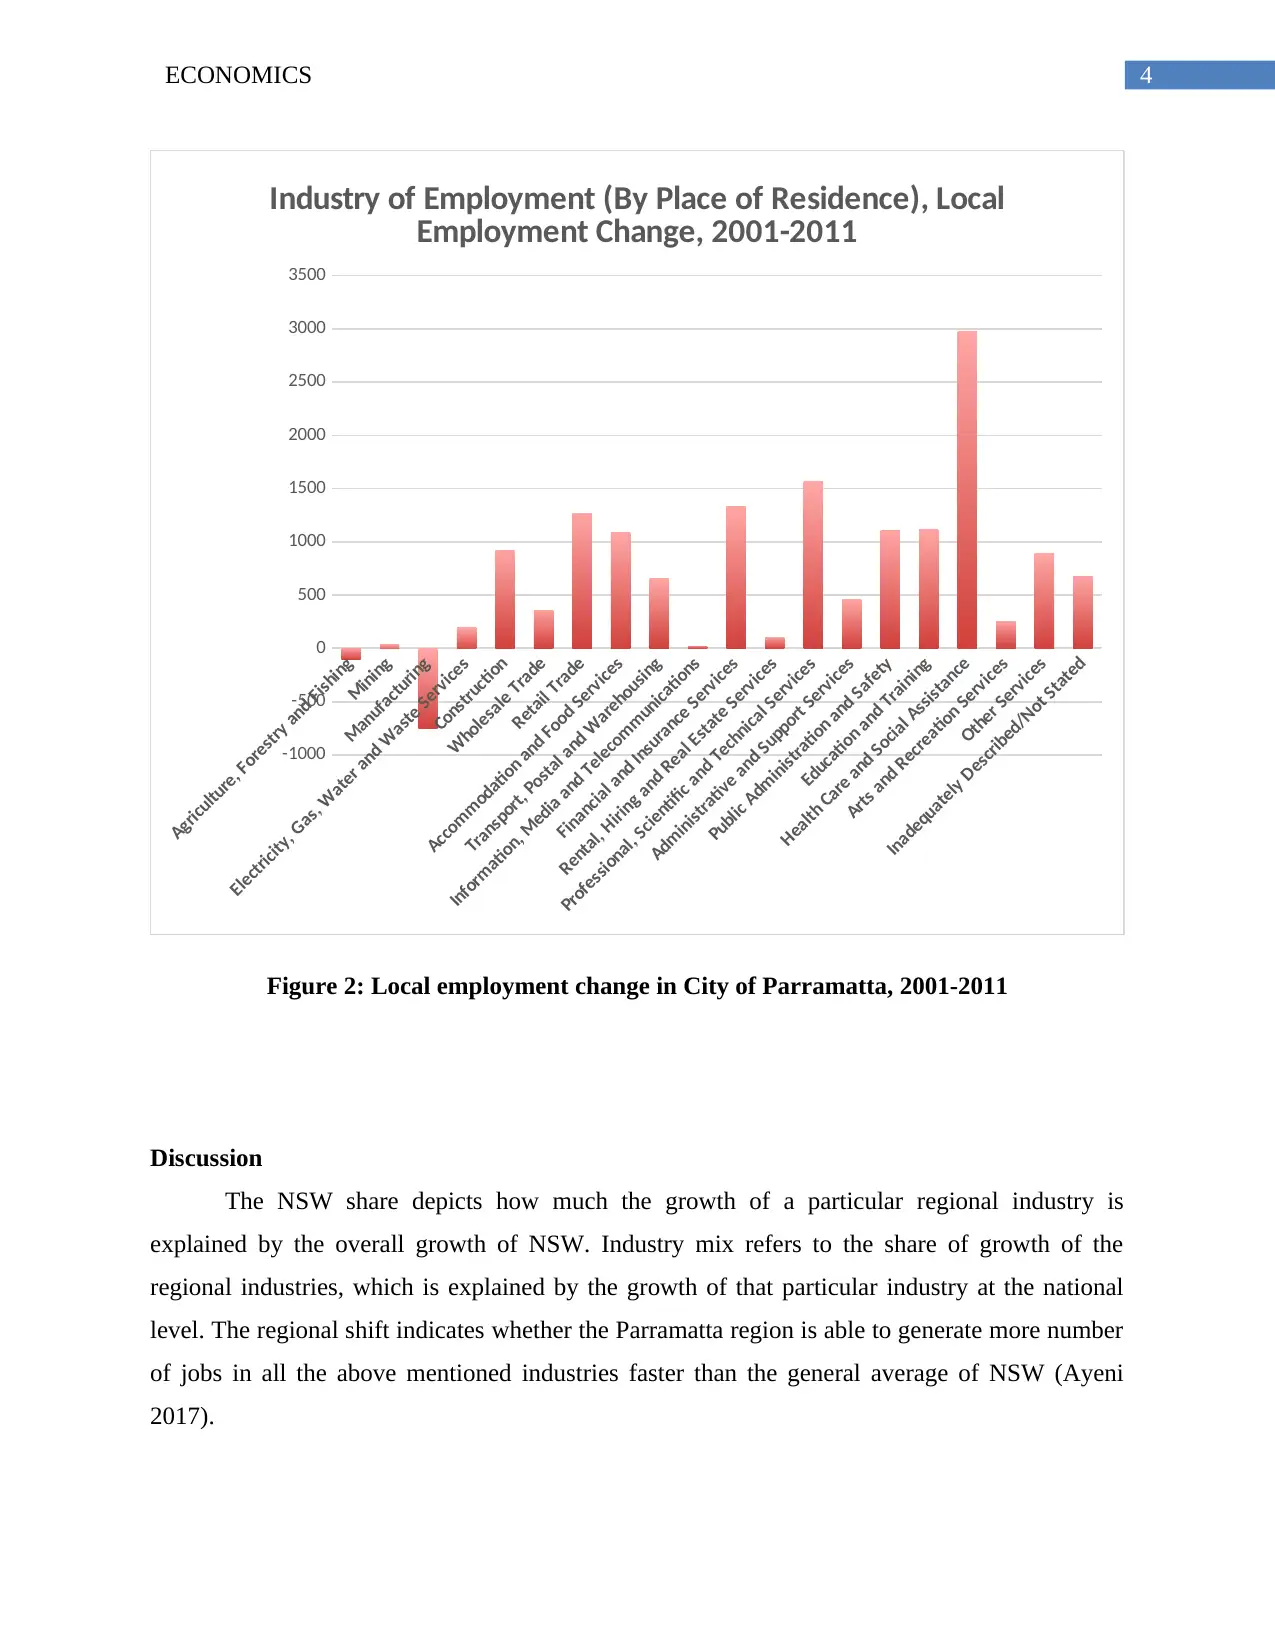
This report presents a shift-share analysis of the City of Parramatta, NSW, Australia, examining employment trends across various industries from 2001 to 2011. The study aims to identify high and low growth industries, evaluate regional economic strengths and weaknesses, and provide recommendations for enhancing economic growth. The analysis utilizes data from the Australian Bureau of Statistics (ABS) and applies the shift-share method to assess the NSW share, industry mix, and regional shift components of employment changes. The findings reveal the impact of NSW growth on local industries, highlighting sectors that have experienced significant growth or decline. The report recommends that the city council focuses on improving specific industries to create more employment opportunities and match the overall growth of NSW, emphasizing the importance of industry mix in driving economic development. The study provides valuable insights for local government planning and economic development strategies.
Document Page
Running head: ECONOMICS
Shift-Share Analysis and local council report on economic futures of City of Parramatta
Name of the Student:
Name of the University:
Author note:
tabler-icon-diamond-filled.svg

Paraphrase This Document

Need a fresh take? Get an instant paraphrase of this document with our AI Paraphraser
Document Page
ECONOMICS 1
Introduction
The following report aims to analyze the economic variations and change in the local
employment in the Local Government Area (LGA) of City of Parramatta, NSW, Australia,
occurred during the period of 2001-2011. To analyze the structural economic fluctuations in
Parramatta, a shift-share analysis has been conducted on the employment data of the city. The
data On ‘Employment by Industry (Place of Residence)’ has been collected from the website of
Australian Bureau of Statistics (ABS). The outcome of the shift-share analysis is utilized for
identifying the higher and lower growth industries of that region, strengths and weaknesses of
the local employment and economic base, and for providing recommendations for enhancing the
growth or control the decline. The outcomes also indicate that the change in the total
employment over the 10 years, from 2001 to 2011 has been quite significant and through the
shift-share analysis, the NSW share, industry mix and the regional shift were analyzed to
understand the composition of changes in the employment change in Parramatta.
Objectives of the analysis
To identify the high growth and low growth industries of Parramatta
To evaluate the regional economic strengths and weaknesses of the LGA of Parramatta
Methods
Data collection: ‘Employment by Industry (Place of Residence)’ from ABS website
Analysis of industries of City of Parramatta using MS Excel
Visual presentation of local employment change to identify industries of high and low
growth
The shift-share method of analysis has been applied on the data to find out the
performance of 20 different industries of the City of Parramatta and the change in total
employment level across the industries over the period of 2001-2011. A cumulative percentage
analysis has been conducted and compared to understand the growing and declining industries of
the region. The components of the shift share analysis are the NSW share, industry mix and
regional shift.
Document Page
2ECONOMICS
As stated by Wong et al. (2017), the first component of shift share analysis is the national
growth effect, followed by industry mix effect and regional shift and all these factors together
present the factors of structural changes and employment changes of that region. However, in
this case, NSW share has replaced the national growth effect to narrow down the study to a more
specific region. It was beneficial to identify the industry performance and change in employment
in the specific industries in that particular region of Parramatta.
Results
Parramatta, Shift-Share Analysis
Industry of Employment (By Place of
Residence)
NSW
Share
Industry
Mix
Regional
Shift
Local
Employment
Change
Agriculture, Forestry and Fishing 32 -89 -45 -102
Mining 5 37 -4 38
Manufacturing 1069 -2017 200 -748
Electricity, Gas, Water and Waste
Services 72 85 40 197
Construction 584 427 -92 920
Wholesale Trade 584 -800 577 361
Retail Trade 869 -292 686 1264
Accommodation and Food Services 496 22 570 1088
Transport, Postal and Warehousing 425 -10 237 652
Information, Media and
Telecommunications 287 -539 266 14
Financial and Insurance Services 518 223 588 1329
Rental, Hiring and Real Estate
Services 132 -87 58 103
Professional, Scientific and
Technical Services 669 343 558 1570
Administrative and Support Services 323 -82 215 456
Public Administration and Safety 419 607 84 1110
Education and Training 526 481 107 1114
Health Care and Social Assistance 816 1701 458 2974
Arts and Recreation Services 95 113 49 257
Other Services 255 1083 -446 892
Inadequately Described/Not Stated 214 62 401 677
Total Employment 8391 0 5775 14166
Document Page
3ECONOMICS
Table 1: Shift share analysis results for City of Parramatta, 2001-2011
0%
10%
20%
30%
40%
50%
60%
70%
80%
90%
100% Shift Share Analysis - City of Parramatta
NSW Share Industry Mix Regional Shift
Figure 1: Shift share analysis chart
From the above diagram, the high and low growth industries of the Parramatta region have been
displayed.
tabler-icon-diamond-filled.svg

Paraphrase This Document

Need a fresh take? Get an instant paraphrase of this document with our AI Paraphraser
Document Page
4ECONOMICS
Agriculture, Forestry and Fishing
Mining
Manufacturing
Electricity, Gas, Water and Waste Services
Construction
Wholesale Trade
Retail Trade
Accommodation and Food Services
Transport, Postal and Warehousing
Information, Media and Telecommunications
Financial and Insurance Services
Rental, Hiring and Real Estate Services
Professional, Scientific and Technical Services
Administrative and Support Services
Public Administration and Safety
Education and Training
Health Care and Social Assistance
Arts and Recreation Services
Other Services
Inadequately Described/Not Stated
-1000
-500
0
500
1000
1500
2000
2500
3000
3500
Industry of Employment (By Place of Residence), Local
Employment Change, 2001-2011
Figure 2: Local employment change in City of Parramatta, 2001-2011
Discussion
The NSW share depicts how much the growth of a particular regional industry is
explained by the overall growth of NSW. Industry mix refers to the share of growth of the
regional industries, which is explained by the growth of that particular industry at the national
level. The regional shift indicates whether the Parramatta region is able to generate more number
of jobs in all the above mentioned industries faster than the general average of NSW (Ayeni
2017).
Document Page
5ECONOMICS
The above findings show that almost all the industries are getting benefitted due to
overall growth of NSW. The average growth of NSW is found to be around 50%, and hence,
approximately all the industries are benefitted by the NSW growth and it explains growth
percentage between 40% to 60% for the industries. Among all, the NSW growth explains more
than 60% growth for transport, postal and warehousing industry and it is lowest, around 10% for
mining industry, followed by ‘Other services’. Thus, it can be inferred that the growth of NSW
does not explain the growth in mining and ‘other services’ in Parramatta.
Regarding the industry mix, it can be seen that agriculture is most declining industry of
Parramatta, followed by manufacturing, wholesale trade, retail trade, information, media and
telecommunication, rental, hiring, real estate services and administrative and support services.
these industries are not performing well in the Parramatta region. On the other hand, mining
industry, electricity, gas, water and waste service, accommodation and food services, transport,
postal and warehousing services, financial and insurance services and the rest of the industries
have shown growth between 2001 and 2011. Thus, the growth of mining is mostly explained by
almost 70% by the growth of mining sector at a national level. This is also found to be higher for
public administration and safety, healthcare and social assistance, arts and recreation services,
electricity, gas, water and waste services and construction. Thus, it can be implied that these
industries are growing fast at the national level and thereby influencing growth and job creation
in Parramatta region.
The regional shift is highest in accommodation and food services followed by financial
and insurance services, which implies these two sectors produced faster and greater number of
jobs as compared to the national job growth in these 2 sectors. The regional shift is also higher
for quite a few industries, such as, transport, postal and warehousing, professional, scientific and
technical services, wholesale trade, retail trade and administrative and support services. This
implies that all these sectors could produce a faster job creation than the national level growth
rate.
The graph on the local employment change shows that healthcare sector provided
maximum employment in the 10 years, followed by professional, scientific and technical
services, retail trade, accommodation and food services and financial and insurance services,
while manufacturing industry faced largest fall in employment.
Document Page
6ECONOMICS
Thus, it can be recommended that the city council of Parramatta must focus on improving
the agriculture, forestry and fishing services, manufacturing services, information, media and
telecommunication services and rental, hiring and real estate services to create more employment
in the region. The high employment creating services are more dynamic than the ones that
experienced low rate of unemployment (Clegg 2017).
Conclusion
It can be noticed from the above analytical findings that there are quite a few high growth
industries in Parramatta that provided employment during 2001-2011. However, the city council
should provide more capital investment in the low growth industries as mentioned above to
match with the overall growth of NSW. In the total employment change, there is not much role
of industry mix, indicating the high and low growth effects of the industries are neutralized. The
city council must focus on improving the industry mix to create more employment opportunities
in Parramatta.
tabler-icon-diamond-filled.svg

Paraphrase This Document

Need a fresh take? Get an instant paraphrase of this document with our AI Paraphraser
Document Page
7ECONOMICS
References
Ayeni, B., 2017. Concepts and techniques in urban analysis. Routledge.
Clegg, S.R. ed., 2017. Organization theory and class analysis: New approaches and new
issues (Vol. 17). Walter de Gruyter GmbH & Co KG.
Wong, S.C., Chew, P.S., Chew, Y.T., Mok, J.Y. and Sim, S.Y., 2017. Regional Development of
Specification and Employment Developmant in Sabah and Sarawak: An Analysis with Shift
Share Techniques (Doctoral dissertation, UTAR).
chevron_up_icon
1 out of 8
circle_padding
hide_on_mobile
zoom_out_icon
[object Object]