Economic Analysis: Shift Share Report on Parramatta City Council

Verified

Added on  2023/06/03

|8
|1860
|264
Report
AI Summary
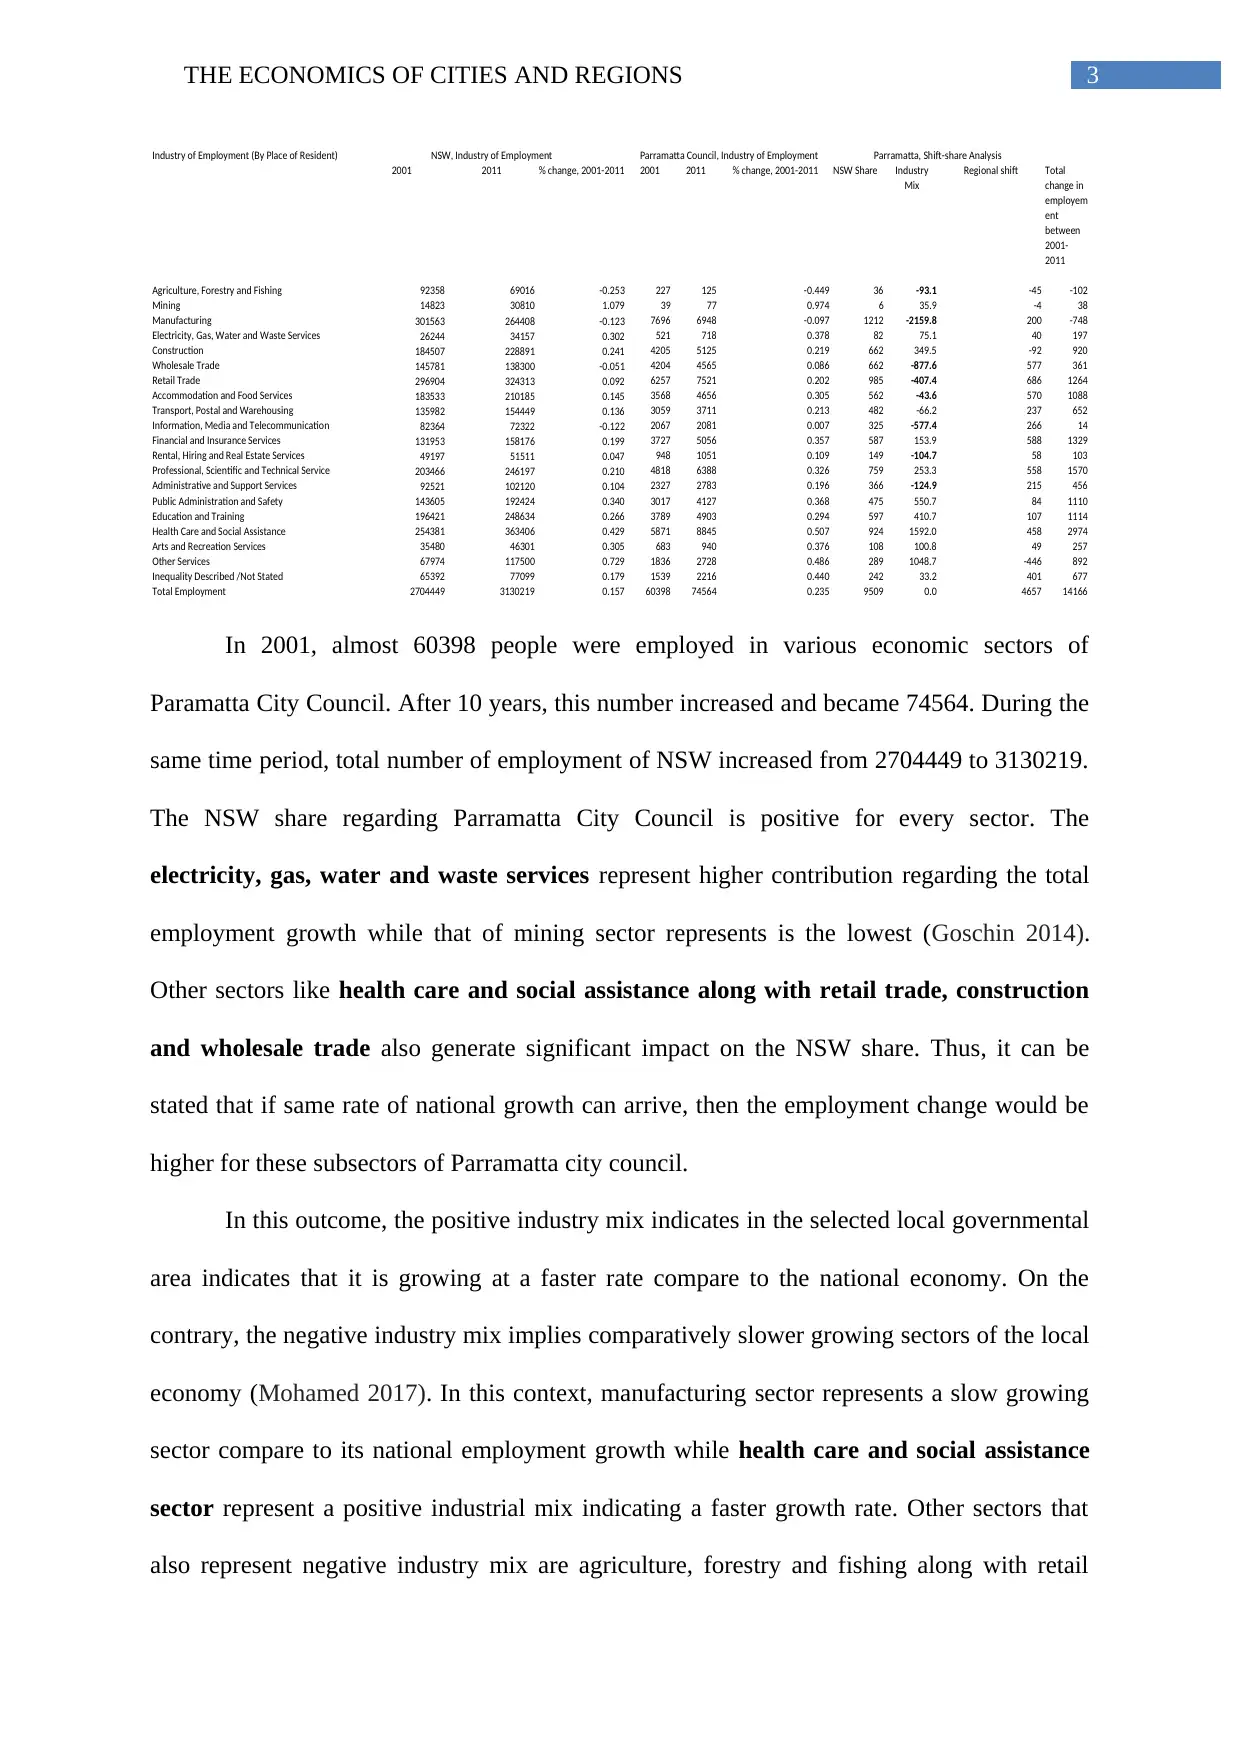
This report conducts a shift-share analysis of the Parramatta City Council's economy between 2001 and 2011, examining employment growth through NSW share, industry mix, and regional shift components. The analysis identifies sectors with competitive advantages and those requiring attention for economic stimulation. Key findings indicate a shift from primary industries and manufacturing towards service sectors like electricity, gas, water, financial services, and public administration as significant contributors to economic growth. The report recommends that the government focus on policies to further develop thriving sectors and revitalize less effective sectors to balance employment generation. Ultimately, the shift-share analysis informs policy decisions aimed at fostering economic development in Parramatta City Council, with similar assignments and past papers available on Desklib for students.
Document Page
Running head: THE ECONOMICS OF CITIES AND REGIONS
The economics of cities and regions
Name of the student
Name of the University
Author Note
tabler-icon-diamond-filled.svg

Paraphrase This Document

Need a fresh take? Get an instant paraphrase of this document with our AI Paraphraser
Document Page
1THE ECONOMICS OF CITIES AND REGIONS
Table of Contents
Introduction:...............................................................................................................................2
Analysis:.....................................................................................................................................2
Recommendations:.....................................................................................................................4
Recommendations:.....................................................................................................................5
Conclusion:................................................................................................................................5
References:.................................................................................................................................7
Document Page
2THE ECONOMICS OF CITIES AND REGIONS
Introduction:
Shift share implies a standard analysis, based on any region to determine that regional
growth of employment can be characterised to national trends and affect of regional factors
on it (Danko III and Hanink 2017). In the given situation, a shift share analysis is conducted
on Parramatta City Council to understand economic changes between 2001 and 2011. Hence,
this report intends to show the structural economic changes of this local government area
relative to New South Wales (NSW). Based on this analysis, the report further focuses to
provide a set of recommendations about this council’s respond for economic strengths and
weaknesses. In addition to this, a critical reflection of this shift share analysis will be
provided.
Analysis:
To conduct shift share analysis, entire employment growth of Parramatta City Council
has been divided into three parts, which are, NSW share, industry mix and regional shift.
NSW share will measure the number of total employment in the chosen local government
area because of growth in the NSW economy during 2001-2011. Industry mix will identify
fast or slow growing economic sectors in this local area depending on the growth rates of
respective industry sectors (Khusaini 2015). On the other side, regional shift highlights
leading sectors and lagging sector of this local government area.
Document Page
3THE ECONOMICS OF CITIES AND REGIONS
Industry of Employment (By Place of Resident)
2001 2011 % change, 2001-2011 2001 2011 % change, 2001-2011 NSW Share Industry
Mix
Regional shift Total
change in
employem
ent
between
2001-
2011
Agriculture, Forestry and Fishing 92358 69016 -0.253 227 125 -0.449 36 -93.1 -45 -102
Mining 14823 30810 1.079 39 77 0.974 6 35.9 -4 38
Manufacturing 301563 264408 -0.123 7696 6948 -0.097 1212 -2159.8 200 -748
Electricity, Gas, Water and Waste Services 26244 34157 0.302 521 718 0.378 82 75.1 40 197
Construction 184507 228891 0.241 4205 5125 0.219 662 349.5 -92 920
Wholesale Trade 145781 138300 -0.051 4204 4565 0.086 662 -877.6 577 361
Retail Trade 296904 324313 0.092 6257 7521 0.202 985 -407.4 686 1264
Accommodation and Food Services 183533 210185 0.145 3568 4656 0.305 562 -43.6 570 1088
Transport, Postal and Warehousing 135982 154449 0.136 3059 3711 0.213 482 -66.2 237 652
Information, Media and Telecommunication 82364 72322 -0.122 2067 2081 0.007 325 -577.4 266 14
Financial and Insurance Services 131953 158176 0.199 3727 5056 0.357 587 153.9 588 1329
Rental, Hiring and Real Estate Services 49197 51511 0.047 948 1051 0.109 149 -104.7 58 103
Professional, Scientific and Technical Service 203466 246197 0.210 4818 6388 0.326 759 253.3 558 1570
Administrative and Support Services 92521 102120 0.104 2327 2783 0.196 366 -124.9 215 456
Public Administration and Safety 143605 192424 0.340 3017 4127 0.368 475 550.7 84 1110
Education and Training 196421 248634 0.266 3789 4903 0.294 597 410.7 107 1114
Health Care and Social Assistance 254381 363406 0.429 5871 8845 0.507 924 1592.0 458 2974
Arts and Recreation Services 35480 46301 0.305 683 940 0.376 108 100.8 49 257
Other Services 67974 117500 0.729 1836 2728 0.486 289 1048.7 -446 892
Inequality Described /Not Stated 65392 77099 0.179 1539 2216 0.440 242 33.2 401 677
Total Employment 2704449 3130219 0.157 60398 74564 0.235 9509 0.0 4657 14166
NSW, Industry of Employment Parramatta Council, Industry of Employment Parramatta, Shift-share Analysis
In 2001, almost 60398 people were employed in various economic sectors of
Paramatta City Council. After 10 years, this number increased and became 74564. During the
same time period, total number of employment of NSW increased from 2704449 to 3130219.
The NSW share regarding Parramatta City Council is positive for every sector. The
electricity, gas, water and waste services represent higher contribution regarding the total
employment growth while that of mining sector represents is the lowest (Goschin 2014).
Other sectors like health care and social assistance along with retail trade, construction
and wholesale trade also generate significant impact on the NSW share. Thus, it can be
stated that if same rate of national growth can arrive, then the employment change would be
higher for these subsectors of Parramatta city council.
In this outcome, the positive industry mix indicates in the selected local governmental
area indicates that it is growing at a faster rate compare to the national economy. On the
contrary, the negative industry mix implies comparatively slower growing sectors of the local
economy (Mohamed 2017). In this context, manufacturing sector represents a slow growing
sector compare to its national employment growth while health care and social assistance
sector represent a positive industrial mix indicating a faster growth rate. Other sectors that
also represent negative industry mix are agriculture, forestry and fishing along with retail
tabler-icon-diamond-filled.svg

Paraphrase This Document

Need a fresh take? Get an instant paraphrase of this document with our AI Paraphraser
Document Page
4THE ECONOMICS OF CITIES AND REGIONS
trade and transport and postal, wholesale trade and warehousing. This represents that
employment in these specified sectors at the local government area in a portion of
comparatively slow-growing sectors of NSW. On the contrary, other positive industry mix
sectors are construction, financial and insurance services, professional, scientific and
technical service, mining, electricity, gas, water and waste services, arts and recreation
services and other services represent positive industry mix (Salvatori 2018). Other two
sectors fallen under these categories are education and training along with public
administration and safety. According this outcome it can be stated that subsectors under
health care and social assistance, other services and public administration and safety play
significant role in the context of employment growth in Parramatta City Council during 2001-
2011.
The impact of positive regional shift implies that the local government area has
successfully attracted investment in a particular area. In addition to this, it also represents
comparative advantage for a particular sector’s region (Giannakis and Bruggeman 2017). On
the contrary, negative regional shift implies that this particular local economy is sacrificing
its share compare to other regions. In this given situation, positive competitive effect of retail
trade along with wholesale trade, accommodation and food services, financial and
insurance services their competitive advantage for economic growth of Parramatta City
Council. Therefore, the overall employment growth rate is negative manufacturing,
agriculture, forestry and fishing sectors while other sectors have developed significantly. In
addition to this, electricity, gas, water and waste services sector also falls under this
category.
Recommendations:
Thus, the subsectors that can considered as the strength of this economy are:
1. electricity, gas, water and waste services
Document Page
5THE ECONOMICS OF CITIES AND REGIONS
2. Financial and insurance services
3. Professional, scientific and technical service
4. Public administration and safety
5. Education and training
6. Health care and social assistance
7. Arts and recreational services
8. Not stated
Thus, it can be stated that all service sectors create employment opportunity in this local
area, as they are enjoying competitive advantage (Erkuş-Öztürk and Terhorst 2018). On the
other side, primary industries along with manufacturing and some other service sectors have
represented weak economic condition for generating employment.
Recommendations:
The main feature of this outcome is that agriculture, mining, manufacturing that were
considered as the vital sectors have not remain major contributors of the Parramatta City
Council’s economic growth. On the contrary, electricity, gas, water and waste services along
with financial and insurance services, professional, scientific and technical service as well as
public administration and safety are playing significant role develop economic condition of
this sector (Othman, Yusop and Ismail 2018). In this context, the government needs to
provide considerable attention on these less affective sectors for stimulating their economic
condition in future. On the contrary, the government can take proper policy to develop
financial and insurance service further so that these sectors in future can generate more
employment opportunities.
Conclusion:
Thus the entire report has conducted shift-share analysis to understand about the
changing economy of the Parramatta City Council, based on which the government can take
Document Page
6THE ECONOMICS OF CITIES AND REGIONS
proper policies. This report considers various sectors that can affect economic growth of
employment of this local government area. Hence, through analysing comparative advantage
of these particular sectors, the government can take various development decisions. This
report has represented that mining, manufacturing and agricultural sector along with some
service sectors require special attention so that they can develop employment generation like
others.
tabler-icon-diamond-filled.svg

Paraphrase This Document

Need a fresh take? Get an instant paraphrase of this document with our AI Paraphraser
Document Page
7THE ECONOMICS OF CITIES AND REGIONS
References:
Danko III, J.J. and Hanink, D.M., 2017. Evaluating the local socio-economic impact of
redevelopments using shift-share analysis: a case study of destination redevelopments in Las
Vegas (1990–2010). Journal of urban Design, 22(3), pp.347-369.
Erkuş-Öztürk, H. and Terhorst, P., 2018. Economic diversification of a single-asset tourism
city: Evidence from Antalya. Current Issues in Tourism, 21(4), pp.422-439.
Giannakis, E. and Bruggeman, A., 2017. Economic crisis and regional resilience: Evidence
from Greece. Papers in Regional Science, 96(3), pp.451-476.
Goschin, Z., 2014. Regional growth in Romania after its accession to EU: a shift-share
analysis approach. Procedia Economics and Finance, 15, pp.169-175.
Khusaini, M., 2015. A Shift-share Analysis on Regional Competitiveness-A Case of
Banyuwangi District, East Java, Indonesia. Procedia-Social and Behavioral Sciences, 211,
pp.738-744.
Mohamed, A.B., 2017. THE SHIFT-SHARE ANALYSIS OF TUNISIAN REGIONS
LOCAL AND STRUCTURAL DYNAMICS. Kuwait Chapter of the Arabian Journal of
Business and Management Review, 6(11), pp.48-65.
Othman, N., Yusop, Z. and Ismail, M.M., 2018. IDENTIFYING EXPORT
COMPETITIVENESS OF MALAYSIA’S PROCESSED PALM OIL: USING SHIFT-
SHARE TECHNIQUE. International Journal, 3(12), pp.1-11.
Salvatori, A., 2018. The anatomy of job polarisation in the UK. Journal for labour market
research, 52(1), p.8.
chevron_up_icon
1 out of 8
circle_padding
hide_on_mobile
zoom_out_icon
[object Object]