SHM System Flowchart: Enhancing Reliability of Monitoring Systems
VerifiedAdded on  2023/04/25
|9
|1284
|84
Project
AI Summary
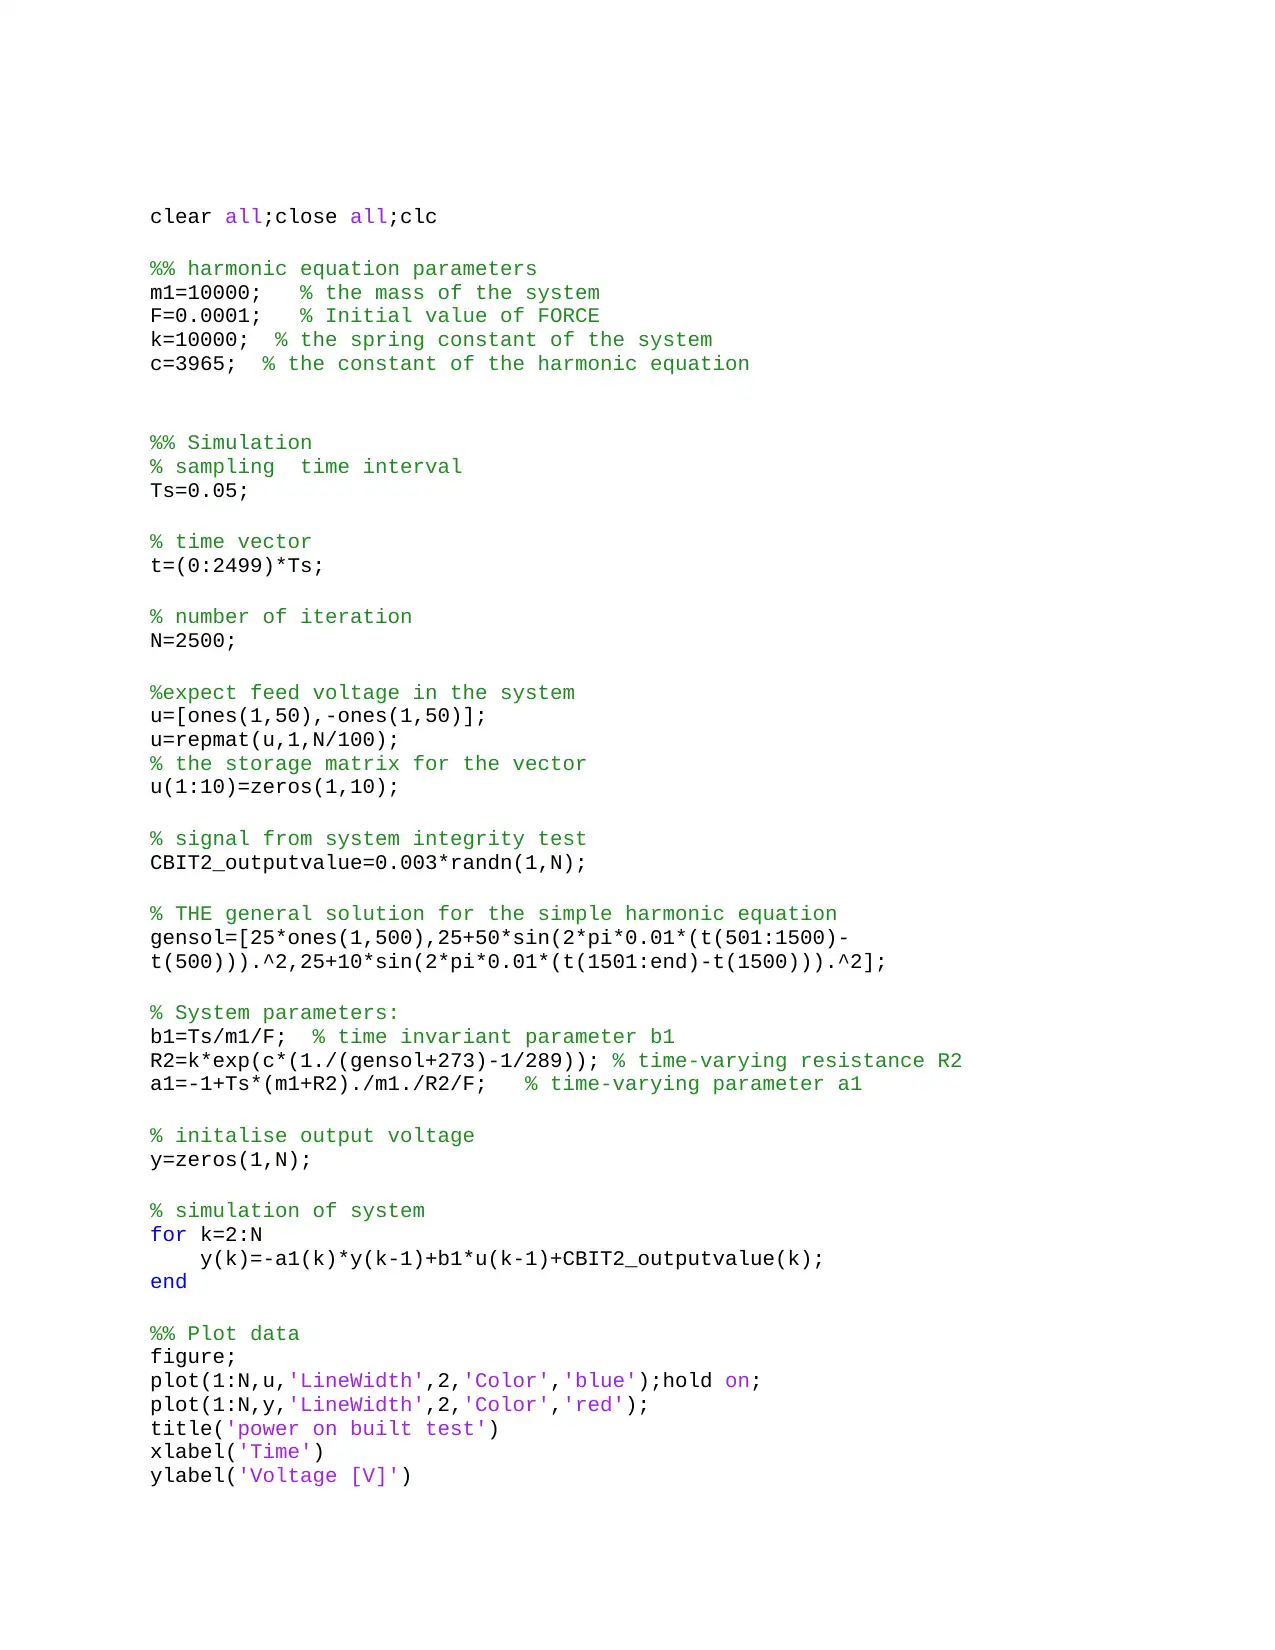
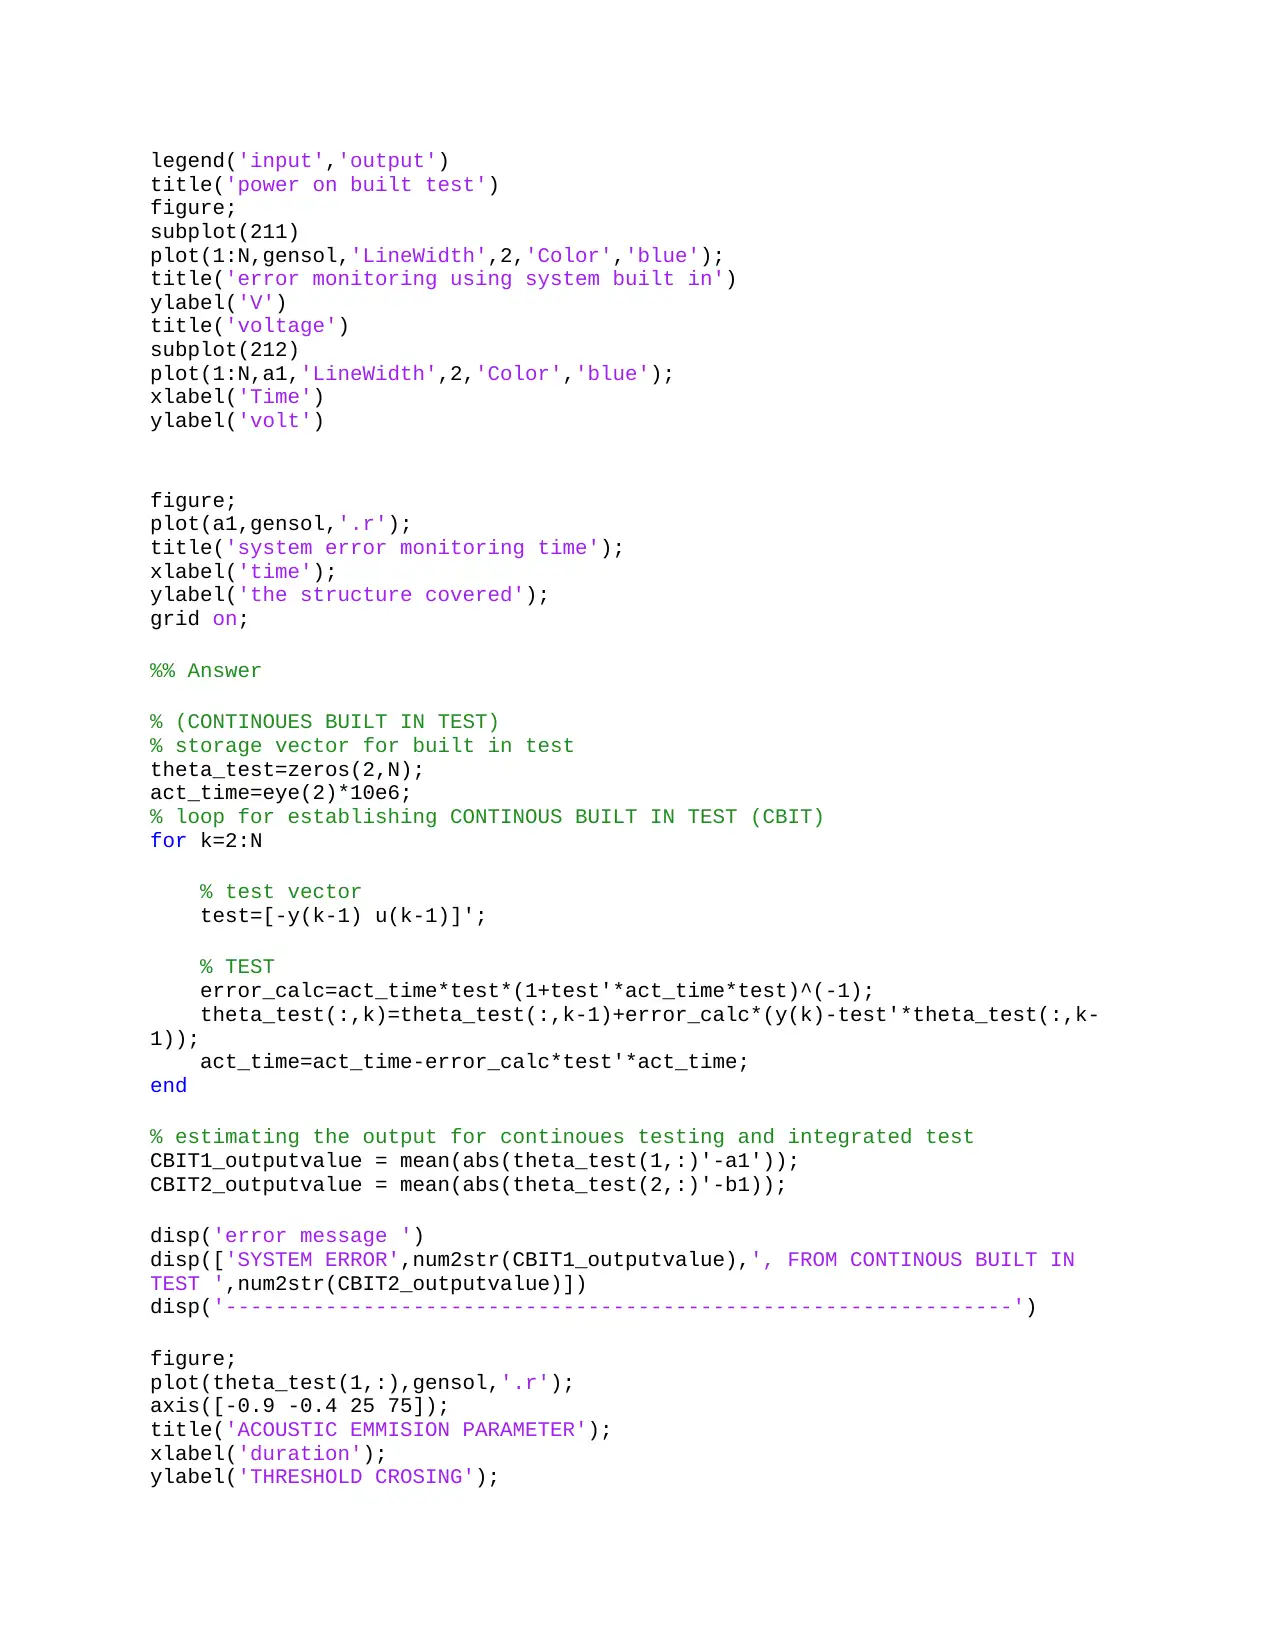
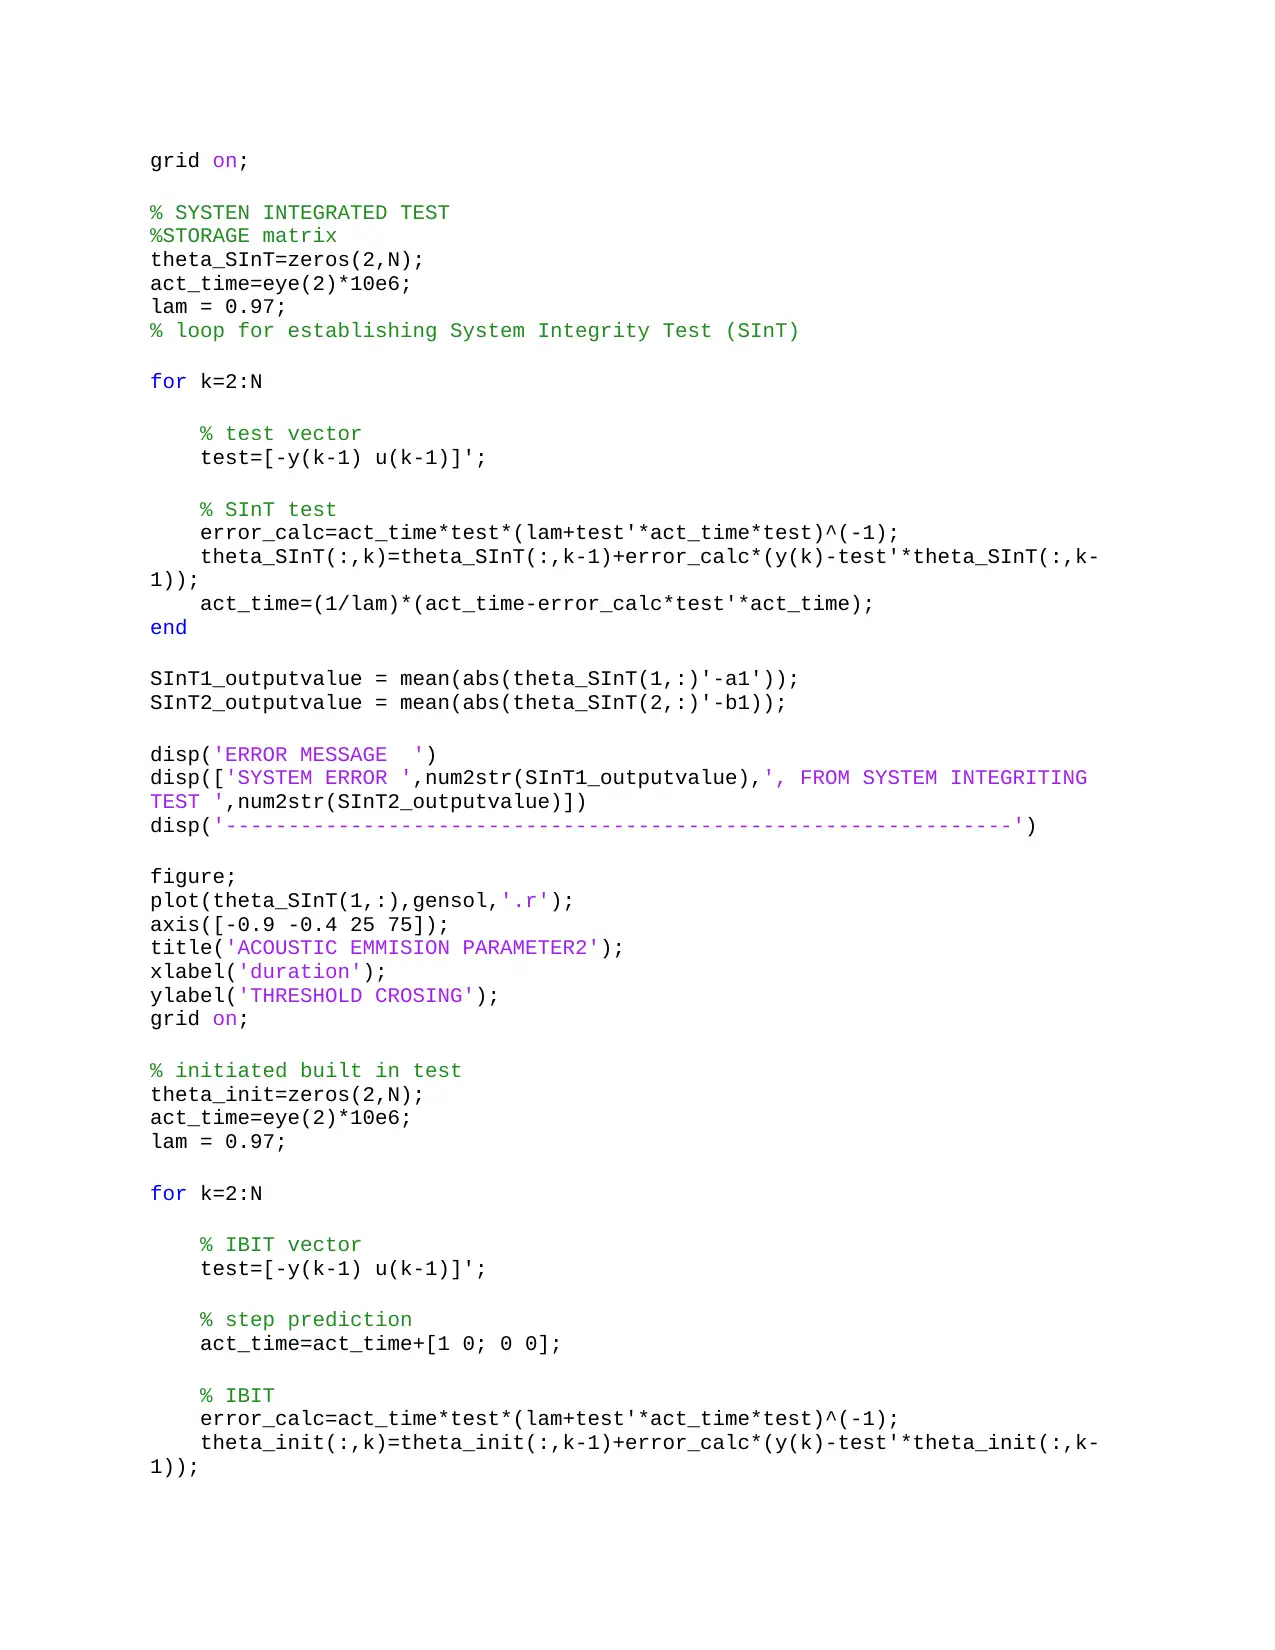
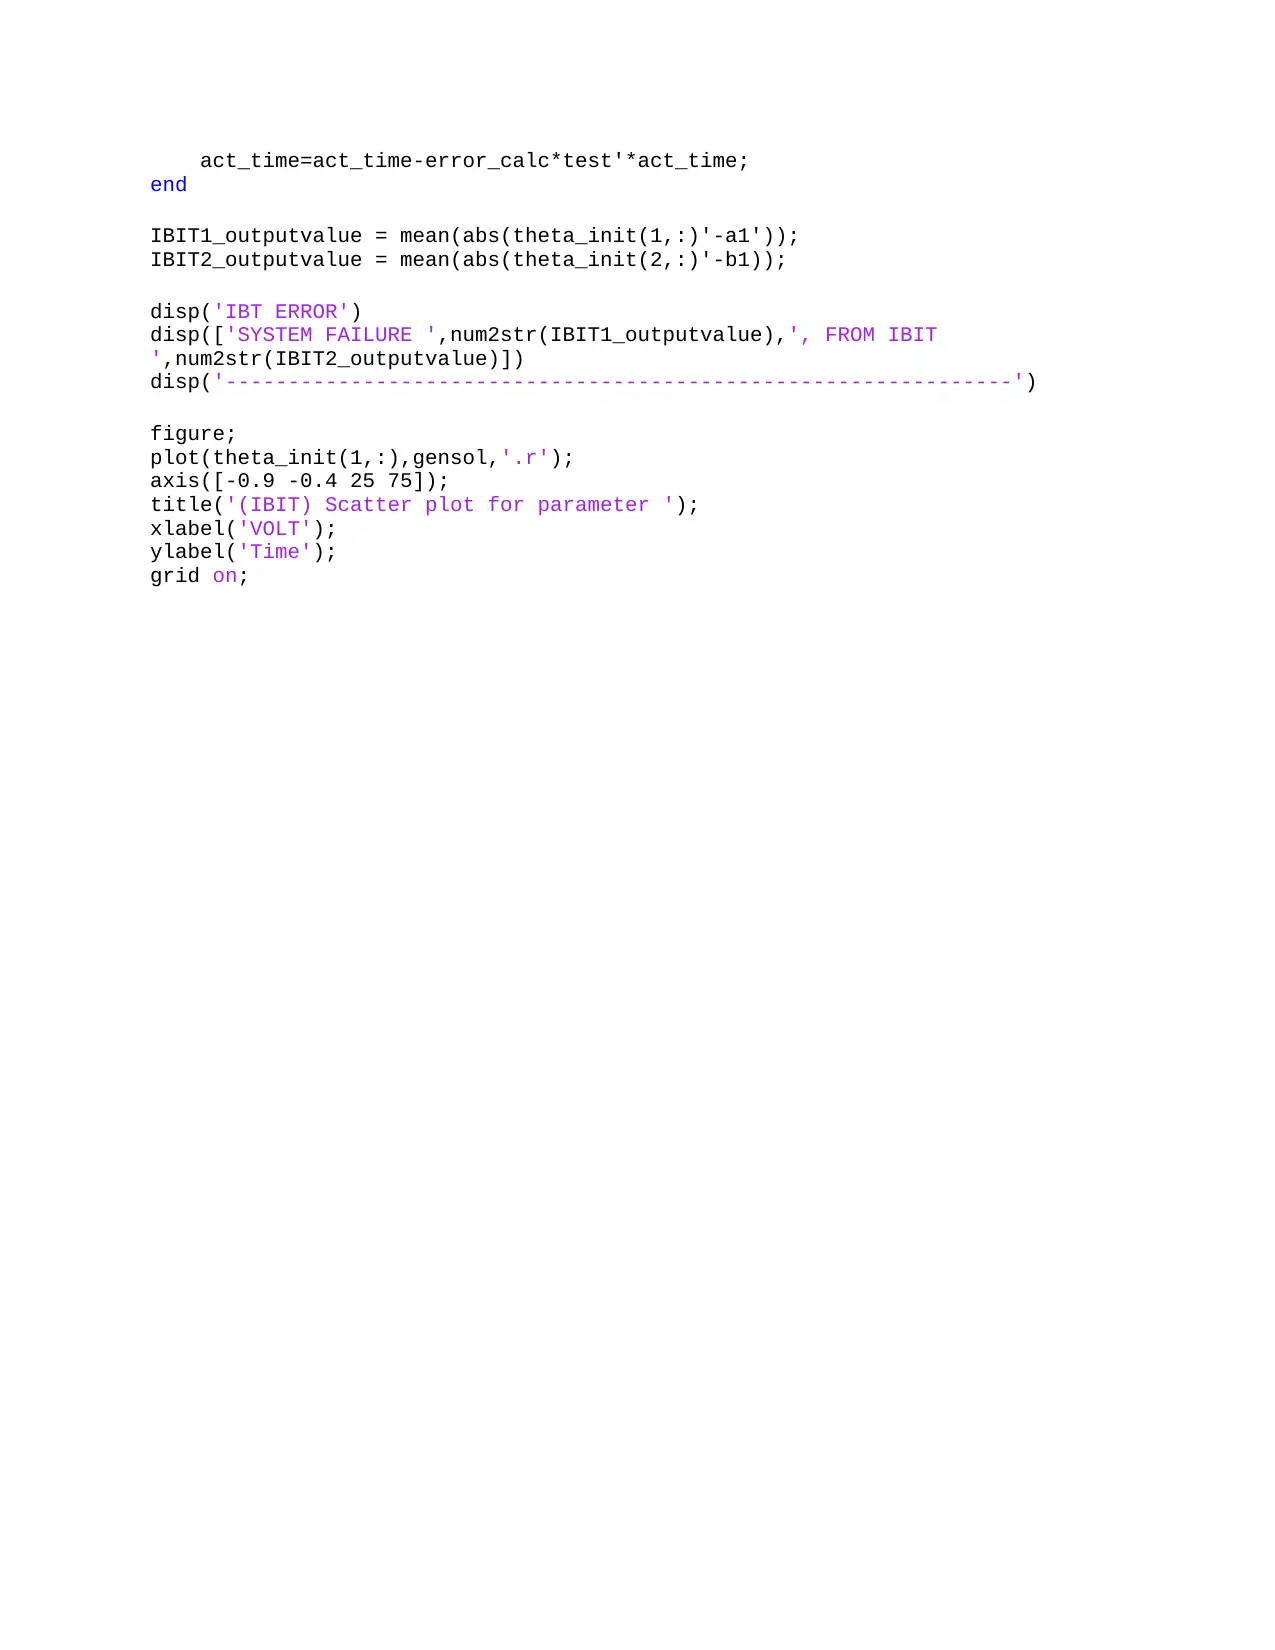
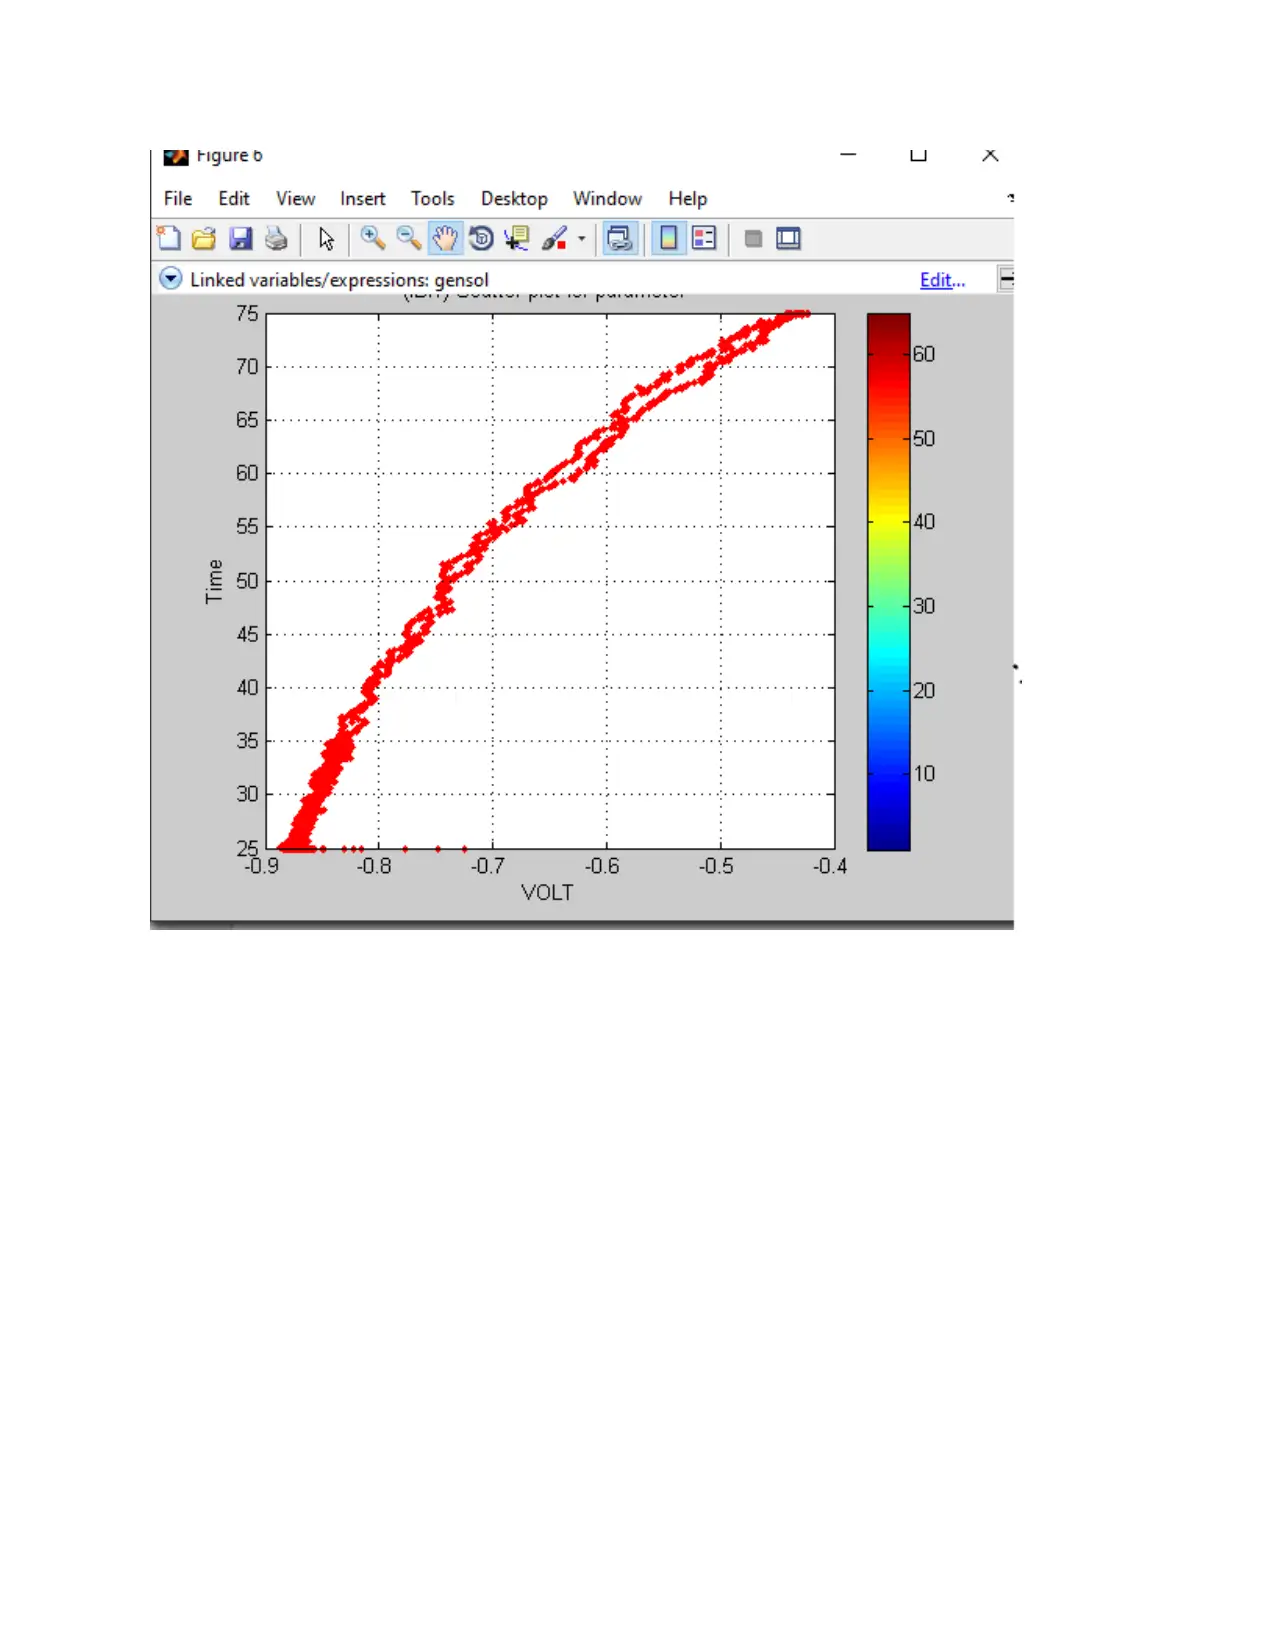
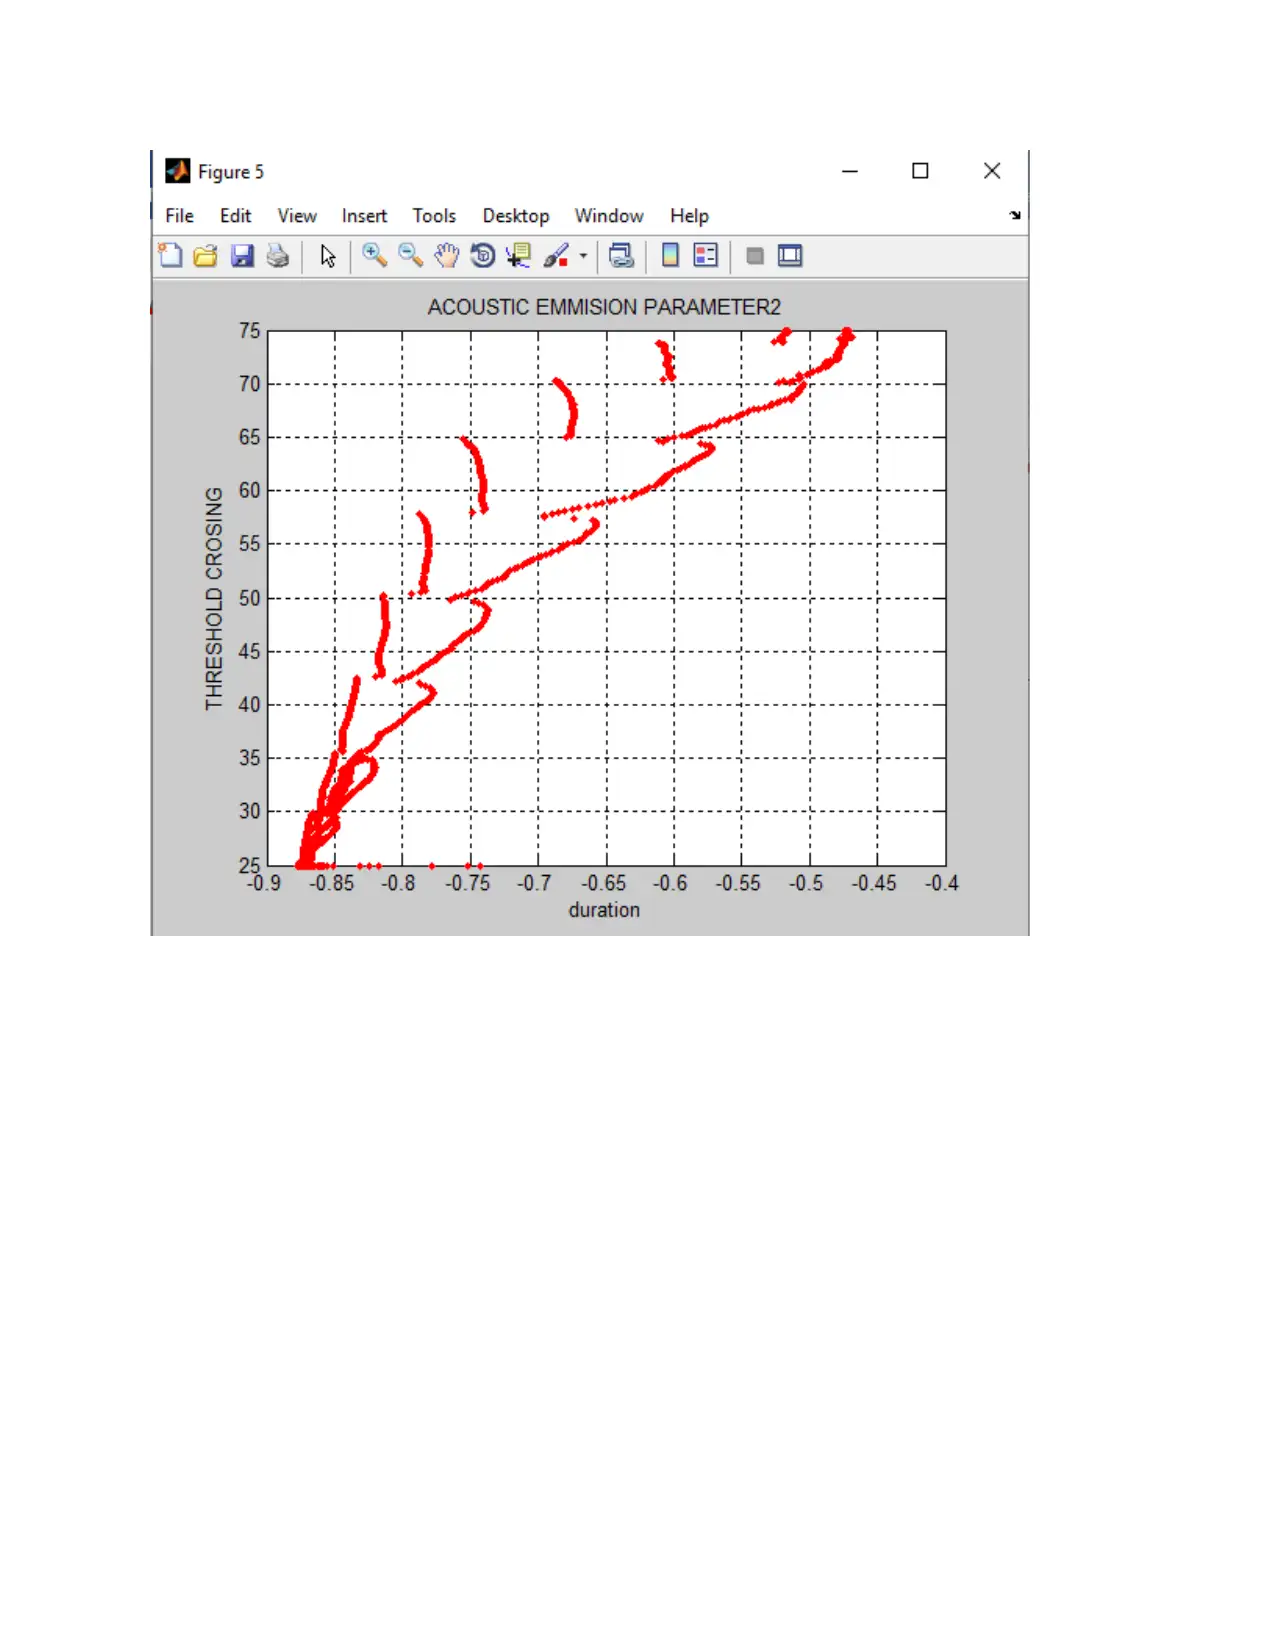
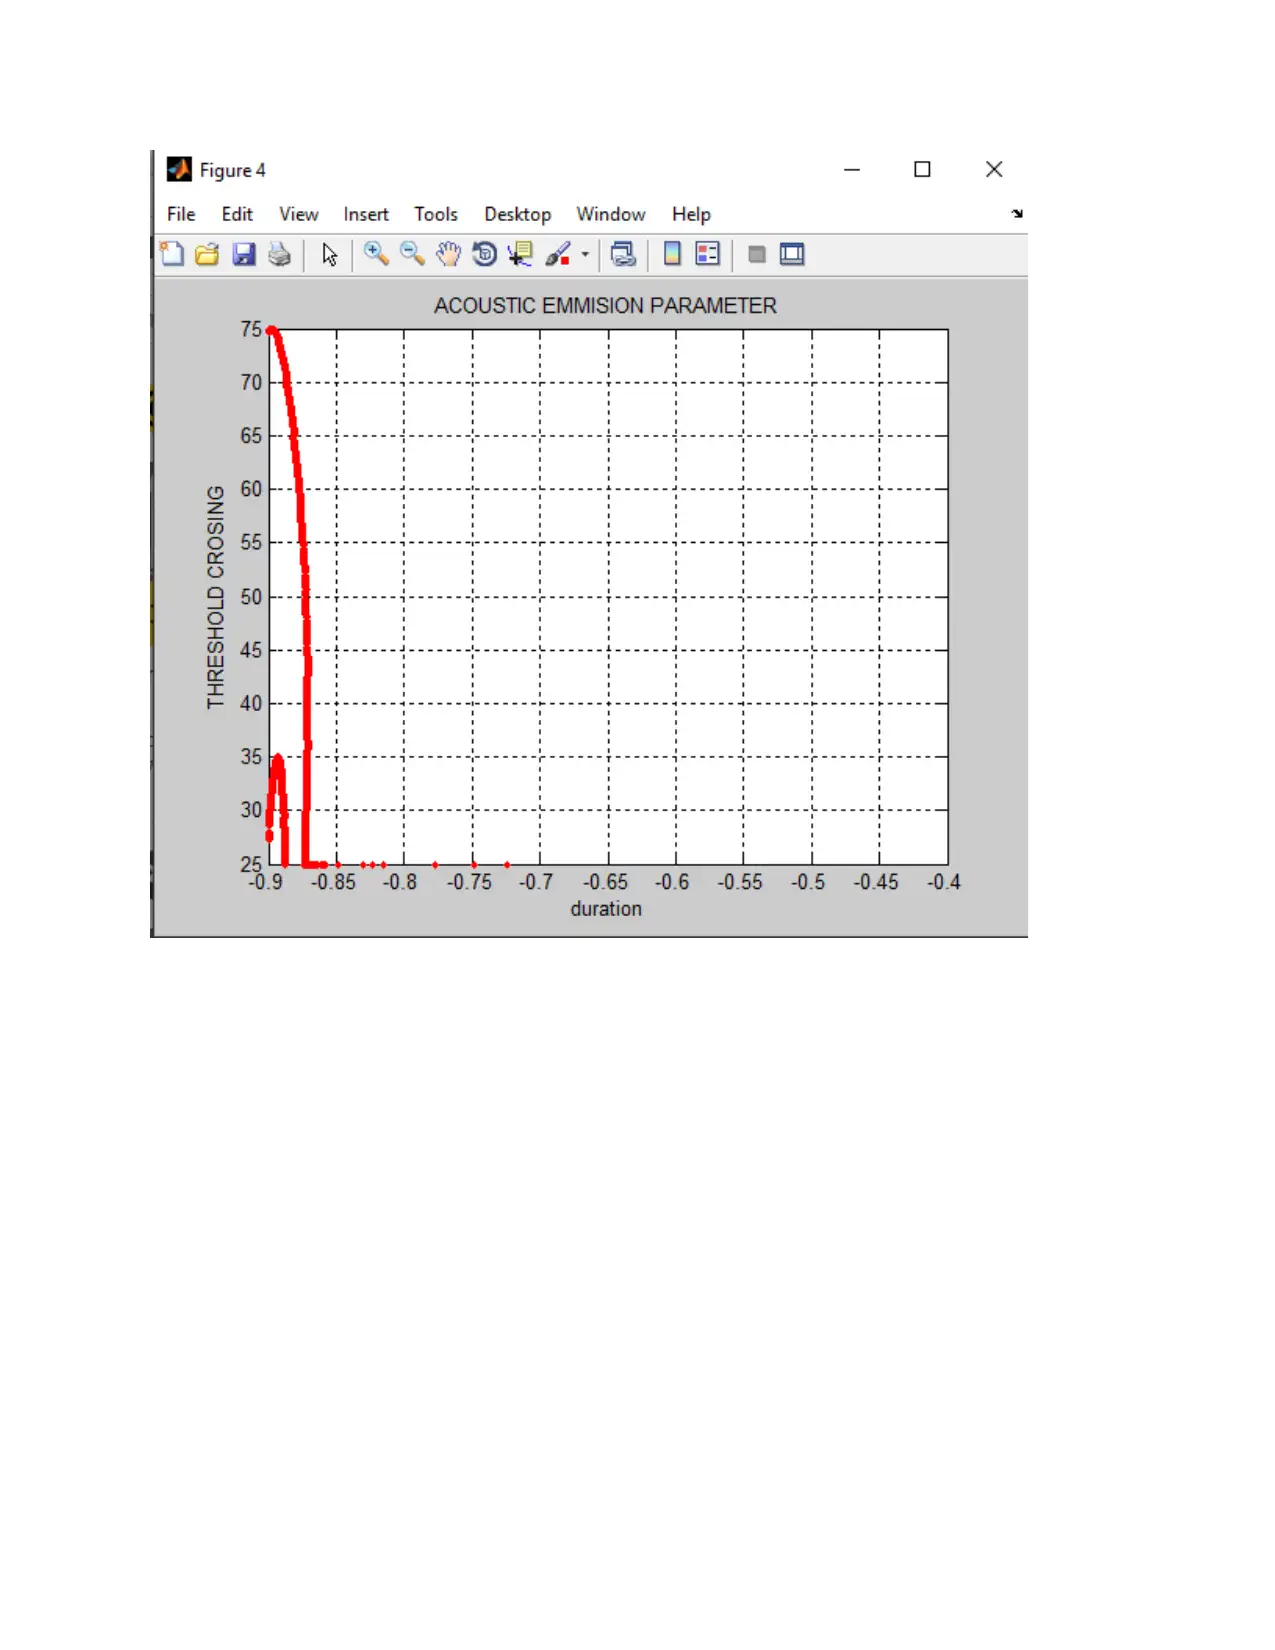
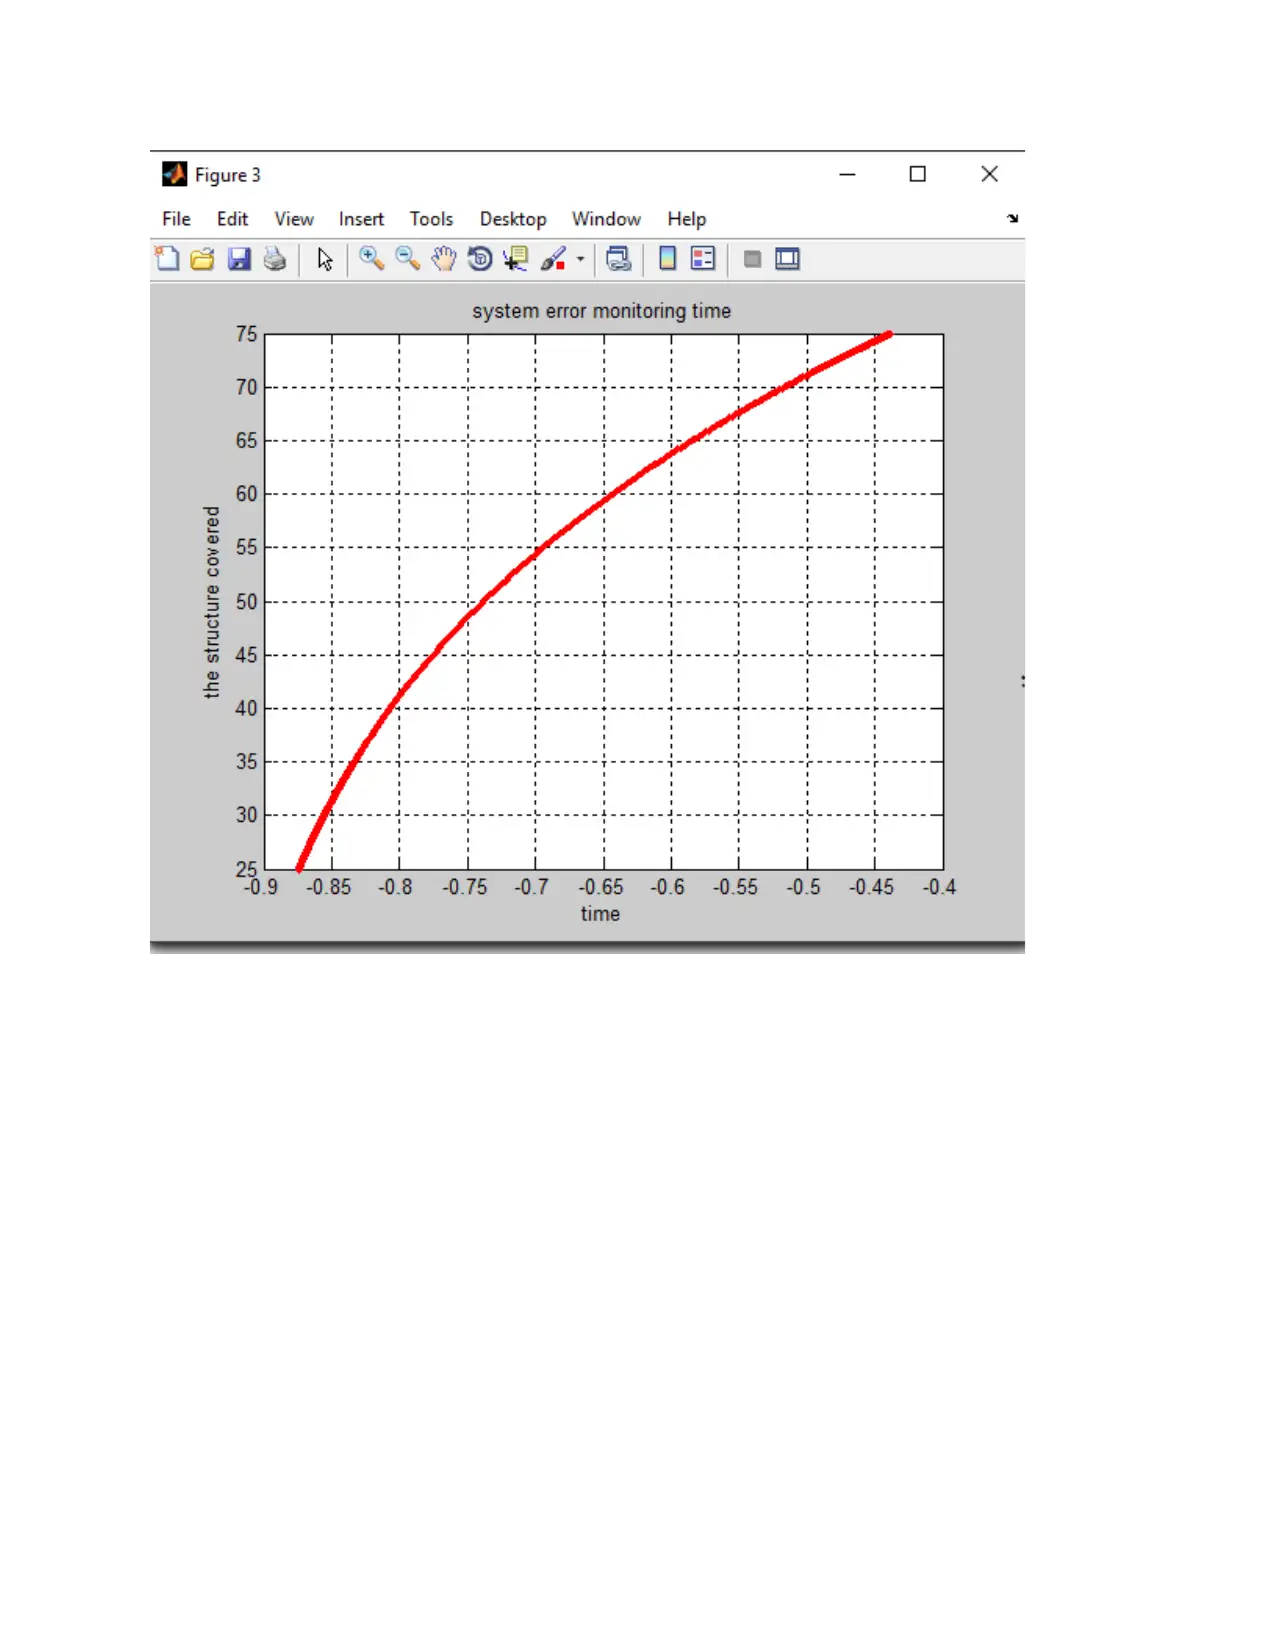
This student project outlines a method for verifying the integrity and reliability of health monitoring systems, particularly within the aviation industry. It focuses on ensuring the reliability of recorded data as the industry becomes more dependent on these systems. The design incorporates Power-On Built-In Test (PBIT), Continuous Built-In Test (CBIT), Initiated Built-In Test (IBIT), and a System Integrity Test (SInT) to validate system integrity against lost data, invalid signals, or threshold exceedances. The project includes MATLAB code for simulating and testing the system, along with analysis of acoustic emission parameters and system error monitoring. The results of the CBIT, SInT, and IBIT tests are displayed, providing insights into system performance and potential failure points.

clear all;close all;clc
%% harmonic equation parameters
m1=10000; % the mass of the system
F=0.0001; % Initial value of FORCE
k=10000; % the spring constant of the system
c=3965; % the constant of the harmonic equation
%% Simulation
% sampling time interval
Ts=0.05;
% time vector
t=(0:2499)*Ts;
% number of iteration
N=2500;
%expect feed voltage in the system
u=[ones(1,50),-ones(1,50)];
u=repmat(u,1,N/100);
% the storage matrix for the vector
u(1:10)=zeros(1,10);
% signal from system integrity test
CBIT2_outputvalue=0.003*randn(1,N);
% THE general solution for the simple harmonic equation
gensol=[25*ones(1,500),25+50*sin(2*pi*0.01*(t(501:1500)-
t(500))).^2,25+10*sin(2*pi*0.01*(t(1501:end)-t(1500))).^2];
% System parameters:
b1=Ts/m1/F; % time invariant parameter b1
R2=k*exp(c*(1./(gensol+273)-1/289)); % time-varying resistance R2
a1=-1+Ts*(m1+R2)./m1./R2/F; % time-varying parameter a1
% initalise output voltage
y=zeros(1,N);
% simulation of system
for k=2:N
y(k)=-a1(k)*y(k-1)+b1*u(k-1)+CBIT2_outputvalue(k);
end
%% Plot data
figure;
plot(1:N,u,'LineWidth',2,'Color','blue');hold on;
plot(1:N,y,'LineWidth',2,'Color','red');
title('power on built test')
xlabel('Time')
ylabel('Voltage [V]')
Paraphrase This Document
Need a fresh take? Get an instant paraphrase of this document with our AI Paraphraser

legend('input','output')
title('power on built test')
figure;
subplot(211)
plot(1:N,gensol,'LineWidth',2,'Color','blue');
title('error monitoring using system built in')
ylabel('V')
title('voltage')
subplot(212)
plot(1:N,a1,'LineWidth',2,'Color','blue');
xlabel('Time')
ylabel('volt')
figure;
plot(a1,gensol,'.r');
title('system error monitoring time');
xlabel('time');
ylabel('the structure covered');
grid on;
%% Answer
% (CONTINOUES BUILT IN TEST)
% storage vector for built in test
theta_test=zeros(2,N);
act_time=eye(2)*10e6;
% loop for establishing CONTINOUS BUILT IN TEST (CBIT)
for k=2:N
% test vector
test=[-y(k-1) u(k-1)]';
% TEST
error_calc=act_time*test*(1+test'*act_time*test)^(-1);
theta_test(:,k)=theta_test(:,k-1)+error_calc*(y(k)-test'*theta_test(:,k-
1));
act_time=act_time-error_calc*test'*act_time;
end
% estimating the output for continoues testing and integrated test
CBIT1_outputvalue = mean(abs(theta_test(1,:)'-a1'));
CBIT2_outputvalue = mean(abs(theta_test(2,:)'-b1));
disp('error message ')
disp(['SYSTEM ERROR',num2str(CBIT1_outputvalue),', FROM CONTINOUS BUILT IN
TEST ',num2str(CBIT2_outputvalue)])
disp('---------------------------------------------------------------')
figure;
plot(theta_test(1,:),gensol,'.r');
axis([-0.9 -0.4 25 75]);
title('ACOUSTIC EMMISION PARAMETER');
xlabel('duration');
ylabel('THRESHOLD CROSING');

grid on;
% SYSTEN INTEGRATED TEST
%STORAGE matrix
theta_SInT=zeros(2,N);
act_time=eye(2)*10e6;
lam = 0.97;
% loop for establishing System Integrity Test (SInT)
for k=2:N
% test vector
test=[-y(k-1) u(k-1)]';
% SInT test
error_calc=act_time*test*(lam+test'*act_time*test)^(-1);
theta_SInT(:,k)=theta_SInT(:,k-1)+error_calc*(y(k)-test'*theta_SInT(:,k-
1));
act_time=(1/lam)*(act_time-error_calc*test'*act_time);
end
SInT1_outputvalue = mean(abs(theta_SInT(1,:)'-a1'));
SInT2_outputvalue = mean(abs(theta_SInT(2,:)'-b1));
disp('ERROR MESSAGE ')
disp(['SYSTEM ERROR ',num2str(SInT1_outputvalue),', FROM SYSTEM INTEGRITING
TEST ',num2str(SInT2_outputvalue)])
disp('---------------------------------------------------------------')
figure;
plot(theta_SInT(1,:),gensol,'.r');
axis([-0.9 -0.4 25 75]);
title('ACOUSTIC EMMISION PARAMETER2');
xlabel('duration');
ylabel('THRESHOLD CROSING');
grid on;
% initiated built in test
theta_init=zeros(2,N);
act_time=eye(2)*10e6;
lam = 0.97;
for k=2:N
% IBIT vector
test=[-y(k-1) u(k-1)]';
% step prediction
act_time=act_time+[1 0; 0 0];
% IBIT
error_calc=act_time*test*(lam+test'*act_time*test)^(-1);
theta_init(:,k)=theta_init(:,k-1)+error_calc*(y(k)-test'*theta_init(:,k-
1));
⊘ This is a preview!⊘
Do you want full access?
Subscribe today to unlock all pages.

Trusted by 1+ million students worldwide

act_time=act_time-error_calc*test'*act_time;
end
IBIT1_outputvalue = mean(abs(theta_init(1,:)'-a1'));
IBIT2_outputvalue = mean(abs(theta_init(2,:)'-b1));
disp('IBT ERROR')
disp(['SYSTEM FAILURE ',num2str(IBIT1_outputvalue),', FROM IBIT
',num2str(IBIT2_outputvalue)])
disp('---------------------------------------------------------------')
figure;
plot(theta_init(1,:),gensol,'.r');
axis([-0.9 -0.4 25 75]);
title('(IBIT) Scatter plot for parameter ');
xlabel('VOLT');
ylabel('Time');
grid on;
Paraphrase This Document
Need a fresh take? Get an instant paraphrase of this document with our AI Paraphraser


⊘ This is a preview!⊘
Do you want full access?
Subscribe today to unlock all pages.

Trusted by 1+ million students worldwide

Paraphrase This Document
Need a fresh take? Get an instant paraphrase of this document with our AI Paraphraser


⊘ This is a preview!⊘
Do you want full access?
Subscribe today to unlock all pages.

Trusted by 1+ million students worldwide
1 out of 9

Your All-in-One AI-Powered Toolkit for Academic Success.
 +13062052269
info@desklib.com
Available 24*7 on WhatsApp / Email
Unlock your academic potential
Copyright © 2020–2025 A2Z Services. All Rights Reserved. Developed and managed by ZUCOL.