Shop Sales Data Analysis Using SPSS: Examining Profit by Category

Verified

Added on  2023/06/05

|132
|13543
|320
Homework Assignment
AI Summary
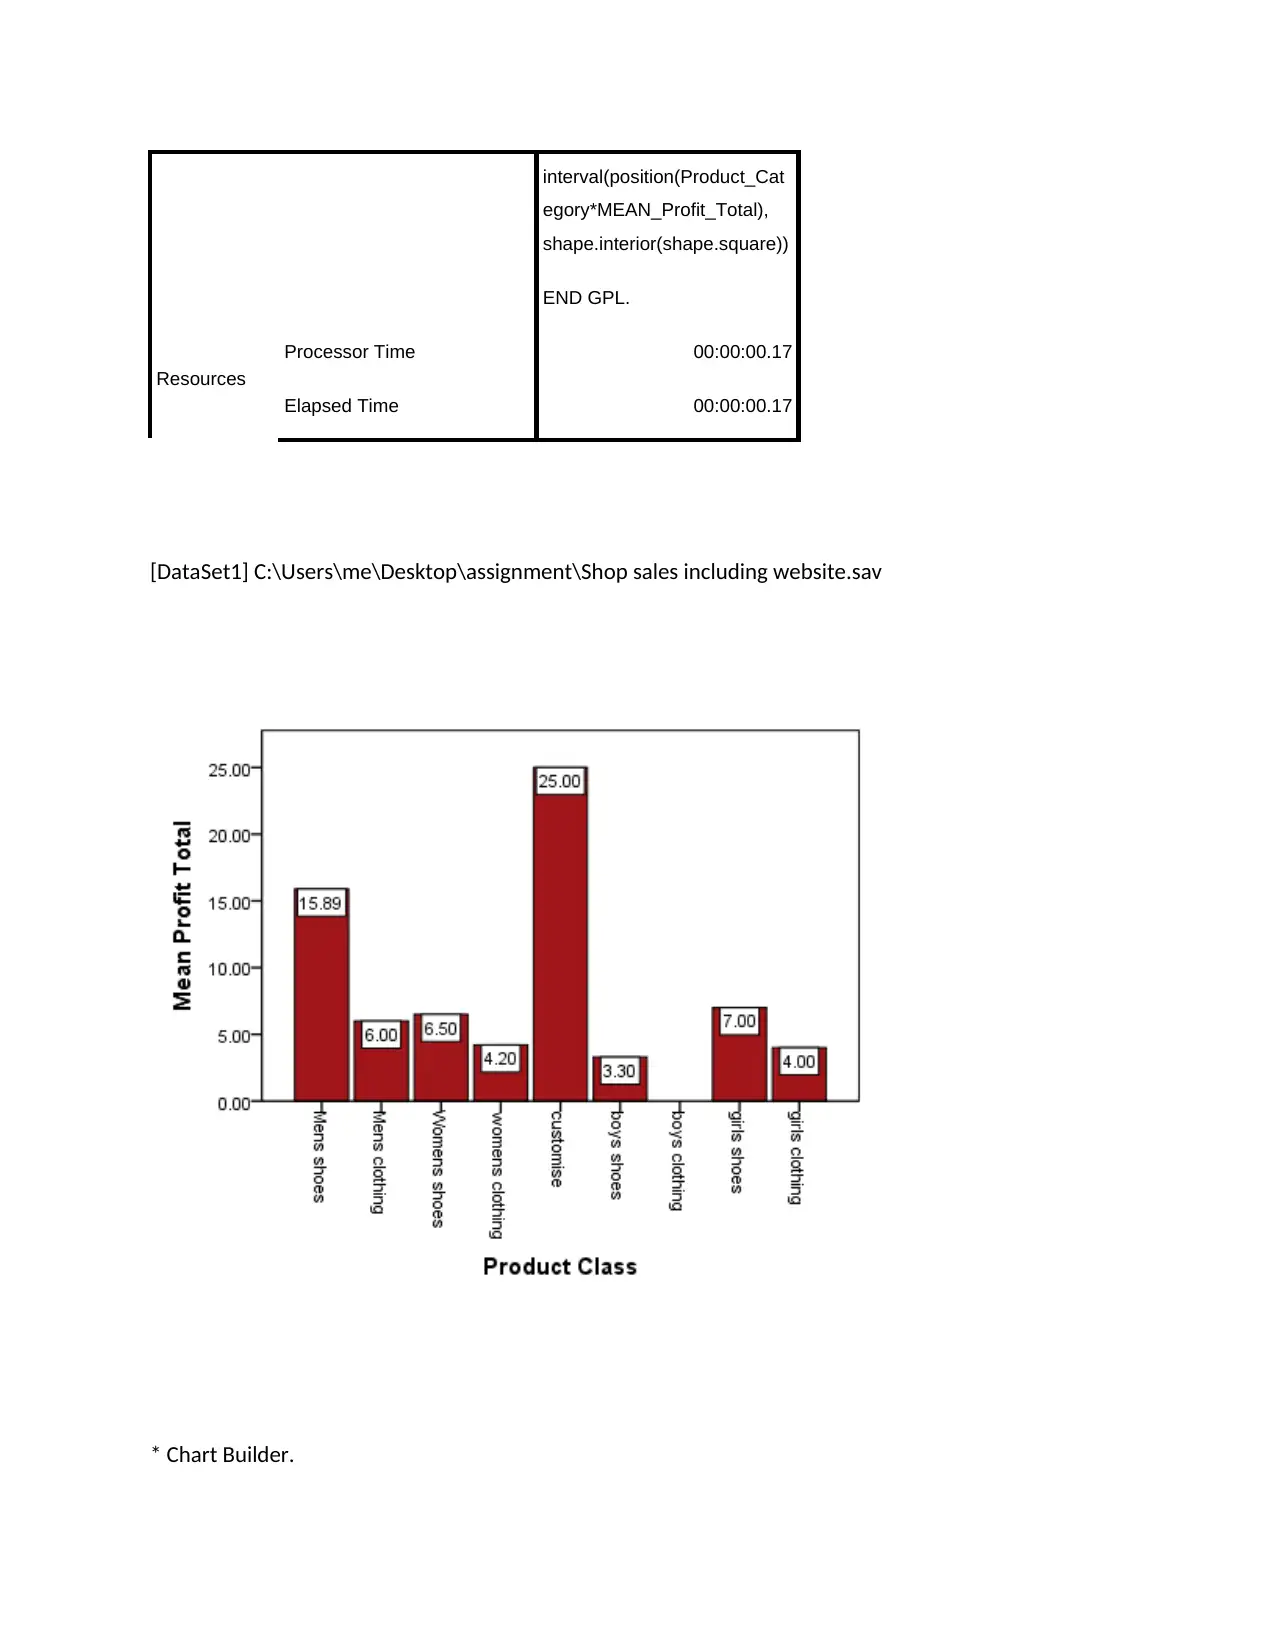
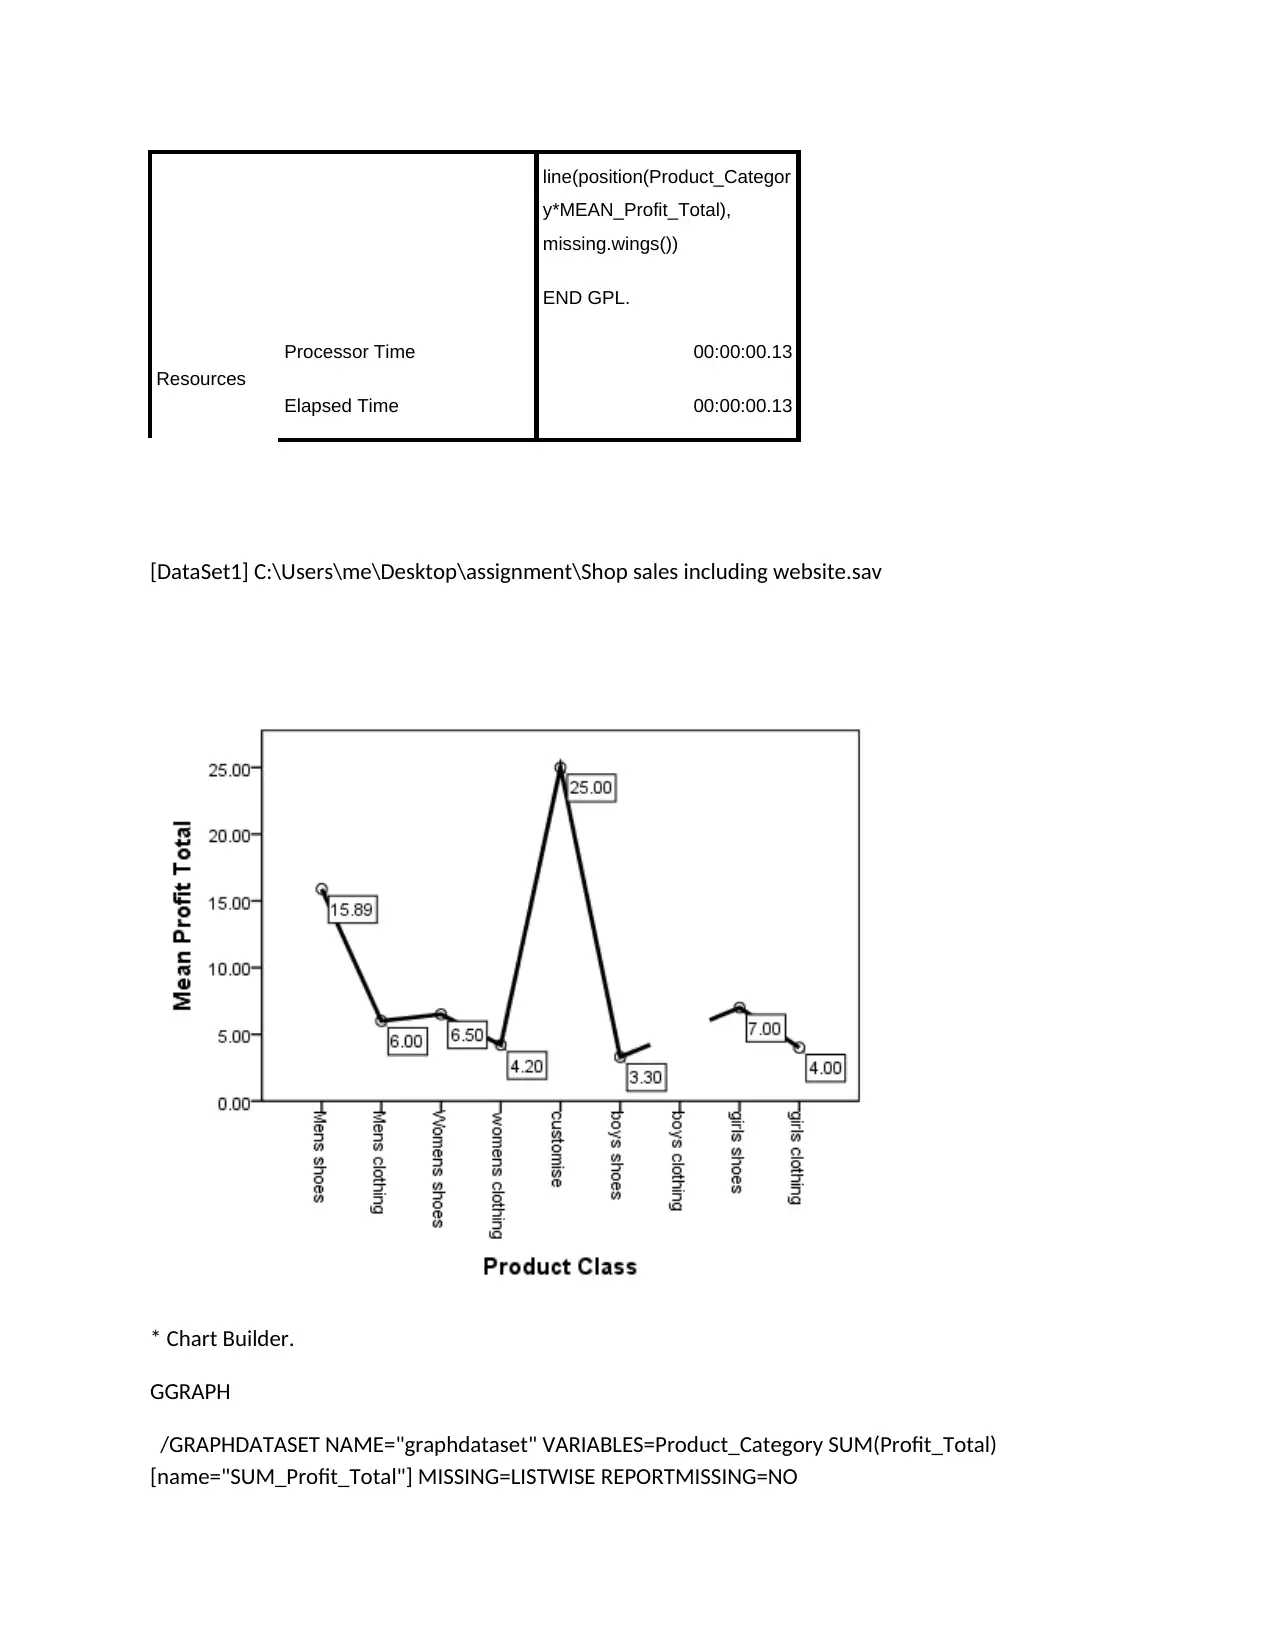
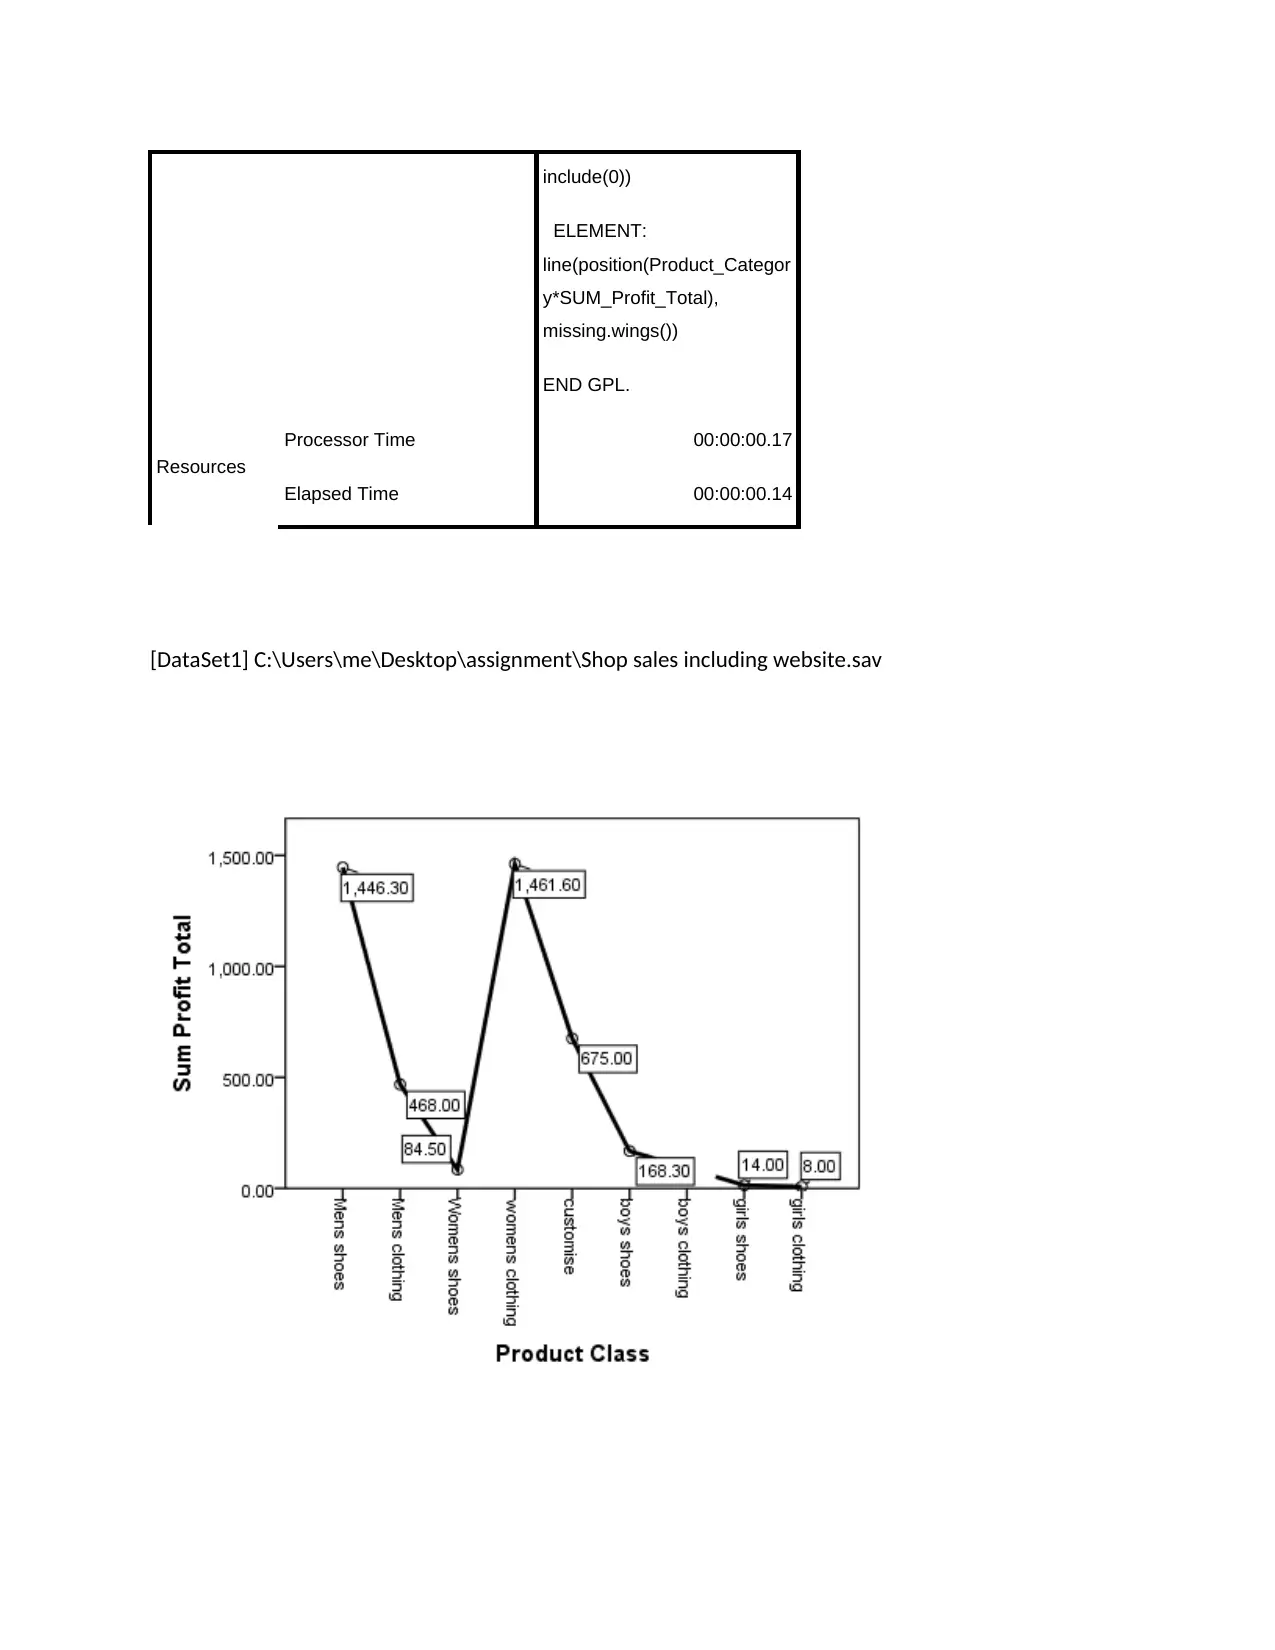
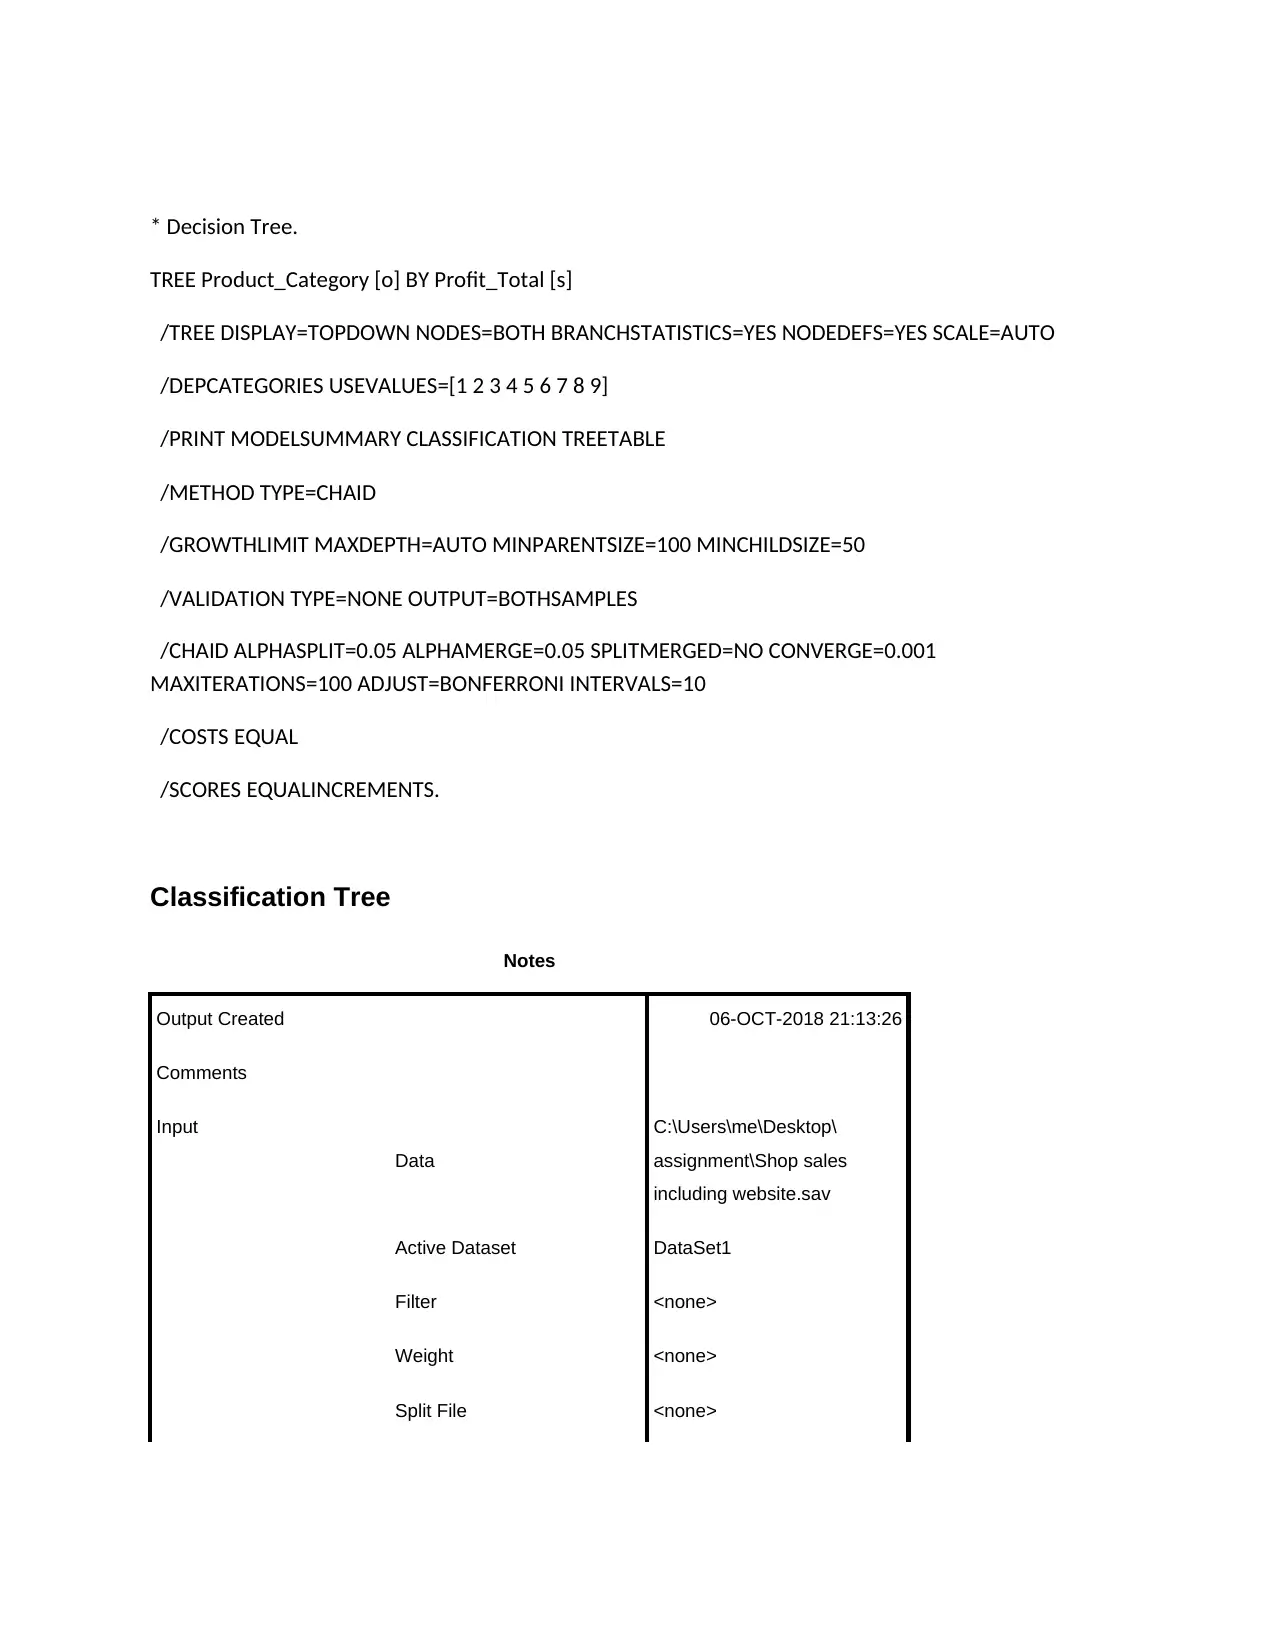
This assignment demonstrates the analysis of shop sales data using SPSS, focusing on the relationship between product categories and profit totals. The analysis includes the use of GGRAPH to create visualizations such as bar charts and line graphs illustrating mean and sum of profit for each product category. Additionally, a decision tree is constructed to predict product categories based on profit totals, and ONEWAY ANOVA is performed to compare the means of profit totals across different product categories, with post-hoc tests (Tukey HSD) to identify significant differences. The analysis provides descriptive statistics, tests for homogeneity of variances, and multiple comparisons to gain a comprehensive understanding of the factors influencing shop sales and profitability. The document also includes syntax and notes generated by SPSS during the analysis process.
Document Page
Appendix
* Chart Builder.
GGRAPH
/GRAPHDATASET NAME="graphdataset" VARIABLES=Product_Category MEAN(Profit_Total)
[name="MEAN_Profit_Total"] MISSING=LISTWISE REPORTMISSING=NO
/GRAPHSPEC SOURCE=INLINE.
BEGIN GPL
SOURCE: s=userSource(id("graphdataset"))
DATA: Product_Category=col(source(s), name("Product_Category"), unit.category())
DATA: MEAN_Profit_Total=col(source(s), name("MEAN_Profit_Total"))
GUIDE: axis(dim(1), label("Product Class"))
GUIDE: axis(dim(2), label("Mean Profit Total"))
SCALE: cat(dim(1), include("1", "2", "3", "4", "5", "6", "7", "8", "9"))
SCALE: linear(dim(2), include(0))
ELEMENT: interval(position(Product_Category*MEAN_Profit_Total), shape.interior(shape.square))
END GPL.
tabler-icon-diamond-filled.svg

Paraphrase This Document

Need a fresh take? Get an instant paraphrase of this document with our AI Paraphraser
Document Page
GGraph
Notes
Output Created 06-OCT-2018 20:57:41
Comments
Input
Data
C:\Users\me\Desktop\
assignment\Shop sales
including website.sav
Active Dataset DataSet1
Filter <none>
Weight <none>
Split File <none>
N of Rows in Working Data
File 1034
Notes
Document Page
Syntax GGRAPH
/GRAPHDATASET
NAME="graphdataset"
VARIABLES=Product_Categ
ory MEAN(Profit_Total)
[name="MEAN_Profit_Total"]
MISSING=LISTWISE
REPORTMISSING=NO
/GRAPHSPEC
SOURCE=INLINE.
BEGIN GPL
SOURCE:
s=userSource(id("graphdatas
et"))
DATA:
Product_Category=col(source
(s),
name("Product_Category"),
unit.category())
DATA:
MEAN_Profit_Total=col(sourc
e(s),
name("MEAN_Profit_Total"))
GUIDE: axis(dim(1),
label("Product Class"))
GUIDE: axis(dim(2),
label("Mean Profit Total"))
SCALE: cat(dim(1),
include("1", "2", "3", "4", "5",
"6", "7", "8", "9"))
SCALE: linear(dim(2),
include(0))
ELEMENT:
Document Page
interval(position(Product_Cat
egory*MEAN_Profit_Total),
shape.interior(shape.square))
END GPL.
Resources
Processor Time 00:00:00.17
Elapsed Time 00:00:00.17
[DataSet1] C:\Users\me\Desktop\assignment\Shop sales including website.sav
* Chart Builder.
tabler-icon-diamond-filled.svg

Paraphrase This Document

Need a fresh take? Get an instant paraphrase of this document with our AI Paraphraser
Document Page
GGRAPH
/GRAPHDATASET NAME="graphdataset" VARIABLES=Product_Category MEAN(Profit_Total)
[name="MEAN_Profit_Total"] MISSING=LISTWISE REPORTMISSING=NO
/GRAPHSPEC SOURCE=INLINE.
BEGIN GPL
SOURCE: s=userSource(id("graphdataset"))
DATA: Product_Category=col(source(s), name("Product_Category"), unit.category())
DATA: MEAN_Profit_Total=col(source(s), name("MEAN_Profit_Total"))
GUIDE: axis(dim(1), label("Product Class"))
GUIDE: axis(dim(2), label("Mean Profit Total"))
SCALE: cat(dim(1), include("1", "2", "3", "4", "5", "6", "7", "8", "9"))
SCALE: linear(dim(2), include(0))
ELEMENT: line(position(Product_Category*MEAN_Profit_Total), missing.wings())
END GPL.
GGraph
Notes
Output Created 06-OCT-2018 21:03:07
Comments
Input
Data
C:\Users\me\Desktop\
assignment\Shop sales
including website.sav
Active Dataset DataSet1
Filter <none>
Weight <none>
Split File <none>
Document Page
N of Rows in Working Data
File 1034
Document Page
Syntax GGRAPH
/GRAPHDATASET
NAME="graphdataset"
VARIABLES=Product_Categ
ory MEAN(Profit_Total)
[name="MEAN_Profit_Total"]
MISSING=LISTWISE
REPORTMISSING=NO
/GRAPHSPEC
SOURCE=INLINE.
BEGIN GPL
SOURCE:
s=userSource(id("graphdatas
et"))
DATA:
Product_Category=col(source
(s),
name("Product_Category"),
unit.category())
DATA:
MEAN_Profit_Total=col(sourc
e(s),
name("MEAN_Profit_Total"))
GUIDE: axis(dim(1),
label("Product Class"))
GUIDE: axis(dim(2),
label("Mean Profit Total"))
SCALE: cat(dim(1),
include("1", "2", "3", "4", "5",
"6", "7", "8", "9"))
SCALE: linear(dim(2),
include(0))
ELEMENT:
tabler-icon-diamond-filled.svg

Paraphrase This Document

Need a fresh take? Get an instant paraphrase of this document with our AI Paraphraser
Document Page
line(position(Product_Categor
y*MEAN_Profit_Total),
missing.wings())
END GPL.
Resources
Processor Time 00:00:00.13
Elapsed Time 00:00:00.13
[DataSet1] C:\Users\me\Desktop\assignment\Shop sales including website.sav
* Chart Builder.
GGRAPH
/GRAPHDATASET NAME="graphdataset" VARIABLES=Product_Category SUM(Profit_Total)
[name="SUM_Profit_Total"] MISSING=LISTWISE REPORTMISSING=NO
Document Page
/GRAPHSPEC SOURCE=INLINE.
BEGIN GPL
SOURCE: s=userSource(id("graphdataset"))
DATA: Product_Category=col(source(s), name("Product_Category"), unit.category())
DATA: SUM_Profit_Total=col(source(s), name("SUM_Profit_Total"))
GUIDE: axis(dim(1), label("Product Class"))
GUIDE: axis(dim(2), label("Sum Profit Total"))
SCALE: cat(dim(1), include("1", "2", "3", "4", "5", "6", "7", "8", "9"))
SCALE: linear(dim(2), include(0))
ELEMENT: line(position(Product_Category*SUM_Profit_Total), missing.wings())
END GPL.
GGraph
Notes
Output Created 06-OCT-2018 21:05:22
Comments
Input
Data
C:\Users\me\Desktop\
assignment\Shop sales
including website.sav
Active Dataset DataSet1
Filter <none>
Weight <none>
Split File <none>
N of Rows in Working Data
File 1034
Document Page
Notes
Syntax GGRAPH
/GRAPHDATASET
NAME="graphdataset"
VARIABLES=Product_Categ
ory SUM(Profit_Total)
[name="SUM_Profit_Total"]
MISSING=LISTWISE
REPORTMISSING=NO
/GRAPHSPEC
SOURCE=INLINE.
BEGIN GPL
SOURCE:
s=userSource(id("graphdatas
et"))
DATA:
Product_Category=col(source
(s),
name("Product_Category"),
unit.category())
DATA:
SUM_Profit_Total=col(source
(s),
name("SUM_Profit_Total"))
GUIDE: axis(dim(1),
label("Product Class"))
GUIDE: axis(dim(2),
label("Sum Profit Total"))
SCALE: cat(dim(1),
include("1", "2", "3", "4", "5",
"6", "7", "8", "9"))
SCALE: linear(dim(2),
tabler-icon-diamond-filled.svg

Paraphrase This Document

Need a fresh take? Get an instant paraphrase of this document with our AI Paraphraser
Document Page
include(0))
ELEMENT:
line(position(Product_Categor
y*SUM_Profit_Total),
missing.wings())
END GPL.
Resources
Processor Time 00:00:00.17
Elapsed Time 00:00:00.14
[DataSet1] C:\Users\me\Desktop\assignment\Shop sales including website.sav
Document Page
* Decision Tree.
TREE Product_Category [o] BY Profit_Total [s]
/TREE DISPLAY=TOPDOWN NODES=BOTH BRANCHSTATISTICS=YES NODEDEFS=YES SCALE=AUTO
/DEPCATEGORIES USEVALUES=[1 2 3 4 5 6 7 8 9]
/PRINT MODELSUMMARY CLASSIFICATION TREETABLE
/METHOD TYPE=CHAID
/GROWTHLIMIT MAXDEPTH=AUTO MINPARENTSIZE=100 MINCHILDSIZE=50
/VALIDATION TYPE=NONE OUTPUT=BOTHSAMPLES
/CHAID ALPHASPLIT=0.05 ALPHAMERGE=0.05 SPLITMERGED=NO CONVERGE=0.001
MAXITERATIONS=100 ADJUST=BONFERRONI INTERVALS=10
/COSTS EQUAL
/SCORES EQUALINCREMENTS.
Classification Tree
Notes
Output Created 06-OCT-2018 21:13:26
Comments
Input
Data
C:\Users\me\Desktop\
assignment\Shop sales
including website.sav
Active Dataset DataSet1
Filter <none>
Weight <none>
Split File <none>
chevron_up_icon
1 out of 132
circle_padding
hide_on_mobile
zoom_out_icon
[object Object]