Kaplan Business School: MBA504 Data Analytics Case Study - Showpo
VerifiedAdded on 2020/04/01
|14
|3090
|109
Case Study
AI Summary
This case study analyzes Showpo, an online fashion retailer, using data analytics. The assignment, part of the MBA504 Data Analysis, Problem Solving and Digital Operations course, examines Showpo's business operations and customer engagement. It explores revenue trends, expenses, and asset management through dashboard analysis using data from 2003 to 2016. The analysis identifies strengths, weaknesses, and opportunities for improvement, focusing on maximizing data utilization to enhance customer experience and increase revenue. The paper includes visualizations and discusses fluctuations in revenue, costs, and liabilities, aiming to provide actionable insights for Showpo's strategic development. The student uses the theories and tools of Data Analytics to deliver an analysis of a company on how to improve its operations and consequently its revenue.
ASSIGNMENT 2 – Data Analytics Case Study
MBA504 DATA ANALYSIS, PROBLEM SOLVING AND DIGITAL
OPERATIONS
125623
JULIANA
AUGUSTO VISNADI
JUJUVISNADI@GMAIL.COM
Your assignment should meet ALL the following requirements:
(Please confirm by ticking each item before submitting your assignment)
☒ Section above has been filled out correctly
☒ Assignment is in an easy to read, 11 pt font, arial font, with 1.5 spacing
☒ Assignment is referenced properly (in-text and end-text references)
☒ Pages are numbered
☒ Declaration below is completed and signed
☒ I have kept a copy of this assignment
ALL FORMS OF PLAGIARISM AND UNAUTHORISED COLLUSION are regarded as serious
academic misconduct by Kaplan Business School and may result in penalties, including failure of
the unit and possible disciplinary action. If you are in doubt, consult your Le cturer.
WORD COUNT: words
9/18/2017 12:00:00 AM
Paraphrase This Document
Need a fresh take? Get an instant paraphrase of this document with our AI Paraphraser
125623 Juliana Augusto Visnadi
Contents
1. Introduction.....................................................................................................................3
2. Case study......................................................................................................................3
3. Research goals..............................................................................................................4
4. Dashboard analysis of data set...................................................................................4
5. Weakness.....................................................................................................................10
6. Improvement opportunities........................................................................................11
REFERENCES.................................................................................................................13
2
jujuvisnadi@gmail.com
125623 Juliana Augusto Visnadi
1. Introduction
This paper aims to deliver an analysis of a company on how to improve its
operations and consequently its revenue using theories and tools of Data
Analytics. As part of the assessment of the subject MBA504 Data Analysis,
Problem Solving and Digital Operations, it will be start introducing the company
chosen to be analysed, an overview of its market and costumer engagement
approach, further, it will be shown possible inefficiencies identified in the
company’s strategy when using data to engage costumers and, also, it will be
made an attempt to recommend techniques covered in the subject to develop the
business.
2. Case study
Presenting the company (story and currently situation)
SHOWPO – online shop, female clothes, shoes and accessories.
Showpo was a result of an entrepreneurship dream which came true for
the founder of the company, Jane Lu. Jane Lu quit her cubicle job and wanted to
try her hand in the art of entrepreneurship (Morrison, 2015). Her first venture
failed drastically and a month later she came up with the idea of Showpo. The
company was founded from the garage of Jane L’s parent in the year 2010. She
had started the company with a single laptop and two shelves of clothes which
has now grown to company who is catering to over 80 countries around the world
(Showpo.com, 2017). Showpo now has a social following of over 2.8 million
3
jujuvisnadi@gmail.com
⊘ This is a preview!⊘
Do you want full access?
Subscribe today to unlock all pages.
Trusted by 1+ million students worldwide
125623 Juliana Augusto Visnadi
people. Jane Lu has won several awards over the years for her contribution to the
field of entrepreneurship. She was determined which helped her to build a highly
passionate and skilled team who share the same belief as her. The company
sells women’s clothes shoes and accessories which are in high demand in the
world. Her being a lady helps in understanding the mindset of the other women
around the world.
3. Research goals
Having understood the story of Showpo, its target costumers and how
currently they operate this great success online business, the questions are “Is
Showpo maximising the use of the data available?” and “Is it possible to Showpo
improve its costumer experience and increase customers using data analysis?”.
Firstly, one of the hypotheses to be considered is that being a young
business, the company is still developing maturity and infra-structure to deal with
all the information gathered from current and potential customers that visit the
website. Thus, it is supposed that that company still have to keep optimising the
usage of the data accumulated in order to anticipate future sales offering products
and deals assertively.
4. Dashboard analysis of data set
A small dashboard has been created using a data set which stores the
following information
1. Year
4
jujuvisnadi@gmail.com
Paraphrase This Document
Need a fresh take? Get an instant paraphrase of this document with our AI Paraphraser
125623 Juliana Augusto Visnadi
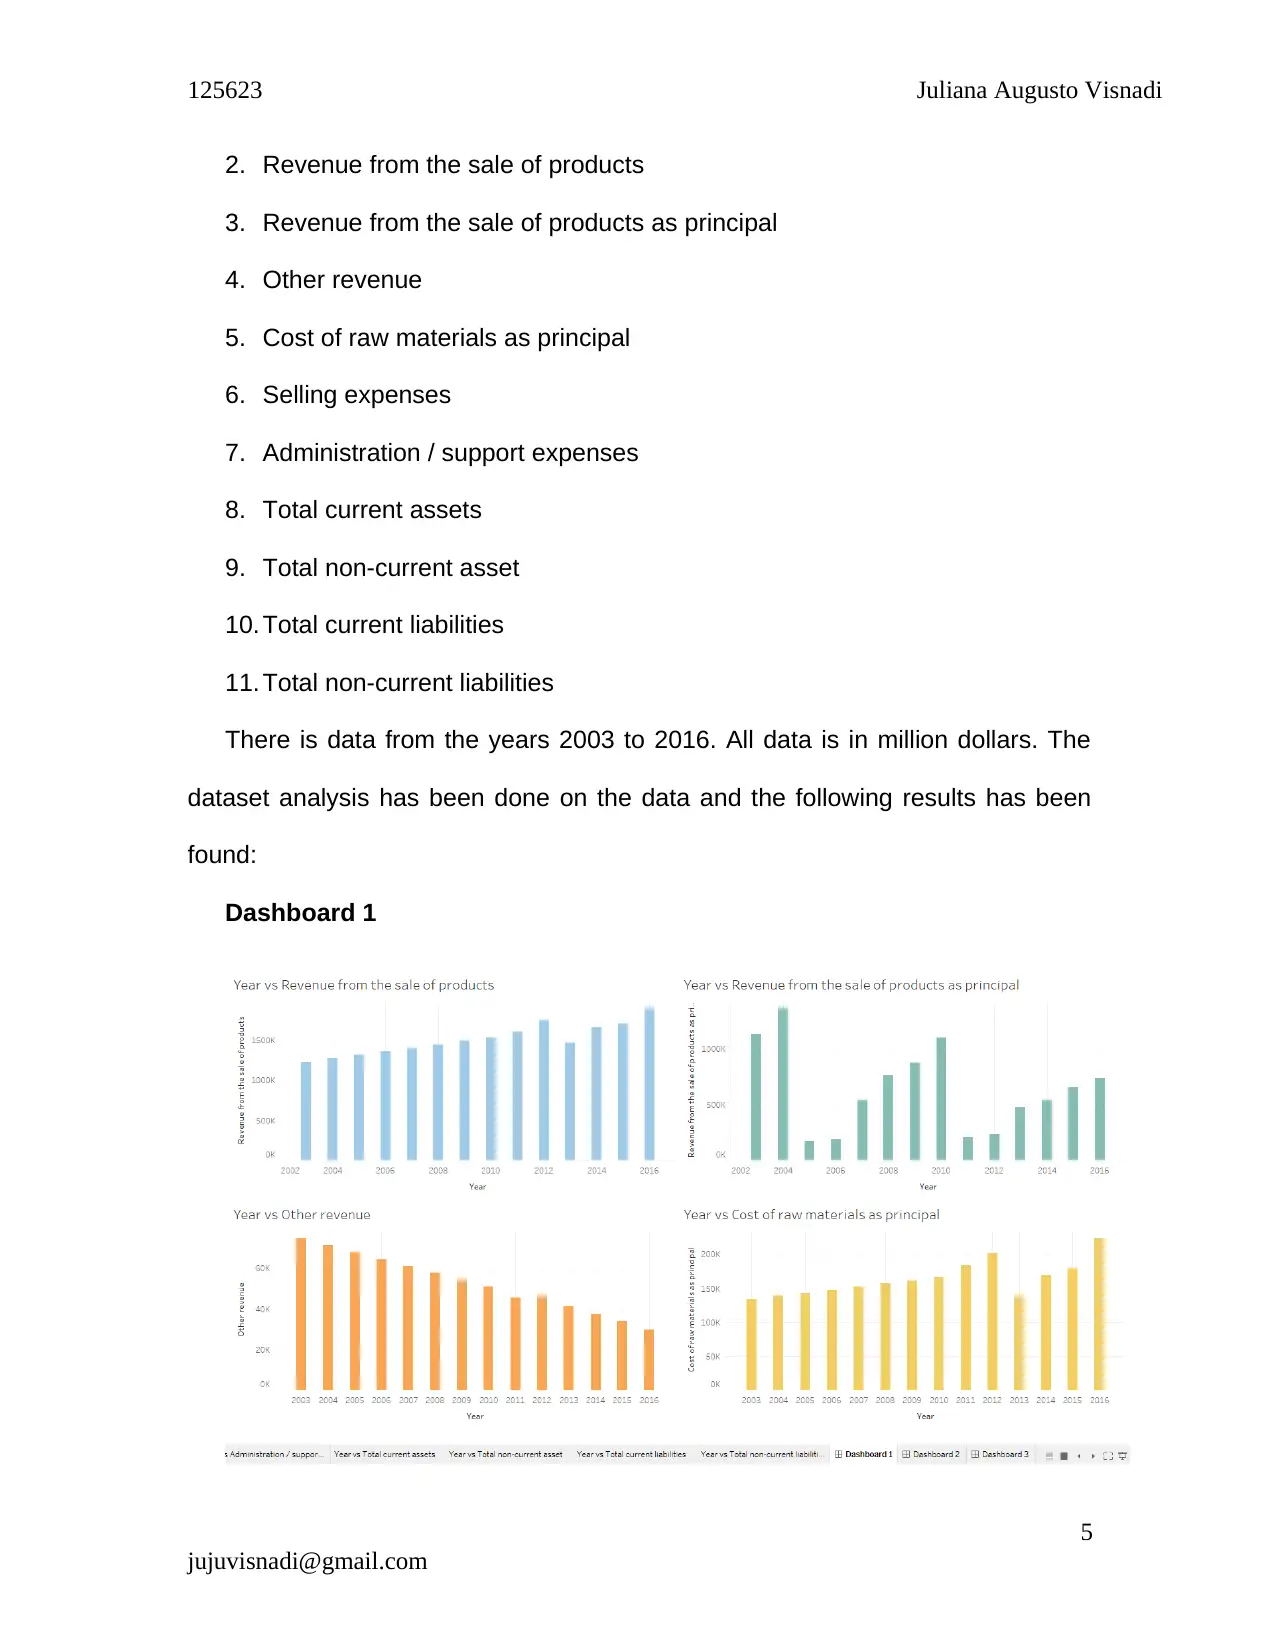
2. Revenue from the sale of products
3. Revenue from the sale of products as principal
4. Other revenue
5. Cost of raw materials as principal
6. Selling expenses
7. Administration / support expenses
8. Total current assets
9. Total non-current asset
10. Total current liabilities
11. Total non-current liabilities
There is data from the years 2003 to 2016. All data is in million dollars. The
dataset analysis has been done on the data and the following results has been
found:
Dashboard 1
5
jujuvisnadi@gmail.com
125623 Juliana Augusto Visnadi
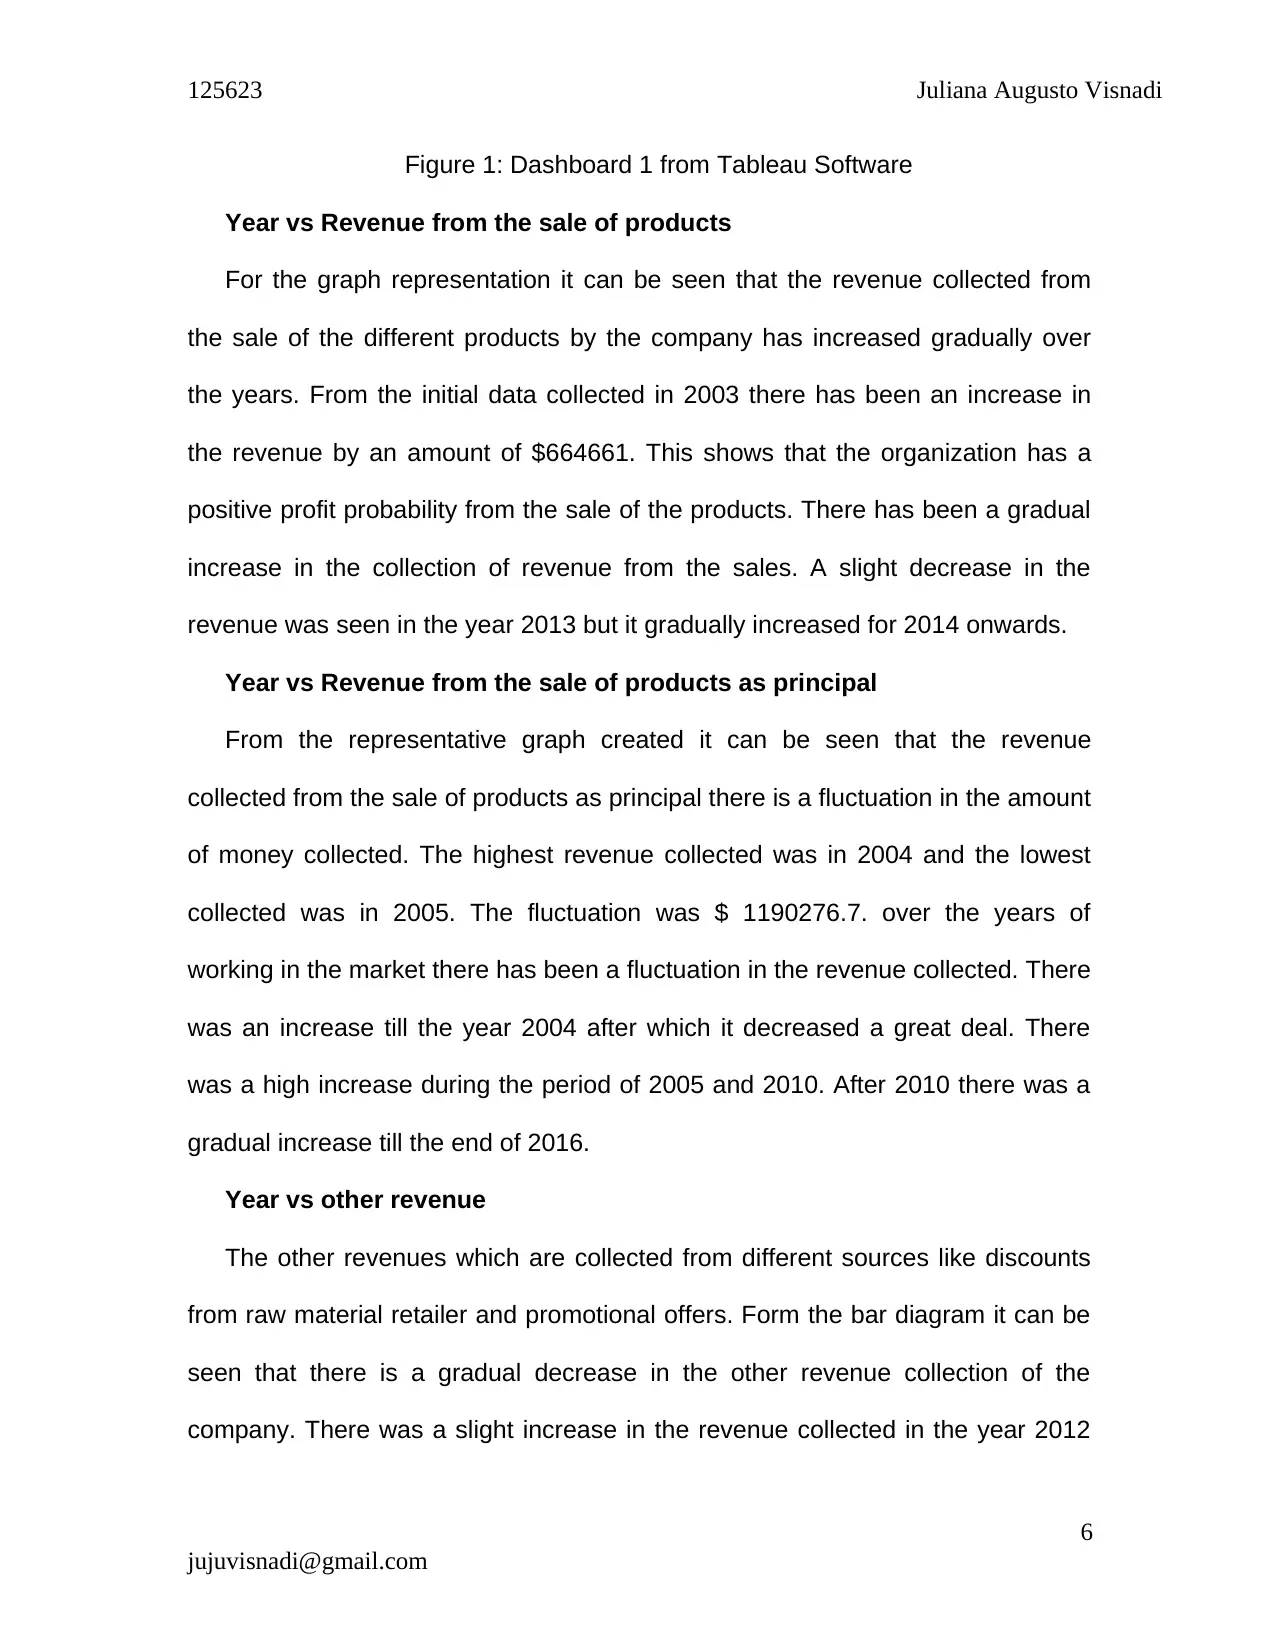
Figure 1: Dashboard 1 from Tableau Software
Year vs Revenue from the sale of products
For the graph representation it can be seen that the revenue collected from
the sale of the different products by the company has increased gradually over
the years. From the initial data collected in 2003 there has been an increase in
the revenue by an amount of $664661. This shows that the organization has a
positive profit probability from the sale of the products. There has been a gradual
increase in the collection of revenue from the sales. A slight decrease in the
revenue was seen in the year 2013 but it gradually increased for 2014 onwards.
Year vs Revenue from the sale of products as principal
From the representative graph created it can be seen that the revenue
collected from the sale of products as principal there is a fluctuation in the amount
of money collected. The highest revenue collected was in 2004 and the lowest
collected was in 2005. The fluctuation was $ 1190276.7. over the years of
working in the market there has been a fluctuation in the revenue collected. There
was an increase till the year 2004 after which it decreased a great deal. There
was a high increase during the period of 2005 and 2010. After 2010 there was a
gradual increase till the end of 2016.
Year vs other revenue
The other revenues which are collected from different sources like discounts
from raw material retailer and promotional offers. Form the bar diagram it can be
seen that there is a gradual decrease in the other revenue collection of the
company. There was a slight increase in the revenue collected in the year 2012
6
jujuvisnadi@gmail.com
⊘ This is a preview!⊘
Do you want full access?
Subscribe today to unlock all pages.
Trusted by 1+ million students worldwide
125623 Juliana Augusto Visnadi
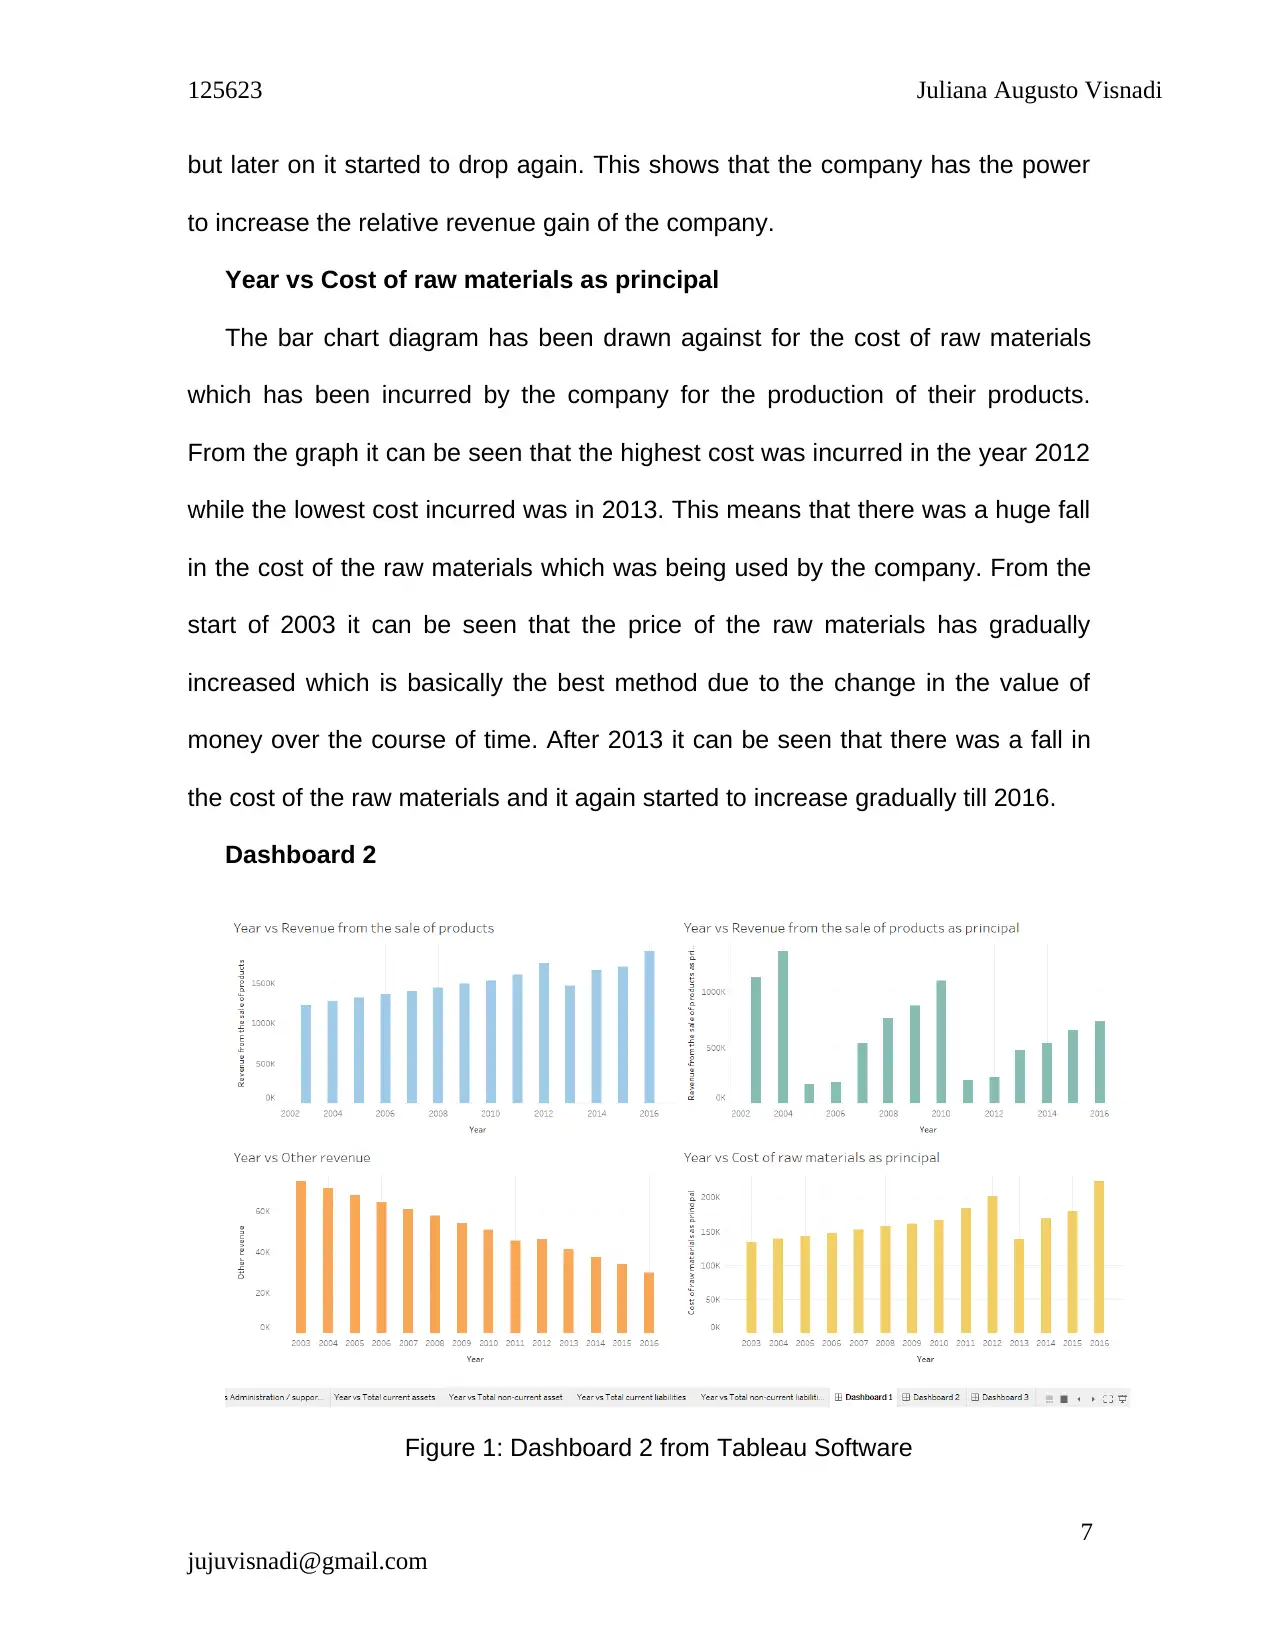
but later on it started to drop again. This shows that the company has the power
to increase the relative revenue gain of the company.
Year vs Cost of raw materials as principal
The bar chart diagram has been drawn against for the cost of raw materials
which has been incurred by the company for the production of their products.
From the graph it can be seen that the highest cost was incurred in the year 2012
while the lowest cost incurred was in 2013. This means that there was a huge fall
in the cost of the raw materials which was being used by the company. From the
start of 2003 it can be seen that the price of the raw materials has gradually
increased which is basically the best method due to the change in the value of
money over the course of time. After 2013 it can be seen that there was a fall in
the cost of the raw materials and it again started to increase gradually till 2016.
Dashboard 2
Figure 1: Dashboard 2 from Tableau Software
7
jujuvisnadi@gmail.com
Paraphrase This Document
Need a fresh take? Get an instant paraphrase of this document with our AI Paraphraser
125623 Juliana Augusto Visnadi
Year vs selling expenses
The cost incurred by the sales department of the organization which includes
the salaries and wages of the sales persons and the employees of the company.
Over the years the company was able to recruit more and more employees and
thus the cost which was to be incurred for the wages of the employees increased.
This can be seen form the graph drawn using the data. The graph shows the
constant rise in the amount of money incurred by the company for the employees
of the organization. Though there can be seen a slight drop in the expenses in the
year 2013 but later on it increased. This might suggest the resigning of the
employees of the organization.
Year vs Administration / support expenses
The salaries and the extra benefits, which the employees require from time to
time during their time at the organization corresponds to the Administration /
support expenses. From the bar chart it can be seen that there is no fixed rise in
the expenses of the employees. It differs from time to time. A steep fall in the
expenses can be seen in the year 2006 and 2013. Apart from that the
corresponding years the values of the expenses increased: 2013 to 2016 or
decreased: 2007 to 2011.
Year vs Total current assets
The term Total current assets refer to the total amount of liquid cash, accounts
and inventory materials and the supplies under process. These assets have a
shorter life span and can get exhausted easily. From the bar chart developed it
can be derived that there has been a constant rise in the amount of money which
8
jujuvisnadi@gmail.com
125623 Juliana Augusto Visnadi
the company had from the year 2003 to the year 2009. After that there was a
huge fall in the assets in the year 2010. Later after that fall the chart shows a
constant rise in the accumulation of the cash in the accounts of the company.
Year vs Total non-current asset
The term Total non-current asset can be defined as the total sum of the assets
which the company currently hold but are not likely to turn into cash with in the
current year of the balance sheet assessment. For this property there is no surety
of the fact that there would always be a constant rise in the table but a fluctuation
suggest that the company has all the possible financial departs corrected out.
There was a rise in the data and a little fall after the year 2005. After that they are
always able to develop form they loss until the year 2013. Later in 2014 after
there is a small drop in the amount of assets but it is again recovered in the
following years.
Dashboard 3
9
jujuvisnadi@gmail.com
⊘ This is a preview!⊘
Do you want full access?
Subscribe today to unlock all pages.
Trusted by 1+ million students worldwide
125623 Juliana Augusto Visnadi
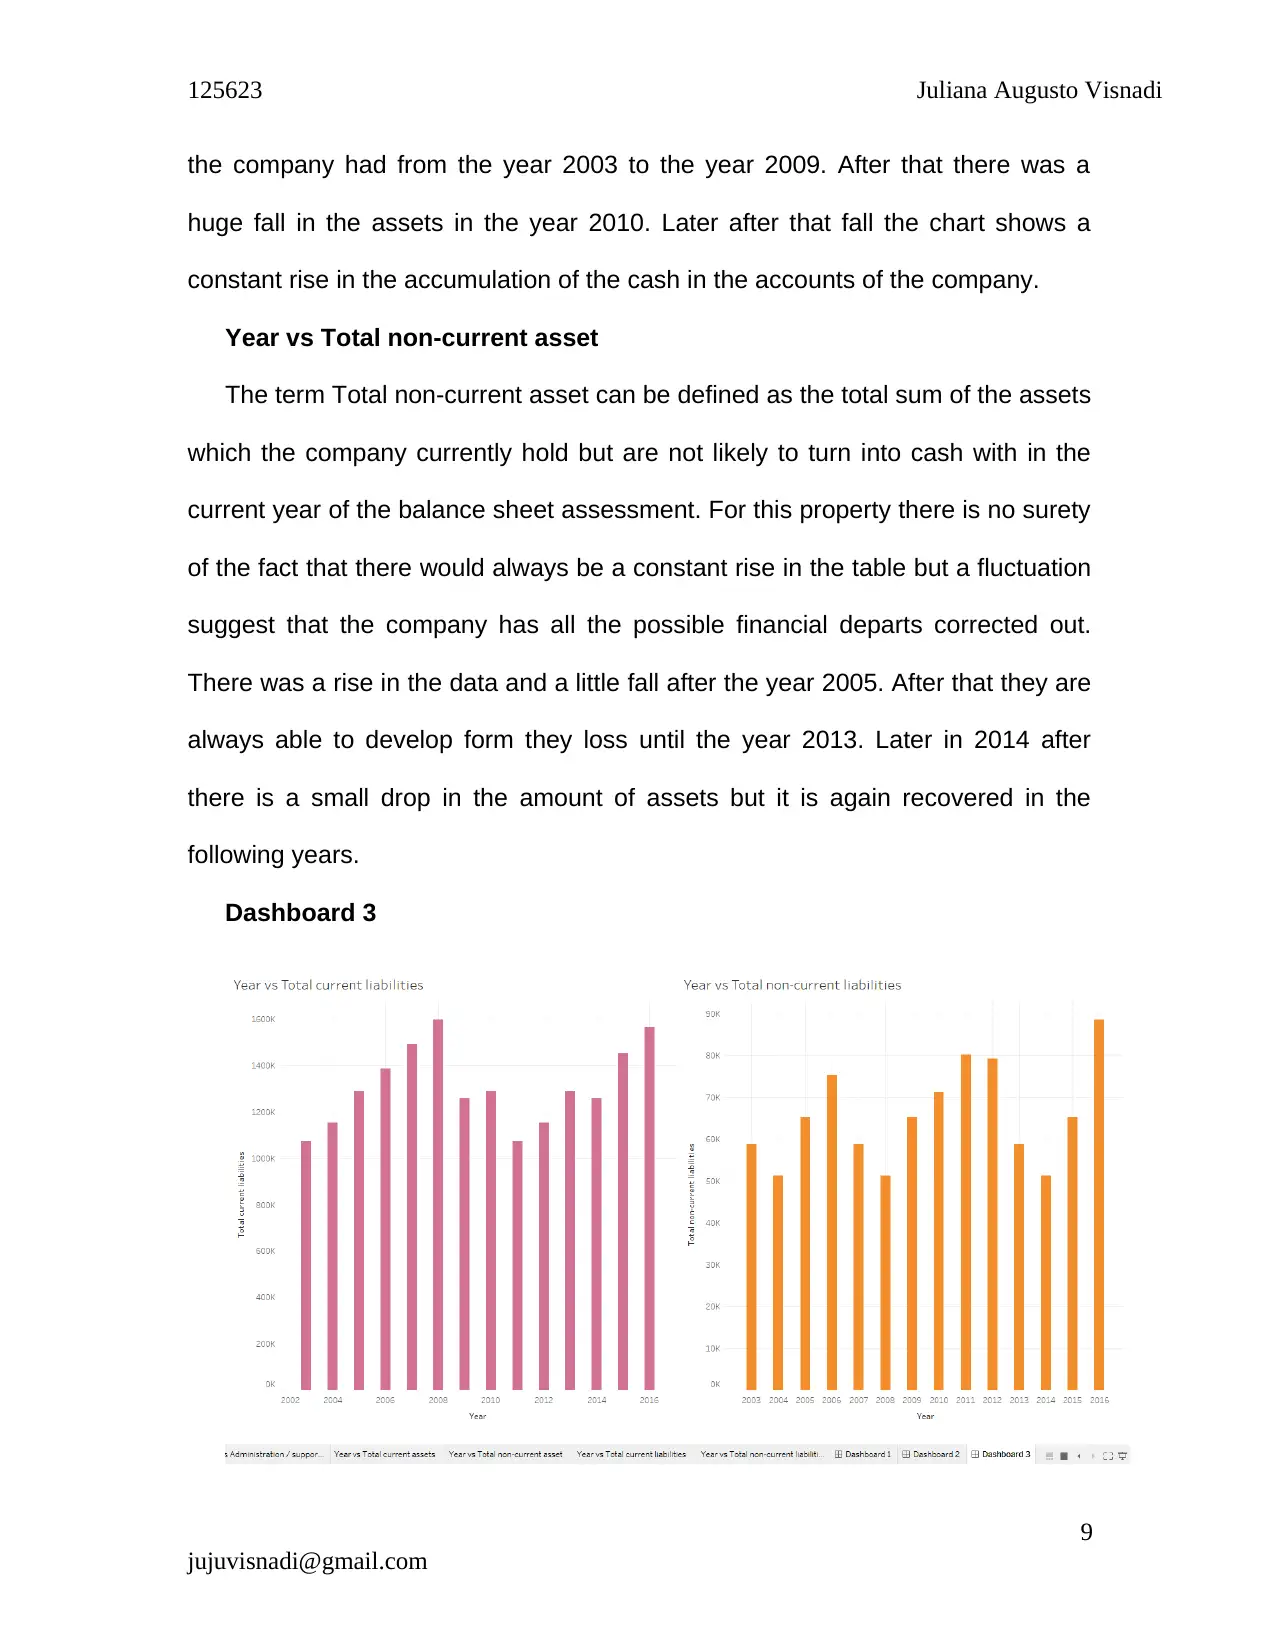
Figure 1: Dashboard 3 from Tableau Software
Year vs Total current liabilities
The liabilities is the sum of all the amount of money which is company
currently owns to other companies in terms of debt. From the graph it can be
seen that the maximum debt which the company had faced was in the year 2008.
This was reduced instantly the next year to a very low point which helped the
organization to get hand son more materials for the development of the products.
There is a gradual increase in the total liabilities of the company from 2003 up to
2008 after which there is a sharp fall and again another fall in the year 2011. After
this there was a constant rise in the total liabilities of the company up to the year
2013. Later then the points started to rise up.
Year vs Total non-current liabilities
The non-current liabilities is the amount of money which the company has
invested in a product acquirement for a long term. This money is not due in the
recent time and can be paid off in the future. From the graph it can be seen that
there is a lot of fluctuation in the amount of money listed under the non-current
liability category. This suggest that they have acquired new items yearly and
again paid off the older ones on a regular basis. Keeping the correct balance
between the paid ones and the non-paid ones means that the company has the
best assessment of their accounts.
5. Weakness
Identifying inefficiencies.
10
jujuvisnadi@gmail.com
Paraphrase This Document
Need a fresh take? Get an instant paraphrase of this document with our AI Paraphraser
125623 Juliana Augusto Visnadi
The company has not done any innovative creation in the field of fashion
and new trends in the clothing industry (Williams, 2014). The designs have
become and old are not able to attract new customers. The work efficiency of the
employees should also be improved by the company. The company also
produces clothes for a specific target audience. They cater to a certain age group
in the world and this leaves out the rest of the age groups which could be
composed of some potential high valued customers. The absence of feedback
and review form on the company’s webpage weakens the strong hold of the
market. The new customers are not able to understand the quality and the
assessment of the product if they are not able to understand the problems the
other customers who have bought the same product has faced or not
(Showpo.com, 2017).
6. Improvement opportunities
Recommendations on how to treat data from consumers using their
website, information on social media and tools to offer best deals of group of
products from different categories bought together (usually these websites show
similar products while you are browsing, Showpo should start offering shoes and
accessories that go with the dress searched for example instead of only showing
in the bottom other dresses that the consumer could be interested in). VIP groups
not only newsletter, option of showing the client the statistics of each product
(level of exclusivity, cheaper if more people are buying each item, more
expensive the more exclusive the item is – considering quality naturally). And
more.
The company needs to identify the issues which they are facing in the
market competition and assess them one by one before moving forward. They
should plan out mission and goals for a financial year to make a better grip on the
market and following the goals help them to achieve the profit they would be
willing to get. After placing out the goals and the problems in the organization it is
11
jujuvisnadi@gmail.com
125623 Juliana Augusto Visnadi
recommended for the company to develop a strategy for the company to follow
which would help them to achieve the goals.
12
jujuvisnadi@gmail.com
recommended for the company to develop a strategy for the company to follow
which would help them to achieve the goals.
12
jujuvisnadi@gmail.com
⊘ This is a preview!⊘
Do you want full access?
Subscribe today to unlock all pages.
Trusted by 1+ million students worldwide
1 out of 14
Your All-in-One AI-Powered Toolkit for Academic Success.
+13062052269
info@desklib.com
Available 24*7 on WhatsApp / Email
![[object Object]](/_next/static/media/star-bottom.7253800d.svg)
Unlock your academic potential
Copyright © 2020–2026 A2Z Services. All Rights Reserved. Developed and managed by ZUCOL.