Lab Report: Sieve Analysis in Pharmaceutical Tablet Formulation

Verified

Added on  2023/04/11

|5
|731
|329
Report
AI Summary
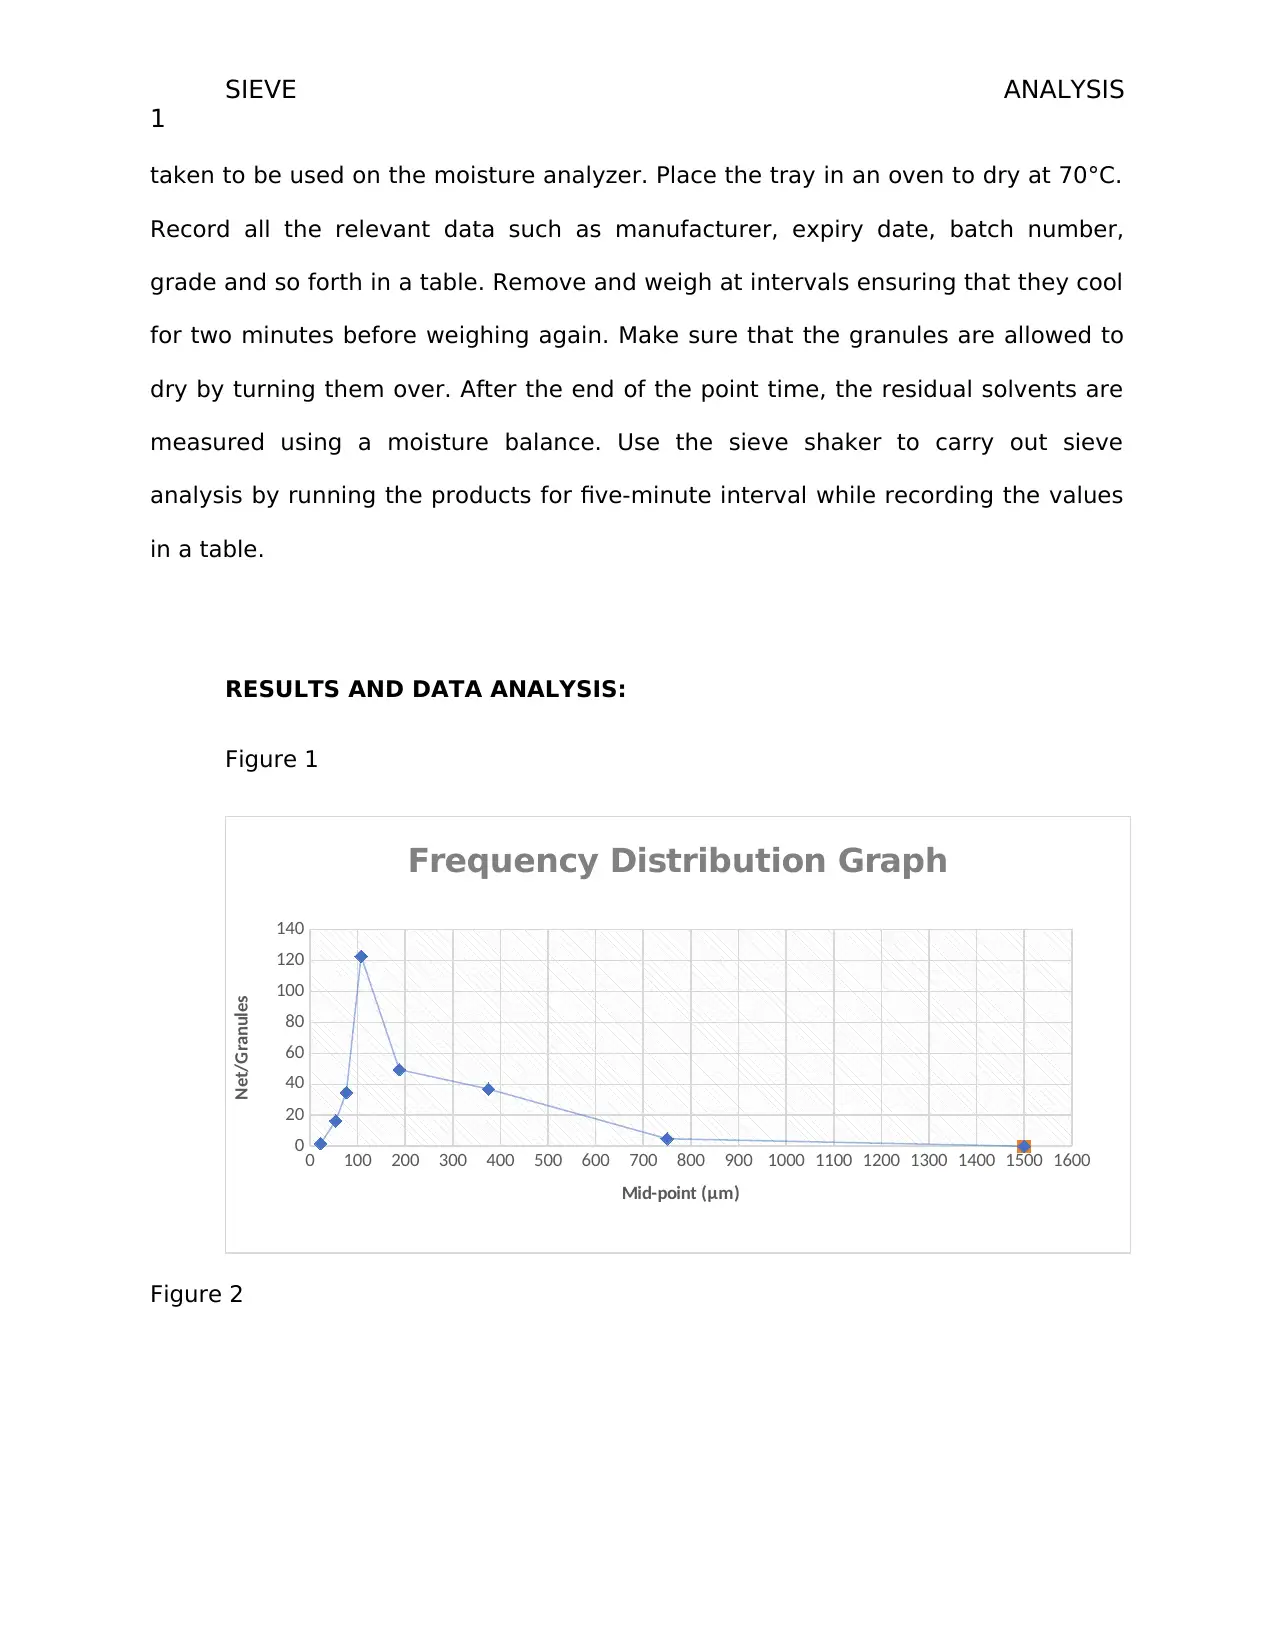
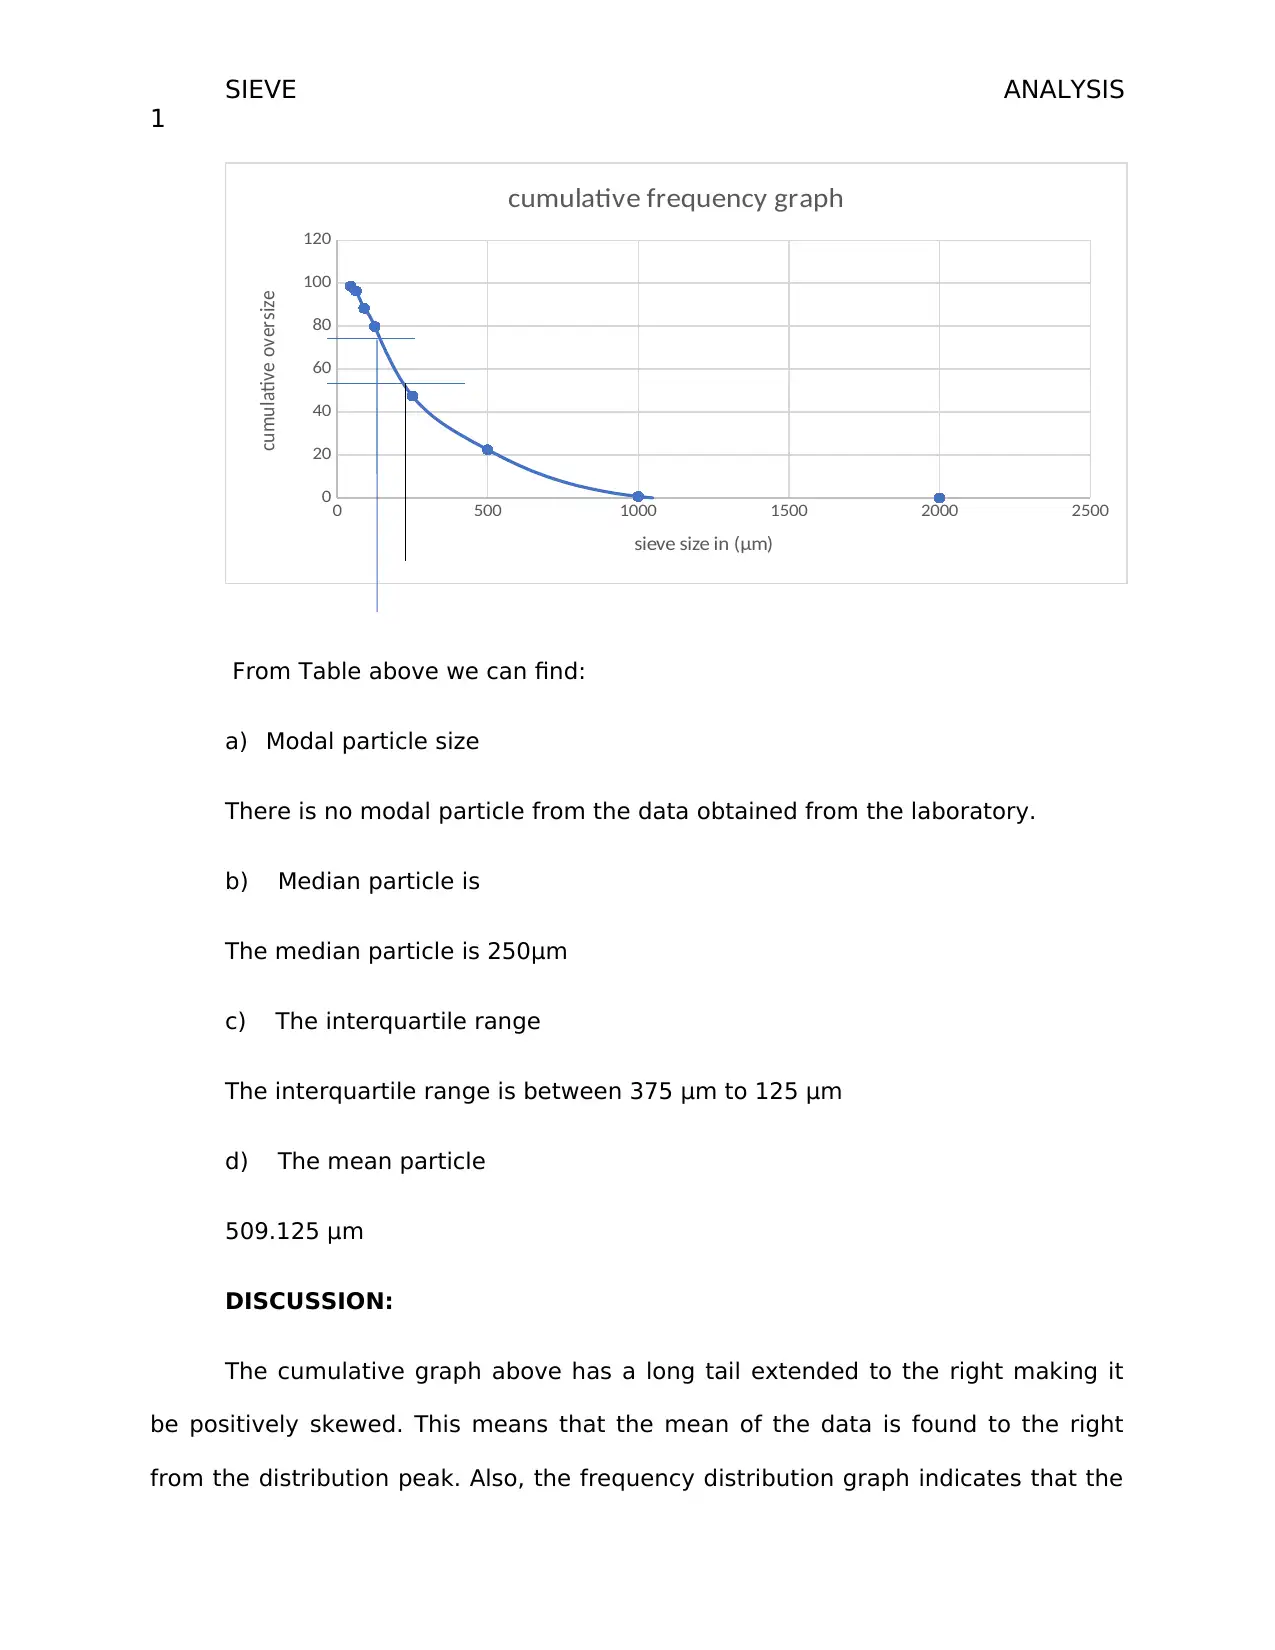
This report details the development of a new drug formulation using sieve analysis. The process involves mixing powders, adding a PVP solution, and using an Erweka oscillating granulator. Data collected from the sieve analysis is used to determine modal particle size, median particle size, interquartile range, and mean particle size. The cumulative frequency graph indicates a positively skewed distribution, with starch sodium glycolate being the most abundant granule type. The analysis concludes that granulation can be achieved through a dry process, highlighting the importance of sieve analysis in pharmaceutical tablet development. Desklib offers similar solved assignments and resources for students.
Document Page
SIEVE ANALYSIS
1
Introduction
Granulation can be defined as the process by which granules are formed from
solid products. It is applied in many industries starting from food processing
industries like sugar processing industries to drug manufacturing industries. Over
the years, researchers have come up with several granulation methods that can be
used during drug formulation. The methods are fluid bed granulation, melt
granulation, wet and dry granulation, moisture activated granulation and so forth
(Keary & Sheskey 2004). Wet granulation method is commonly used when forming
most pharmaceutical tablets. The reason why wet granulation is preferred to other
methods is that its application can be done to all drugs, and for many scientists, it is
the best method for drugs with high dosage likewise to drugs with a low dosage
(Railkar & Schwartz 2000). Tablets are either prepared through direct compression
or granular compression. This report is focused on developing a new drug
formulation using the data obtained from the laboratory experiment. The data here
are analyzed using sieve analysis method. To do this, several products are passed
through a series of sieves with decreasing sizes after which the materials that have
stopped at individual sieve are weighed then finally analyzed.
Method
The following method is outlined for the formulation of a new drug. Take the
weight of all given the powders and mix them thoroughly in a planetary mixer for
five minutes noting the movement of the paddle and the set speed. Add the PVP
solution slowly to the mixer till the required consistency is achieved. Now, use the
Erweka oscillating granulator through the finer sieves as you collect these granules
in the initially weighed metal tray. Record this weight. A small sample of granules is
tabler-icon-diamond-filled.svg

Paraphrase This Document

Need a fresh take? Get an instant paraphrase of this document with our AI Paraphraser
Document Page
SIEVE ANALYSIS
1
taken to be used on the moisture analyzer. Place the tray in an oven to dry at 70°C.
Record all the relevant data such as manufacturer, expiry date, batch number,
grade and so forth in a table. Remove and weigh at intervals ensuring that they cool
for two minutes before weighing again. Make sure that the granules are allowed to
dry by turning them over. After the end of the point time, the residual solvents are
measured using a moisture balance. Use the sieve shaker to carry out sieve
analysis by running the products for five-minute interval while recording the values
in a table.
RESULTS AND DATA ANALYSIS:
Figure 1
0 100 200 300 400 500 600 700 800 900 1000 1100 1200 1300 1400 1500 1600
0
20
40
60
80
100
120
140
Frequency Distribution Graph
Mid-point (μm)
Net/Granules
Figure 2
Document Page
SIEVE ANALYSIS
1
0 500 1000 1500 2000 2500
0
20
40
60
80
100
120
cumulative frequency graph
sieve size in (μm)
cumulative oversize
From Table above we can find:
a) Modal particle size
There is no modal particle from the data obtained from the laboratory.
b) Median particle is
The median particle is 250μm
c) The interquartile range
The interquartile range is between 375 μm to 125 μm
d) The mean particle
509.125 μm
DISCUSSION:
The cumulative graph above has a long tail extended to the right making it
be positively skewed. This means that the mean of the data is found to the right
from the distribution peak. Also, the frequency distribution graph indicates that the
Document Page
SIEVE ANALYSIS
1
starch sodium glycolate is abundant type granules in the tablet. The frequency is
about 600g while the PVP has a low frequency. This means that the PVP which acts
as the binder has the least use in the development of the tablet. From the graph, it
is also evident that the modal particle size is 250 (μm) showing how most tablets
produced are the 250μm. Majority of the tablets ranges between 375 μm to 125 μm.
CONCLUSION:
From the analysis done in the report, we can conclude that granulation can
be done also by a dry process.
References.
Keary CM, Sheskey PJ. Preliminary report of the discovery of a new
pharmaceutical granulation process using foamed aqueous binders. Drug
development and industrial pharmacy. 2004 Jan 1;30(8):831-45.
tabler-icon-diamond-filled.svg

Paraphrase This Document

Need a fresh take? Get an instant paraphrase of this document with our AI Paraphraser
Document Page
SIEVE ANALYSIS
1
Railcar AM, Schwartz JB. Evaluation and comparison of a moist granulation
technique to conventional methods. Drug development and industrial pharmacy.
2000 Jan 1;26(8):885-9.
Leuenberger H, Lanz M. Pharmaceutical powder technology—from art to
science: the challenge of the FDA's Process Analytical Technology initiative.
Advanced powder technology. 2005 Jan 1;16(1):3-25.
chevron_up_icon
1 out of 5
circle_padding
hide_on_mobile
zoom_out_icon
[object Object]