Comparative Analysis of Sigma Healthcare and API Capital Structures
VerifiedAdded on 2023/04/23
|6
|826
|283
Report
AI Summary
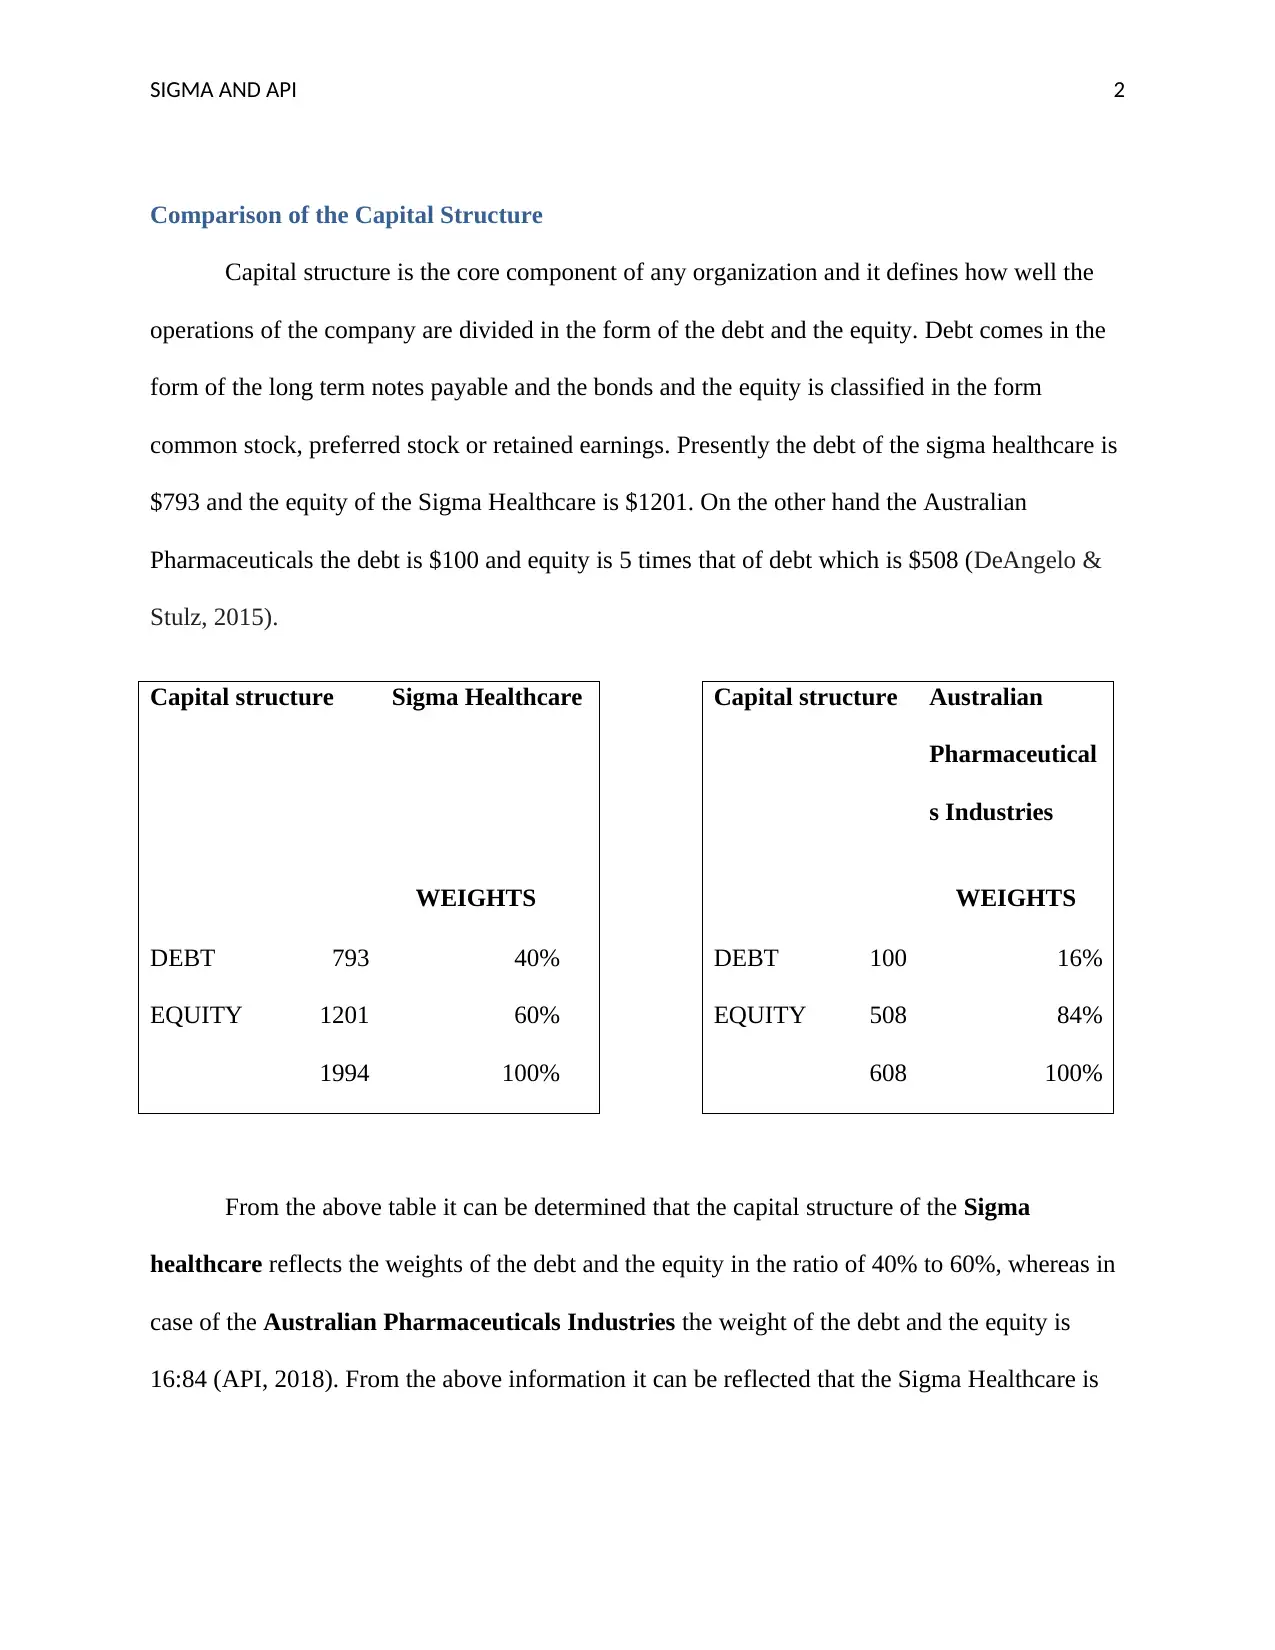
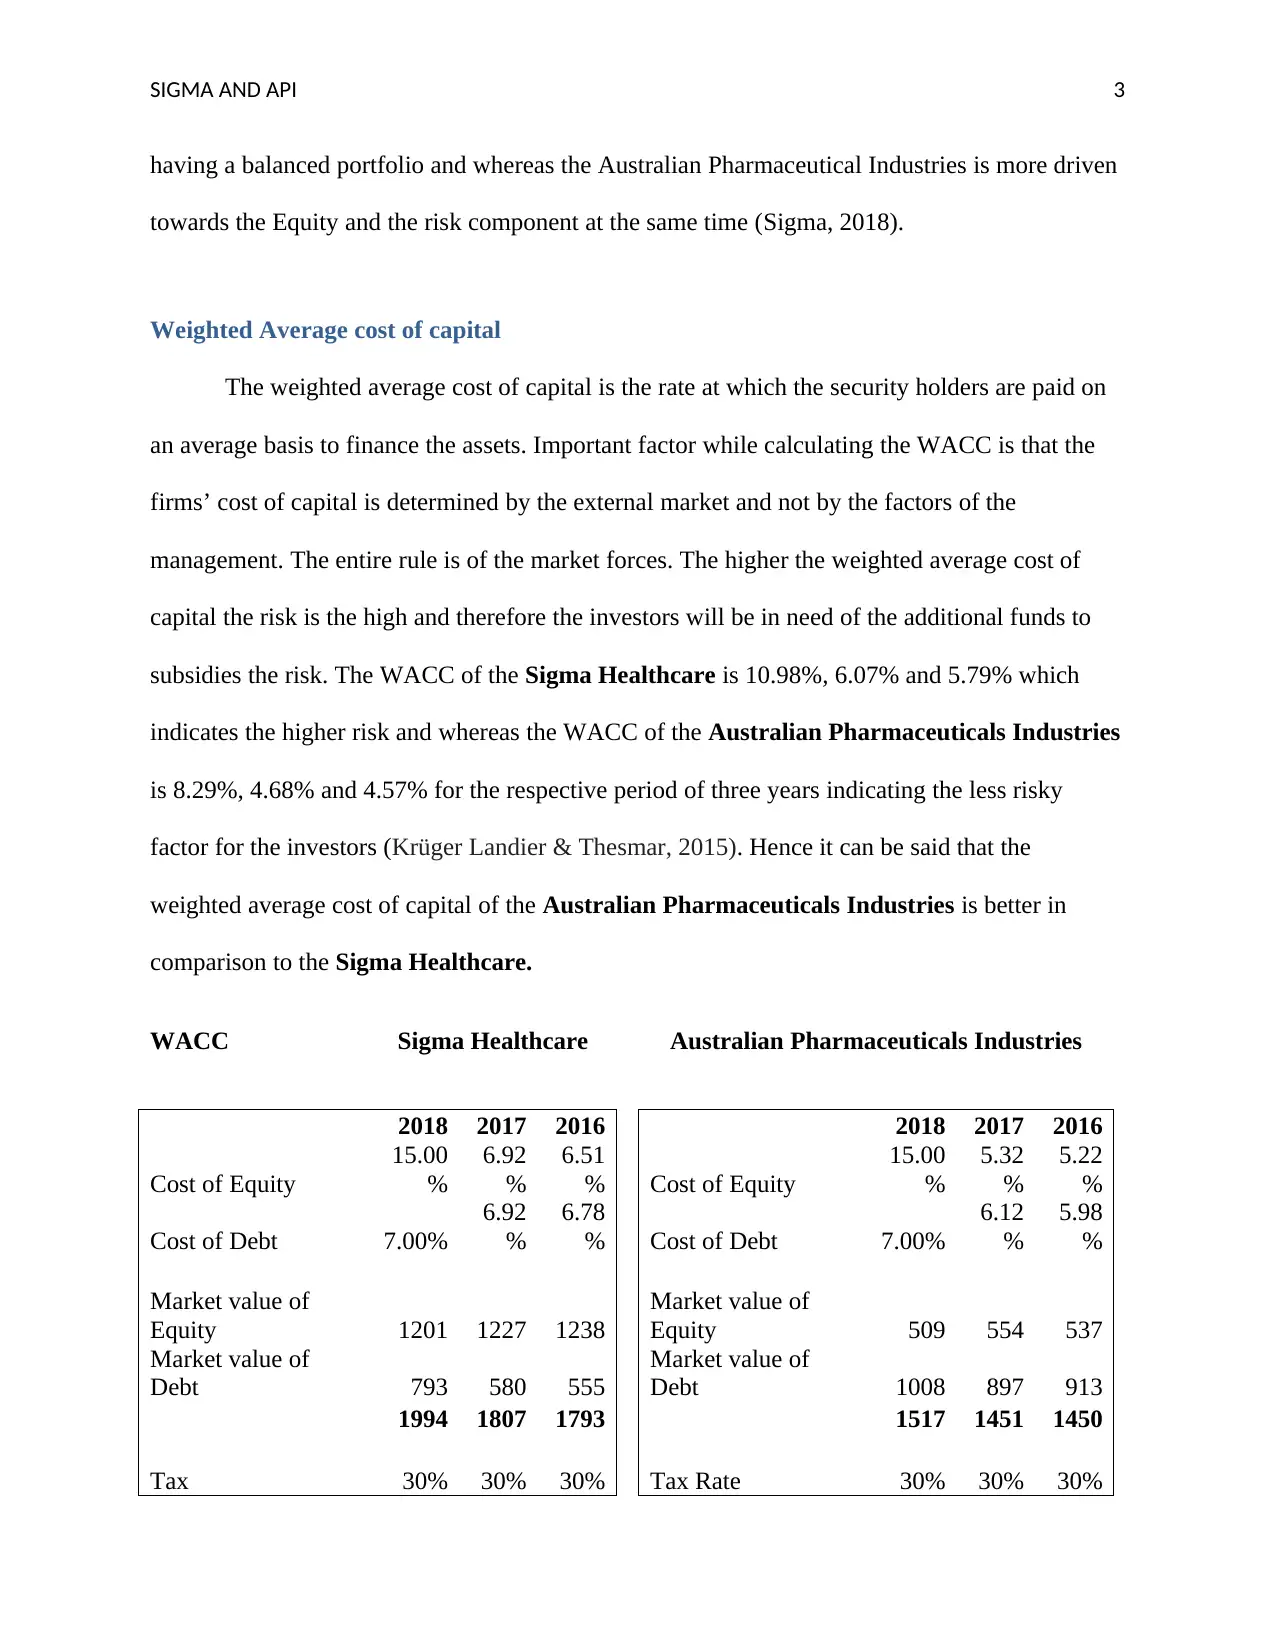
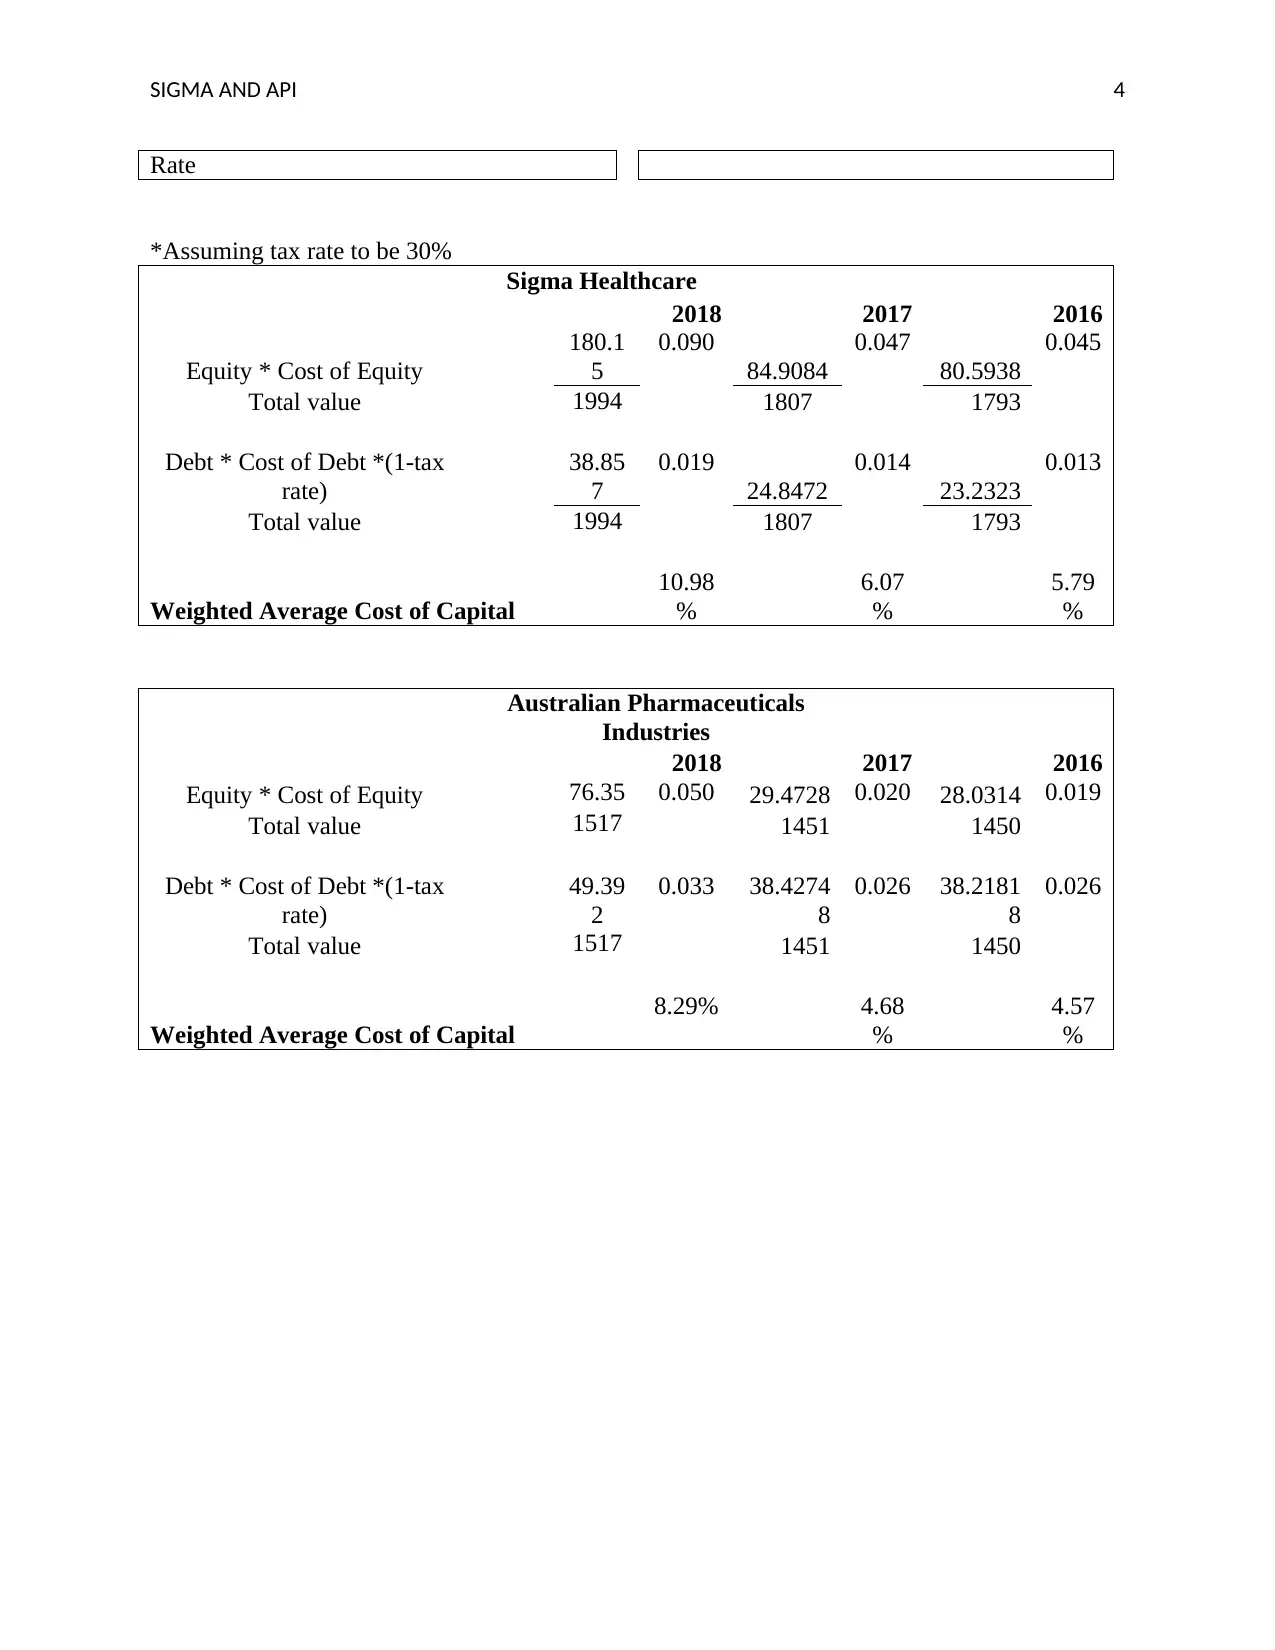
This report undertakes a comparative financial analysis of Sigma Healthcare and Australian Pharmaceutical Industries (API), focusing on their capital structures and weighted average cost of capital (WACC). The analysis begins with a comparison of the debt and equity components of each company's capital structure, revealing that Sigma Healthcare has a more balanced portfolio (40% debt, 60% equity) compared to API (16% debt, 84% equity). The report then delves into the WACC, highlighting the cost of equity, cost of debt, and tax rates for both companies across three years (2016-2018). The WACC of Sigma Healthcare is higher than that of API, indicating a higher risk profile. The report concludes that API's capital structure and WACC appear more favorable for investors. The report references financial statements from API and Sigma, as well as academic sources on capital structure and WACC.

1 out of 6


Your All-in-One AI-Powered Toolkit for Academic Success.
+13062052269
info@desklib.com
Available 24*7 on WhatsApp / Email
![[object Object]](/_next/static/media/star-bottom.7253800d.svg)
Copyright © 2020–2026 A2Z Services. All Rights Reserved. Developed and managed by ZUCOL.