A Comparative Study: Simple Reaction Time of Young vs. Old Adults
VerifiedAdded on 2023/01/04
|18
|3246
|44
Report
AI Summary
This report presents a study investigating the differences in simple reaction time (SRT) between young and older adults. The study utilized the ruler drop test to measure visual reaction time in a sample of 100 participants, equally divided into young (18-25 years) and older (30-50 years) age groups. The report details the methodology, including participant selection, the ruler drop test procedure, and statistical analysis using a z-test. The results revealed a statistically significant difference in SRT between the two groups, with younger adults exhibiting faster reaction times. The findings support the hypothesis that age influences SRT, confirming previous research. The report further discusses the implications of these results, highlighting the impact of aging on cognitive functions and the potential for using SRT tasks to assess age-related cognitive decline. The study concludes with recommendations for future research, emphasizing the need for further investigation into the factors affecting SRT in diverse populations and across different age ranges. The report is structured in APA style, including an abstract, introduction, methods, results, discussion, references, and an appendix with the IRB form.
Running head: DIFFERENCE IN SRT 1
Difference in Simple Reaction Time of Young versus Old Adults Paper
Student Name
Institution
Difference in Simple Reaction Time of Young versus Old Adults Paper
Student Name
Institution
Paraphrase This Document
Need a fresh take? Get an instant paraphrase of this document with our AI Paraphraser
DIFFERENCE IN SRT 2
Abstract
The degree of visual reaction time is often used to analyze the processing levels of the
cognitive system, and the dexterity between motor and sensory structures in an organism. Based
on the expansive body or research, reaction time is affected by various factors. The influence of
age on simple reaction time has been observed in this research project. The present study entailed
160 participants, out of which only 100 aged between 18 and 50 years were selected for the
study. The sample included 50 male and 50 female adults, and the data has been discussed based
on the suggested hypothesis.
DIFFERENCE IN SRT 3
Difference in Simple Reaction Time of Young versus Old Adults
1. Introduction
Numerous research studies analyzing the cognitive functions during adulthood are
regularly interested in the effects of age-related disparities on performance levels. Consequently,
this interest has led to various evaluations regarding average performance as indicated in
different age groups, such as those performed using cross-sectional designs, and longitudinal
designs which analyze possible changes in performance within similar samples across a given
time period. While studies on average age-related disparities and variations in cognitive behavior
have been beneficial, it has led to the development of specific assumptions with regard to human
development. In particular, this notion is founded on the idea that either the target behaviors are
stable across time, or that the degree of changes that take place are dissimilar for every person.
This theory, in accordance with the level of activity is evidence of a dominant broad stability
perspective in this area of research (Watt, & Collins, 2010).
Reaction time is the rate at which a subject acts in response to stimuli within their
immediate surroundings (Quirk, 2016). As such, it measures an individual’s psychomotor
response, a feature that is more commonly believed to be influenced by genetics. It is gauged as
a reaction of the physical parts of the entire body, like, hearing, seeing, and other stimuli
(Vasishth, & Broe, 2011). Studies show that shorter reaction times are indicative of more
accurate results, but only in association with other parameters, like, intellect, strength, and motor
reflexes (Hodgkins, 2013). The aim of this research project is to establish the impact of age on an
individual’s simple reaction time with regard to their visual stimuli when catching a falling ruler.
2. Method
2.1. Sample of Participants
⊘ This is a preview!⊘
Do you want full access?
Subscribe today to unlock all pages.
Trusted by 1+ million students worldwide
DIFFERENCE IN SRT 4
The study was based on a group of 160 participants including male and female adults, all
aged between 17 to 58 years. Out of this group, a sample of 100 adults was randomly selected to
include an equal number of males and females aged between 18 and 50. The age of this sample
was objectively selected based on literature data which indicated that the simple reaction time, as
concerned with age, advances from early childhood till the early twenties, and progressively
reduces up to the 50s and 60s (MacDonald et al., 2008). This project, thus, hypothesizes that
younger adults have a faster simple reaction time in comparison to older adults. This leads to the
following hypothesis, based on the project’s aim to analyze response time with regard to age, in
response to a person’s ability to catch a falling object:
H1: Younger individuals have a faster simple reaction time as compared to older individuals.
The analysis included 100 adults, with 50 participants in each group based on the age of
the individual. There were 25 men and 25 women in each of the two groups, thereby bringing the
aggregate to 50 older, and 50 younger participants. The average age range of all 160 participants
was 29.44375 years, and included a total of 79 males, and 81 females.
2.2. Modification
Age classes were selected at random in order to have only 25 women and 25 men in each
group, thereby arriving at the desired total of 100 participants with 50 males and 50 females. The
participants were, similarly, classified into two groups, each of which entailed the oldest and
youngest participants. The participants in the oldest group consisted of people aged between 18
to 25 years, whereas the youngest group entailed participants aged between 30 to 50 years. The
omission of participants between the ages of 25 to 30 years was performed using a random
selection to avoid biasness, and was necessary to ensure the attainment of an appropriate
Paraphrase This Document
Need a fresh take? Get an instant paraphrase of this document with our AI Paraphraser
DIFFERENCE IN SRT 5
significant difference when comparing the difference between the sample and hypothesized
mean (see Appendix 1 and 2 below).
2.3. Measuring Methods
2.3.1. Simple Reaction Time
The Ruler Drop test was initially adapted by Pieron in 1928, and was later analyzed and
described by Woodsworth (1954) and Schlosberg as a highly efficient chronoscope (Konsinski,
2005). Ever since, the Ruler Drop test has been considered as an ideal measure when assessing
simple reaction time (Webber, & Porter, 2010). To perform a sample test involving a participant
and an executor, the following steps are often followed:
1. The participant holds out their chosen hand, and extends the index and thumb
approximately 8 cm apart.
2. The executor then holds a metric ruler evenly in-between the participant’s thumb and
index finger. The ruler should be placed vertically such that the lowest numbers are
closest to the participant’s hand.
3. Thereafter, the ruler is dropped, and the participant grasps it between the two outstretched
fingers.
4. The executor records the number clasped at the fingertips, which is the distance that the
ruler fell through the participant’s fingers.
5. The executor calculates the time taken by the participant to respond to and grasp the
falling ruler.
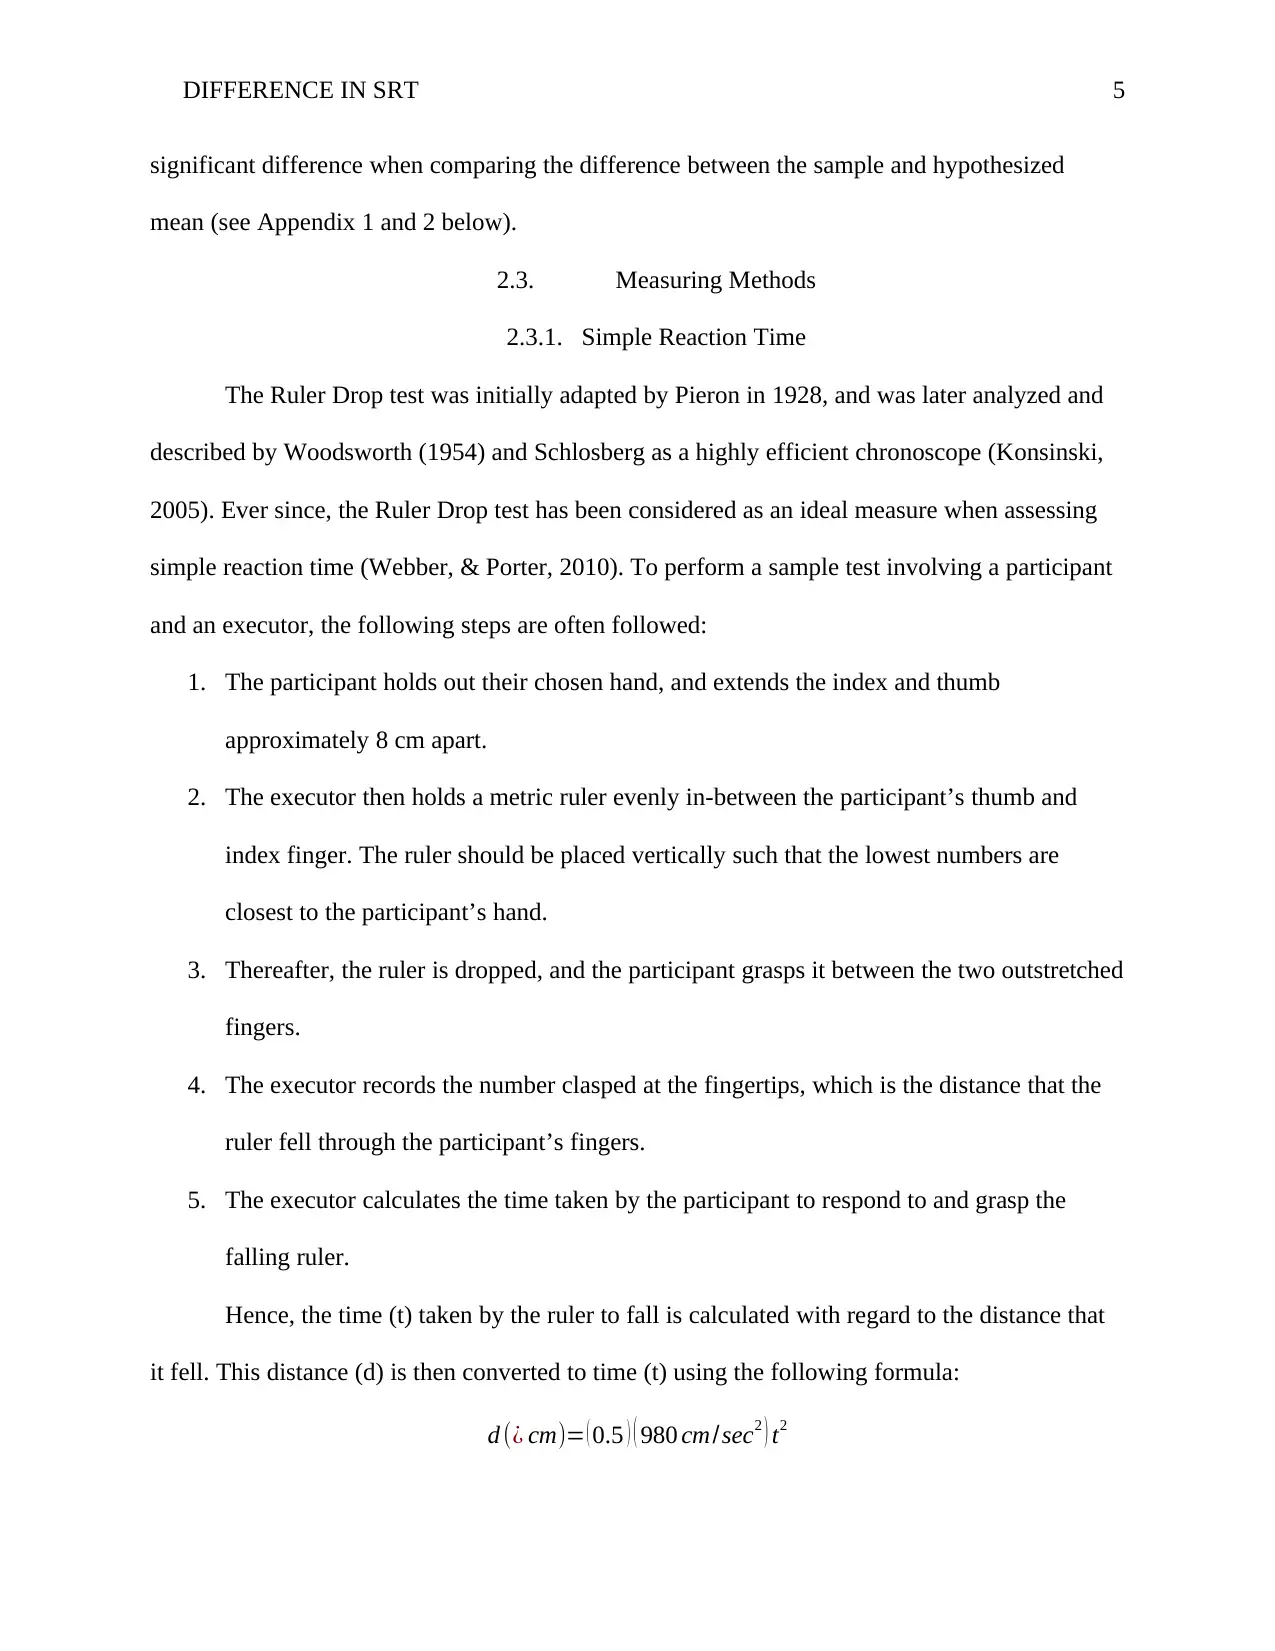
Hence, the time (t) taken by the ruler to fall is calculated with regard to the distance that
it fell. This distance (d) is then converted to time (t) using the following formula:
d (¿ cm)= ( 0.5 ) ( 980 cm/sec2 ) t2
significant difference when comparing the difference between the sample and hypothesized
mean (see Appendix 1 and 2 below).
2.3. Measuring Methods
2.3.1. Simple Reaction Time
The Ruler Drop test was initially adapted by Pieron in 1928, and was later analyzed and
described by Woodsworth (1954) and Schlosberg as a highly efficient chronoscope (Konsinski,
2005). Ever since, the Ruler Drop test has been considered as an ideal measure when assessing
simple reaction time (Webber, & Porter, 2010). To perform a sample test involving a participant
and an executor, the following steps are often followed:
1. The participant holds out their chosen hand, and extends the index and thumb
approximately 8 cm apart.
2. The executor then holds a metric ruler evenly in-between the participant’s thumb and
index finger. The ruler should be placed vertically such that the lowest numbers are
closest to the participant’s hand.
3. Thereafter, the ruler is dropped, and the participant grasps it between the two outstretched
fingers.
4. The executor records the number clasped at the fingertips, which is the distance that the
ruler fell through the participant’s fingers.
5. The executor calculates the time taken by the participant to respond to and grasp the
falling ruler.
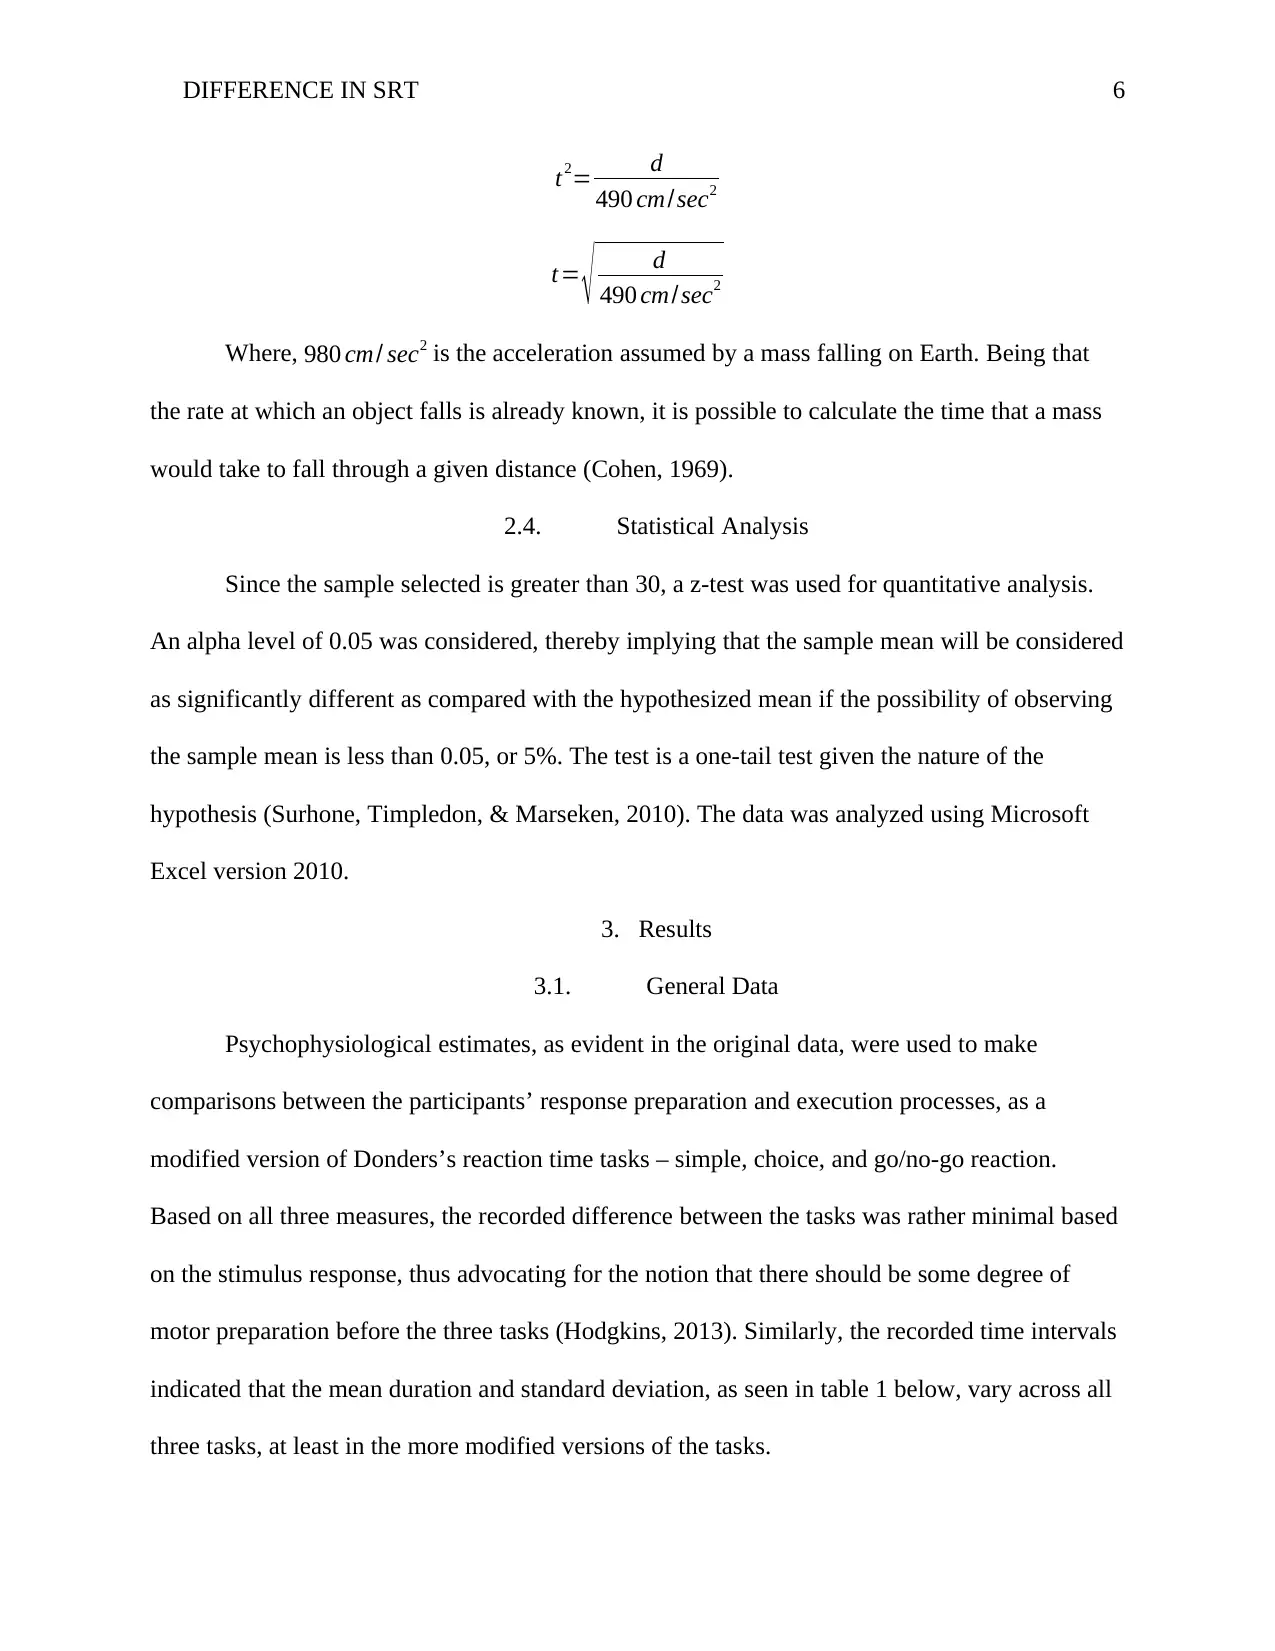
Hence, the time (t) taken by the ruler to fall is calculated with regard to the distance that
it fell. This distance (d) is then converted to time (t) using the following formula:
d (¿ cm)= ( 0.5 ) ( 980 cm/sec2 ) t2
DIFFERENCE IN SRT 6
t2= d
490 cm/sec2
t= √ d
490 cm/sec2
Where, 980 cm/ sec2 is the acceleration assumed by a mass falling on Earth. Being that
the rate at which an object falls is already known, it is possible to calculate the time that a mass
would take to fall through a given distance (Cohen, 1969).
2.4. Statistical Analysis
Since the sample selected is greater than 30, a z-test was used for quantitative analysis.
An alpha level of 0.05 was considered, thereby implying that the sample mean will be considered
as significantly different as compared with the hypothesized mean if the possibility of observing
the sample mean is less than 0.05, or 5%. The test is a one-tail test given the nature of the
hypothesis (Surhone, Timpledon, & Marseken, 2010). The data was analyzed using Microsoft
Excel version 2010.
3. Results
3.1. General Data
Psychophysiological estimates, as evident in the original data, were used to make
comparisons between the participants’ response preparation and execution processes, as a
modified version of Donders’s reaction time tasks – simple, choice, and go/no-go reaction.
Based on all three measures, the recorded difference between the tasks was rather minimal based
on the stimulus response, thus advocating for the notion that there should be some degree of
motor preparation before the three tasks (Hodgkins, 2013). Similarly, the recorded time intervals
indicated that the mean duration and standard deviation, as seen in table 1 below, vary across all
three tasks, at least in the more modified versions of the tasks.
⊘ This is a preview!⊘
Do you want full access?
Subscribe today to unlock all pages.
Trusted by 1+ million students worldwide
DIFFERENCE IN SRT 7
MEA
N
330.58111
25
0.7624
38
0.4526
69
0.5611
5
SD
223.85582
49
0.9545
81
0.1517
55
0.6157
08
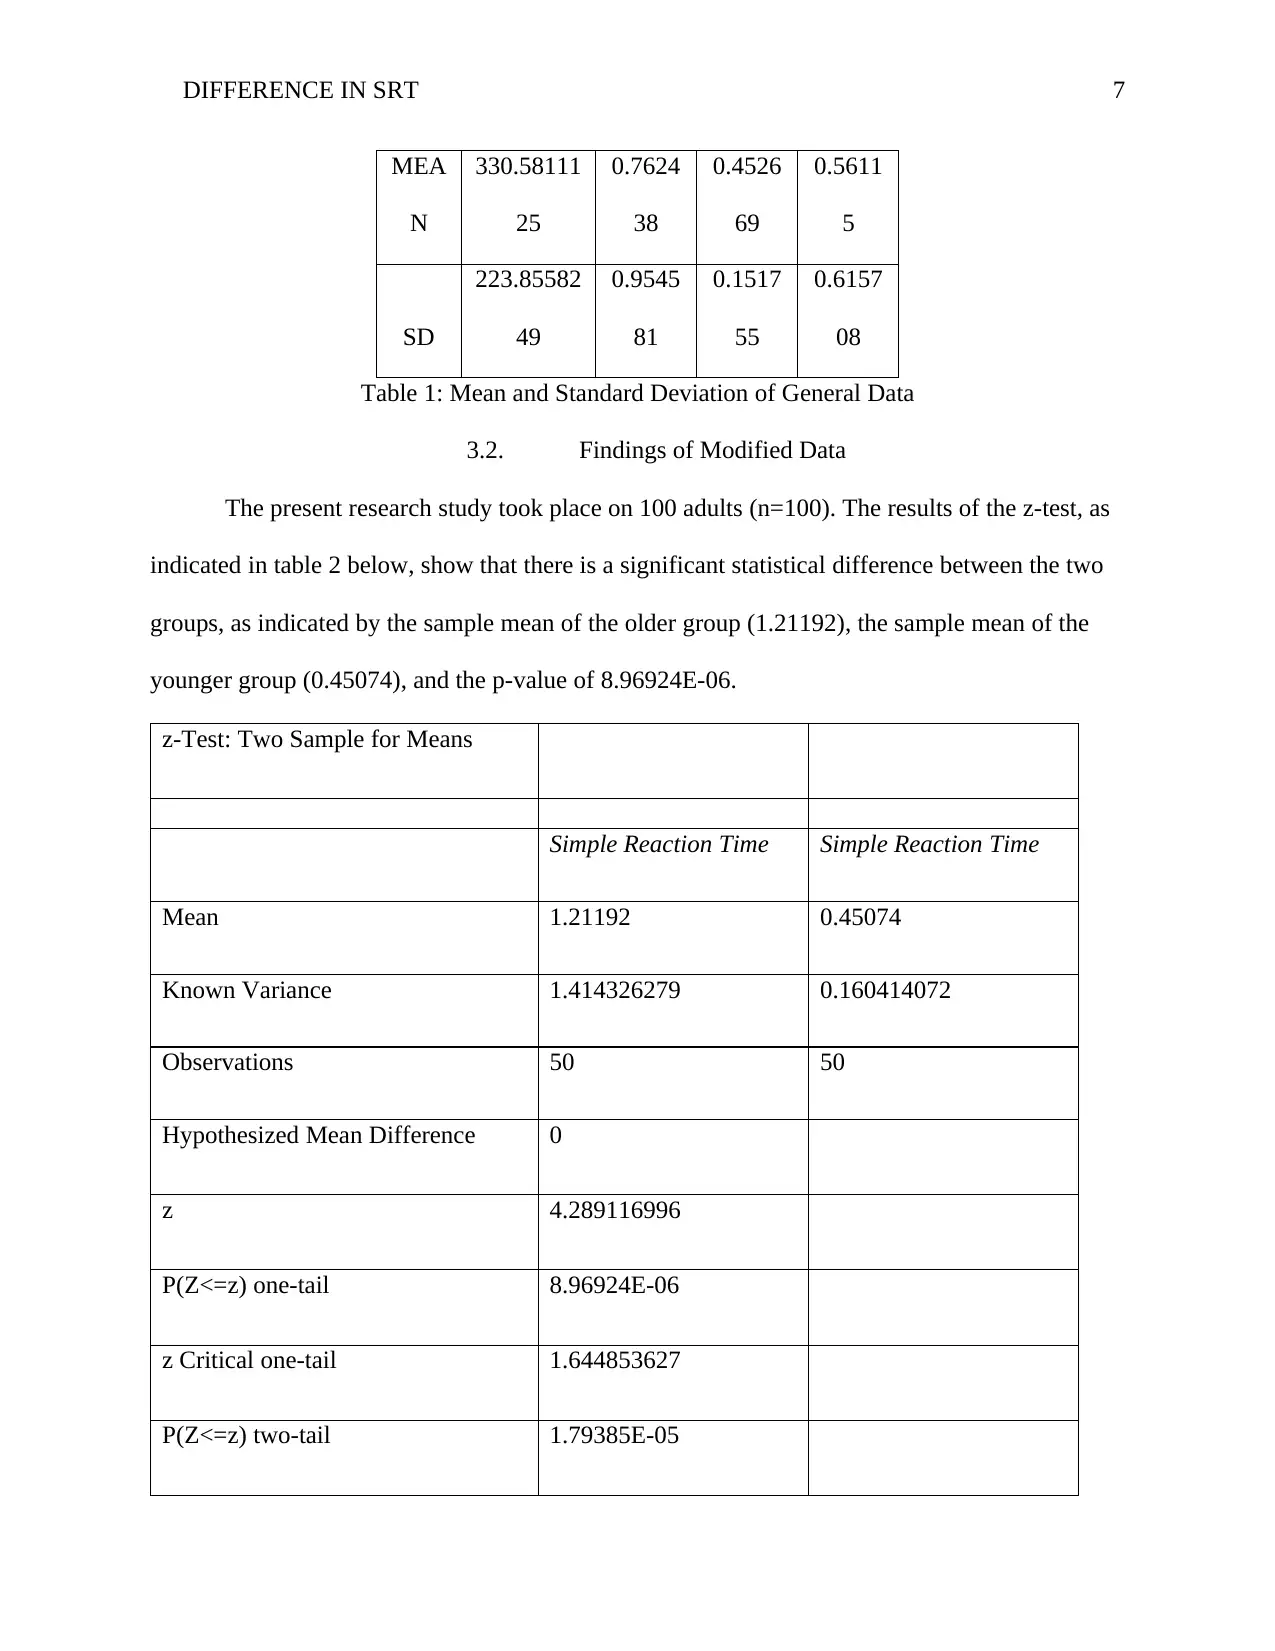
Table 1: Mean and Standard Deviation of General Data
3.2. Findings of Modified Data
The present research study took place on 100 adults (n=100). The results of the z-test, as
indicated in table 2 below, show that there is a significant statistical difference between the two
groups, as indicated by the sample mean of the older group (1.21192), the sample mean of the
younger group (0.45074), and the p-value of 8.96924E-06.
z-Test: Two Sample for Means
Simple Reaction Time Simple Reaction Time
Mean 1.21192 0.45074
Known Variance 1.414326279 0.160414072
Observations 50 50
Hypothesized Mean Difference 0
z 4.289116996
P(Z<=z) one-tail 8.96924E-06
z Critical one-tail 1.644853627
P(Z<=z) two-tail 1.79385E-05
MEA
N
330.58111
25
0.7624
38
0.4526
69
0.5611
5
SD
223.85582
49
0.9545
81
0.1517
55
0.6157
08
Table 1: Mean and Standard Deviation of General Data
3.2. Findings of Modified Data
The present research study took place on 100 adults (n=100). The results of the z-test, as
indicated in table 2 below, show that there is a significant statistical difference between the two
groups, as indicated by the sample mean of the older group (1.21192), the sample mean of the
younger group (0.45074), and the p-value of 8.96924E-06.
z-Test: Two Sample for Means
Simple Reaction Time Simple Reaction Time
Mean 1.21192 0.45074
Known Variance 1.414326279 0.160414072
Observations 50 50
Hypothesized Mean Difference 0
z 4.289116996
P(Z<=z) one-tail 8.96924E-06
z Critical one-tail 1.644853627
P(Z<=z) two-tail 1.79385E-05
Paraphrase This Document
Need a fresh take? Get an instant paraphrase of this document with our AI Paraphraser
DIFFERENCE IN SRT 8
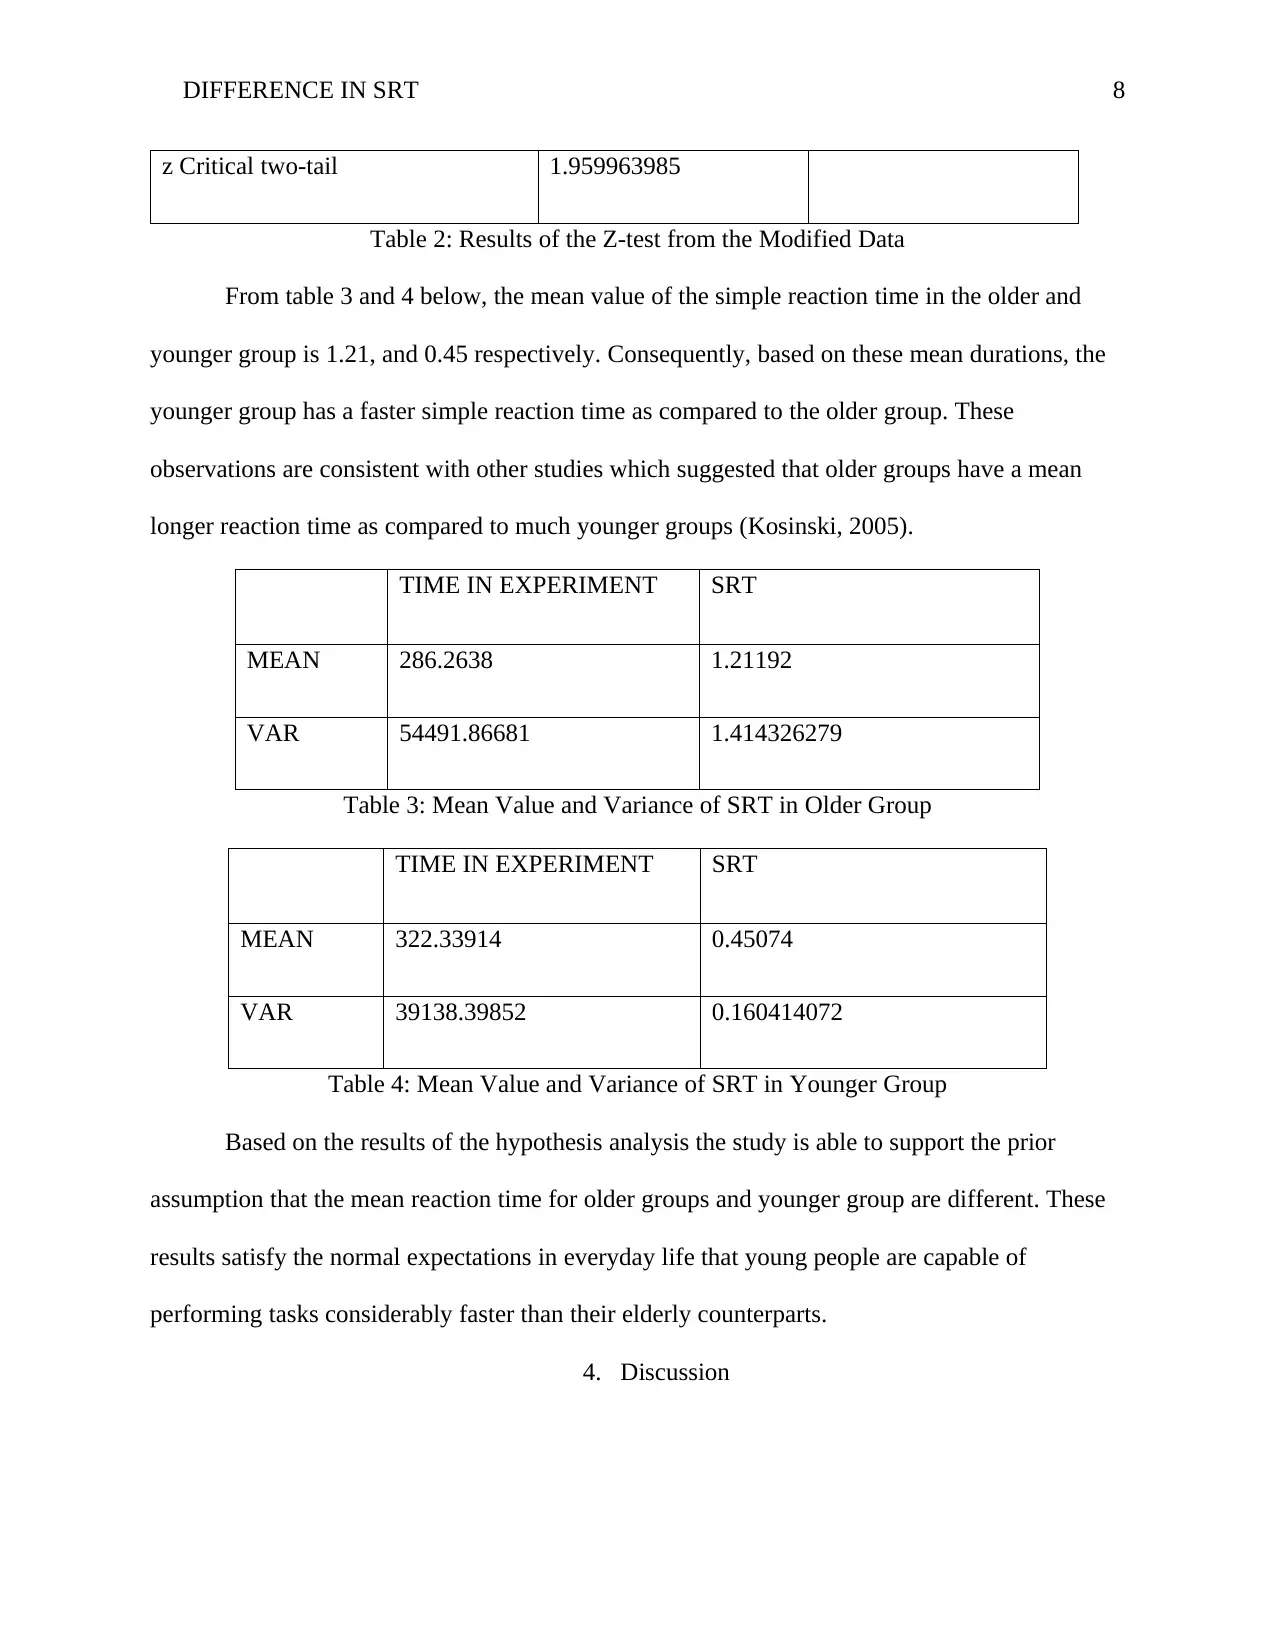
z Critical two-tail 1.959963985
Table 2: Results of the Z-test from the Modified Data
From table 3 and 4 below, the mean value of the simple reaction time in the older and
younger group is 1.21, and 0.45 respectively. Consequently, based on these mean durations, the
younger group has a faster simple reaction time as compared to the older group. These
observations are consistent with other studies which suggested that older groups have a mean
longer reaction time as compared to much younger groups (Kosinski, 2005).
TIME IN EXPERIMENT SRT
MEAN 286.2638 1.21192
VAR 54491.86681 1.414326279
Table 3: Mean Value and Variance of SRT in Older Group
TIME IN EXPERIMENT SRT
MEAN 322.33914 0.45074
VAR 39138.39852 0.160414072
Table 4: Mean Value and Variance of SRT in Younger Group
Based on the results of the hypothesis analysis the study is able to support the prior
assumption that the mean reaction time for older groups and younger group are different. These
results satisfy the normal expectations in everyday life that young people are capable of
performing tasks considerably faster than their elderly counterparts.
4. Discussion
DIFFERENCE IN SRT 9
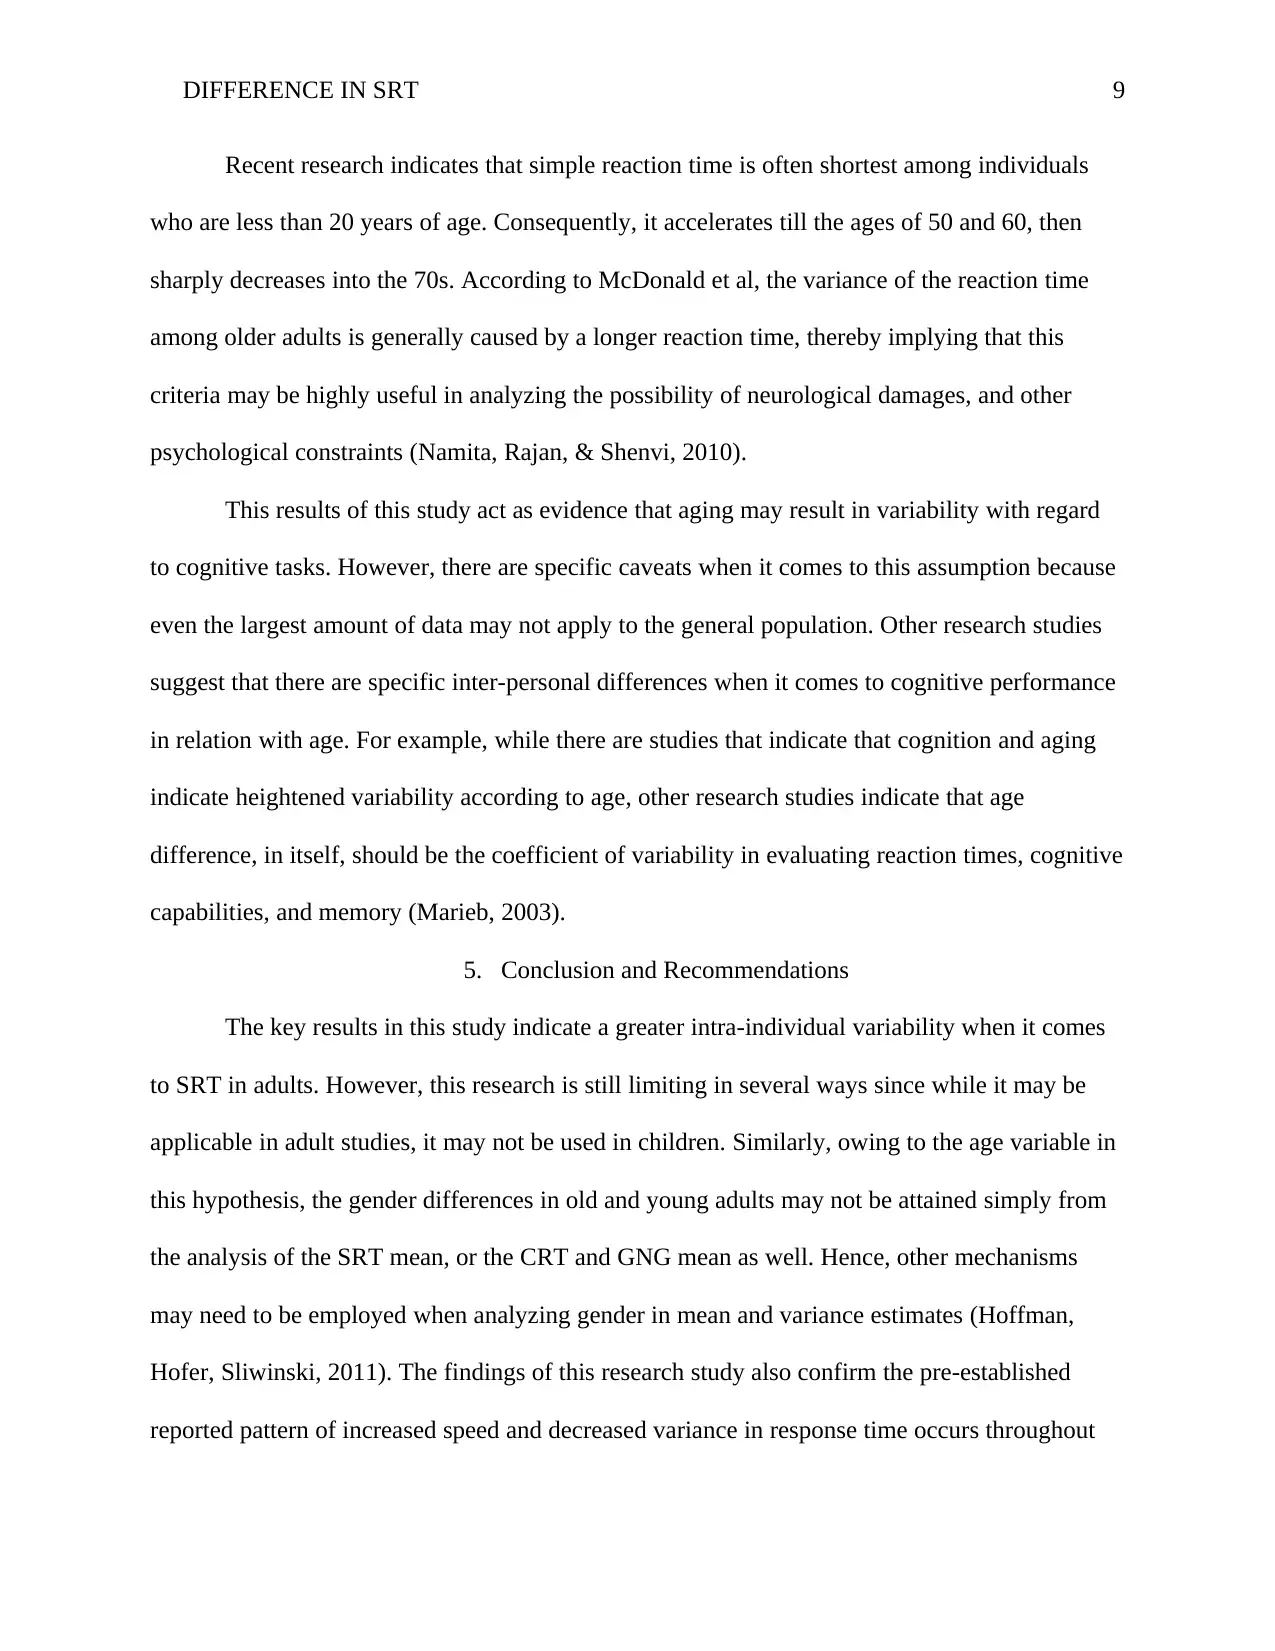
Recent research indicates that simple reaction time is often shortest among individuals
who are less than 20 years of age. Consequently, it accelerates till the ages of 50 and 60, then
sharply decreases into the 70s. According to McDonald et al, the variance of the reaction time
among older adults is generally caused by a longer reaction time, thereby implying that this
criteria may be highly useful in analyzing the possibility of neurological damages, and other
psychological constraints (Namita, Rajan, & Shenvi, 2010).
This results of this study act as evidence that aging may result in variability with regard
to cognitive tasks. However, there are specific caveats when it comes to this assumption because
even the largest amount of data may not apply to the general population. Other research studies
suggest that there are specific inter-personal differences when it comes to cognitive performance
in relation with age. For example, while there are studies that indicate that cognition and aging
indicate heightened variability according to age, other research studies indicate that age
difference, in itself, should be the coefficient of variability in evaluating reaction times, cognitive
capabilities, and memory (Marieb, 2003).
5. Conclusion and Recommendations
The key results in this study indicate a greater intra-individual variability when it comes
to SRT in adults. However, this research is still limiting in several ways since while it may be
applicable in adult studies, it may not be used in children. Similarly, owing to the age variable in
this hypothesis, the gender differences in old and young adults may not be attained simply from
the analysis of the SRT mean, or the CRT and GNG mean as well. Hence, other mechanisms
may need to be employed when analyzing gender in mean and variance estimates (Hoffman,
Hofer, Sliwinski, 2011). The findings of this research study also confirm the pre-established
reported pattern of increased speed and decreased variance in response time occurs throughout
⊘ This is a preview!⊘
Do you want full access?
Subscribe today to unlock all pages.
Trusted by 1+ million students worldwide
DIFFERENCE IN SRT 10
adulthood, and starts to decrease as one enters old age (Herlizt, & Loven, 2009). Hence, a simple
SRT task may be used when analyzing human deteriorations brought about by age. As such, until
more information is acquired regarding the variance and mean of reaction times, various
methods, as seen in this study, should be employed in parallel to strengthen findings regarding
reaction times.
References
Cohen, J. (1969). Statistical Power Analysis for the behavioral sciences (5 ed.). New York:
Academic Press.
Herlitz, A., & Love'n, J. (2009). Sex differences in cognitive functions. Acta Psychologica
Sinica, 41(1), 1081-1090.
Hodgkins, J. (2013). Reaction Time and Speed of Movement in Males and Females of Various
Ages Pages. Journal Research Quarterly, 1(1), 335-343.
Hoffman, L., Hofer, S., & Sliwinski, M. (2011). On the confounds among retest gains and age-
cohort differences in the estimation of within-person change in longitudinal studies: A
simulation study. Psychology and Aging, 1(1), 1-10.
Kosinski, R. J. (2005). A Literature Review of Reaction Time. Retrieved May 3, 2019, from
BIAE: http://biae.clemson.edu/bpc/bp/Lab/110/reaction.htm#Arousal
MacDonald, S., Nyberg, L., Sandblom, J., Fischer, H., & Backman, L. (2009). Increased
response-time variability is associated with reduced inferior parietal activation during
episodic recognition in aging. Journal of Cognitive Neuroscience, 20(5), 779-787.
Marieb, E. (2003). Exercise 22 Human Reflex Physiology, Activity 9: Testing Reaction Time for
Basic and Acquired Reflexes. In E. Marieb, Human Anatomy and Physiology Labortory
Paraphrase This Document
Need a fresh take? Get an instant paraphrase of this document with our AI Paraphraser
DIFFERENCE IN SRT 11
Manual (7 ed., pp. 232-233). San Francisco, California: Benjamin Cummings.
Namita, D., Rajan, D., & Shenvi, A. (2010). A comparative study of auditory and visual reaction
time in males and females staff during shift duty in the hospital. Biomedical research
2010, 21(2), 199-203.
Quirk, T. (2016). Excel 2016 for Educational and Psychological Statistics: A Guide to Solving
Practical Problems (1 ed.). New York: Springer.
Surhone, L., Timpledon, M., & Marseken, S. (2010). Z-test. London: VDM Publishing.
Vasishth, S., & Broe, M. (2011). The foundations of statistics: A simulation-based approach (1
ed.). Berlin: Springer.
Watt, R., & Collins, E. (2010). Statistics for Psychology: A Guide for Beginners (and everyone
else) (1 ed.). London: SAGE Publishing.
Webber, S., & Porter, M. (2010). Effects of ankle power training on movement time in mobility-
impaired older women. Medicl Science of Sports Exercises, 42(7), 1233-1240.
Woodworth, R., & Schlosberg, H. (1954). Experimental psychology (10 ed.). New York: Holt.
DIFFERENCE IN SRT 12
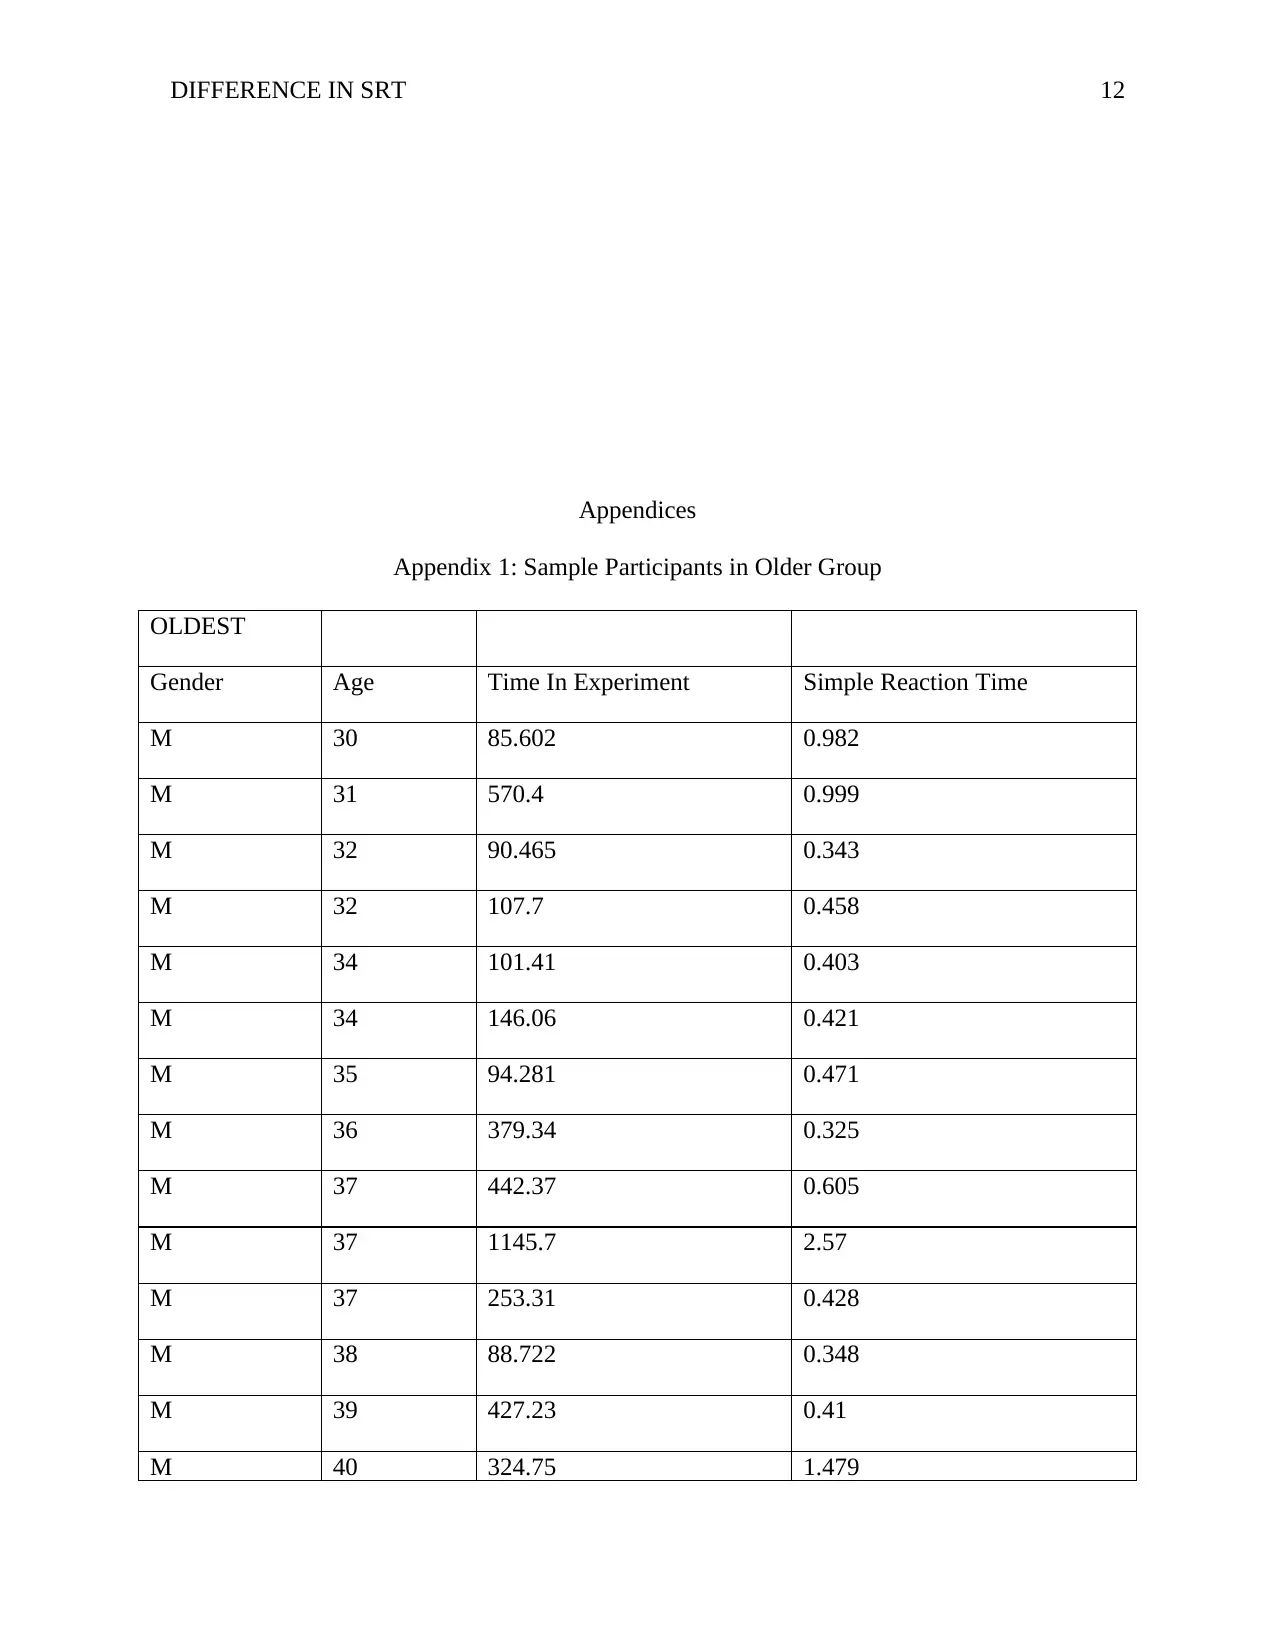
Appendices
Appendix 1: Sample Participants in Older Group
OLDEST
Gender Age Time In Experiment Simple Reaction Time
M 30 85.602 0.982
M 31 570.4 0.999
M 32 90.465 0.343
M 32 107.7 0.458
M 34 101.41 0.403
M 34 146.06 0.421
M 35 94.281 0.471
M 36 379.34 0.325
M 37 442.37 0.605
M 37 1145.7 2.57
M 37 253.31 0.428
M 38 88.722 0.348
M 39 427.23 0.41
M 40 324.75 1.479
⊘ This is a preview!⊘
Do you want full access?
Subscribe today to unlock all pages.
Trusted by 1+ million students worldwide
1 out of 18
Related Documents


Your All-in-One AI-Powered Toolkit for Academic Success.
+13062052269
info@desklib.com
Available 24*7 on WhatsApp / Email
![[object Object]](/_next/static/media/star-bottom.7253800d.svg)
Unlock your academic potential
Copyright © 2020–2026 A2Z Services. All Rights Reserved. Developed and managed by ZUCOL.