Advanced Financial Accounting Assignment: Singapore Airlines Analysis
VerifiedAdded on 2020/05/28
|19
|3447
|48
Report
AI Summary
This report presents a comprehensive financial analysis of Singapore Airlines, focusing on its performance during the 2016-17 period. The analysis includes horizontal and vertical analysis of the profit and loss account and balance sheet, revealing trends in sales, cost of goods sold, and assets. The report assesses the economic condition of the company within the airline industry, projecting future growth and contribution to the Singapore economy. Profitability analysis is conducted using various ratios, comparing them to industry averages, and highlighting areas for improvement in gross margin, net profit margin, and return on assets. Dividend policies and related ratios are examined, showing dividend yield and payout trends. Stability and liquidity ratios, such as debt-to-equity and current ratios, are evaluated to assess the company's financial risk. Efficiency ratios, including asset turnover and inventory turnover, are analyzed to gauge operational effectiveness. The report compares Singapore Airlines' performance with industry benchmarks and assesses the asset value per share and market price. Non-financial parameters are also considered, highlighting the company's brand strength and market position. The report concludes with insights into the company's overall financial health and strategic position.
Paraphrase This Document
Need a fresh take? Get an instant paraphrase of this document with our AI Paraphraser
1
By student name
Professor
University
Date: 07 January 2018.
1 | P a g e
By student name
Professor
University
Date: 07 January 2018.
1 | P a g e
2
Contents
ssSection A:.................................................................................................................................................3
Introduction.................................................................................................................................................3
Horizontal and Vertical Analysis..................................................................................................................3
Economic condition of the company...........................................................................................................6
Profitability Analysis and Ratios...................................................................................................................7
Dividend of the company and related ratios...............................................................................................9
Stability and liquidity ratios.......................................................................................................................10
Efficiency ratios.........................................................................................................................................12
Comparison with the industry average......................................................................................................13
Asset value per share and current market price........................................................................................13
Non Financial parameters..........................................................................................................................14
Section B:...................................................................................................................................................15
References.................................................................................................................................................17
2 | P a g e
⊘ This is a preview!⊘
Do you want full access?
Subscribe today to unlock all pages.
Trusted by 1+ million students worldwide
3
Section A:
Introduction
In the given report, financial analysis needs ot be done for one of the Singapore company for financial as
well as non financial factors. The company chosen here is Singapore Airlines and the annual report
considered here is of 2016-17. It is one of the biggest company in Singapore and is listed on the
Singapore Stock Exchange. It sis ranked in top 15 carriers worldwide in trms of revenue from passenger
kilometres and 10th in terms of carriage of international passengers. It has a fleet size of 113 planes and
has tehmarket capitalization of $ 14 Bn, being 2nd in the world (Belton, 2017). It is headquartered at
Singapore Changi Airport. It has operations across 9 countries and has 64 destinations to work with. The
turnover of the company in the year 2016-17 was $ 14,868 Mn with a profit of $ 518 Mn. The number of
employees working with the company are 24,574 as reported last time. Furthermore, the company’s
competitors include mainly Japan Airlines Co. Ltd., Malaysian Airline System Berhad and Cathay Pacific
Airways Limited. The company’s main competitor is coming in terms of services provided in the major
cities and the fleet at offer for all these companies. The main business of the company includes
providing domestic and international carrier services to the passenger (Bizfluent, 2017).
Horizontal and Vertical Analysis
The horizontal analysis of the company’s profit and loss account and the balance sheet has been shown
below:
3 | P a g e
Paraphrase This Document
Need a fresh take? Get an instant paraphrase of this document with our AI Paraphraser
4
Balance Sheet
Balance Sheet as of: 2012-13 2013-14 2014-15 2015-16 2016-17
Currency SGD SGD SGD SGD SGD
ASSETS
Cash And Equivalents 5,059.6 4,883.9 5,042.7 3,972.4 3,380.5
Short Term Investments 365.5 303.4 184.1 684.0 556.0
Trading Asset Securities 2.2 3.2 - - -
Total Cash & ST Investments 5,427.3 5,190.5 5,226.8 4,656.4 3,936.5
Accounts Receivable 1,578.4 1,604.7 1,491.5 1,221.8 1,144.6
Other Receivables 38.8 34.1 23.3 48.1 77.1
Notes Receivable - - - 62.0 -
Total Receivables 1,617.2 1,638.8 1,514.8 1,331.9 1,221.7
Inventory 274.9 243.0 202.0 181.9 178.4
Prepaid Exp. 103.2 107.5 124.6 132.4 211.0
Other Current Assets 76.9 130.9 184.7 491.4 152.4
Total Current Assets 7,499.5 7,310.7 7,252.9 6,794.0 5,700.0
Gross Property, Plant & Equipment 21,805.2 21,367.6 21,869.8 22,715.8 24,552.6
Accumulated Depreciation (10,424.6) (10,781.6) (11,392.5) (11,740.2) (12,870.9)
Net Property, Plant & Equipm ent 11,380.6 10,586.0 10,477.3 10,975.6 11,681.7
Long-term Investments 1,382.1 1,981.1 2,017.7 1,831.3 1,622.8
Goodw ill - - 163.8 170.4 170.4
Other Intangibles 131.1 165.3 266.4 276.7 181.0
Deferred Charges, LT 45.9 50.0 56.7 58.2 58.4
Other Long-Term Assets 1,988.9 2,549.4 3,686.8 3,740.4 5,305.7
Total Assets 22,428.1 22,642.5 23,921.6 23,846.6 24,720.0
LIABILITIES
Accounts Payable 3,055.7 2,977.9 2,906.5 2,848.2 3,261.9
Short-term Borrow ings 5.7 8.2 93.0 190.4 18.3
Curr. Port. of LT Debt 6.8 2.6 300.5 - -
Curr. Port. of Cap. Leases 67.8 52.5 54.1 21.5 23.7
Curr. Income Taxes Payable 160.1 201.1 161.9 191.9 80.3
Unearned Revenue, Current 1,966.8 2,019.2 2,077.2 2,295.6 2,342.1
Other Current Liabilities 138.7 129.9 1,047.2 939.6 562.3
Total Current Liabilities 5,401.6 5,391.4 6,640.4 6,487.2 6,288.6
Long-Term Debt 800.0 813.6 1,247.2 1,112.7 1,525.8
Capital Leases 140.6 90.7 45.2 22.9 -
Pension & Other Post-Retire. Benefits 163.7 169.6 129.7 129.3 131.2
Def. Tax Liability, Non-Curr. 1,948.2 1,788.9 1,599.6 1,681.7 1,890.5
Other Non-Current Liabilities 571.9 813.7 1,329.4 1,279.9 1,413.7
Total Liabilities 9,026.0 9,067.9 10,991.5 10,713.7 11,249.8
Common Stock 1,856.1 1,856.1 1,856.1 1,856.1 1,856.1
Additional Paid In Capital - - - - -
Retained Earnings 11,460.1 11,527.0 11,446.6 11,935.5 11,838.8
Treasury Stock (269.8) (262.2) (326.3) (381.5) (194.7)
Comprehensive Inc. and Other 43.1 116.3 (512.8) (655.4) (417.2)
Total Comm on Equity 13,089.5 13,237.2 12,463.6 12,754.7 13,083.0
Minority Interest 312.6 337.4 466.5 378.2 387.2
Total Equity 13,402.1 13,574.6 12,930.1 13,132.9 13,470.2
Total Liabilities And Equity 22,428.1 22,642.5 23,921.6 23,846.6 24,720.0
Singapore Airlines Limited (SGX:C6L) > Balance Sheet
4 | P a g e
5
I ncome Statement
For the Fiscal Period Ending 2012-13 2013-14 2014-15 2015-16 2016-17
Currency SGD SGD SGD SGD SGD
Revenue 15,098.2 15,243.9 15,565.5 15,238.7 14,868.5
Other Revenue - - - - -
Total Revenue 15,098.2 15,243.9 15,565.5 15,238.7 14,868.5
Cost Of Goods Sold 12,251.3 12,317.0 12,307.0 11,702.2 11,226.1
Gross Profit 2,846.9 2,926.9 3,258.5 3,536.5 3,642.4
Selling General & Admin Exp. 608.1 645.7 679.0 698.9 736.1
R & D Exp. - - - - -
Depreciation & Amort. 1,589.1 1,575.5 1,538.8 1,543.0 1,552.1
Amort. of Goodw ill and Intangibles 22.7 25.7 25.9 32.7 39.8
Other Operating Expense/(Income) 372.2 372.2 594.7 492.7 718.2
Other Operating Exp., Total 2,592.1 2,619.1 2,838.4 2,767.3 3,046.2
Operating Incom e 254.8 307.8 420.1 769.2 596.2
Interest Expense (32.0) (28.6) (47.5) (49.7) (45.0)
Interest and Invest. Income 92.5 82.3 88.1 186.0 118.9
Net Interest Exp. 60.5 53.7 40.6 136.3 73.9
Income/(Loss) from Affiliates 145.3 48.8 (77.1) 11.7 (42.1)
Currency Exchange Gains (Loss) (15.8) (28.3) (9.2) (77.4) 30.5
Other Non-Operating Inc. (Exp.) (10.4) (8.7) (2.1) 22.3 (23.8)
EBT Excl. Unusual Item s 434.4 373.3 372.3 862.1 634.7
Restructuring Charges - (29.4) 2.1 - -
Impairment of Goodw ill - - - - -
Gain (Loss) On Sale Of Invest. 8.3 - (3.1) (11.1) 9.3
Gain (Loss) On Sale Of Assets 56.6 53.1 59.9 24.6 109.7
Asset Writedow n (9.8) (313.6) (30.5) (22.3) (123.3)
Legal Settlements (19.9) (87.0) (24.1) 119.1 (111.8)
Other Unusual Items - 371.5 66.3 - -
EBT Incl. Unusual Item s 469.6 367.9 442.9 972.4 518.6
Income Tax Expense 28.0 (56.5) 36.2 120.6 76.7
Earnings from Cont. Ops. 441.6 424.4 406.7 851.8 441.9
Earnings of Discontinued Ops. - - - - -
Extraord. Item & Account. Change - - - - -
Net Incom e to Company 441.6 424.4 406.7 851.8 441.9
Minority Int. in Earnings (62.7) (64.9) (38.8) (47.4) (81.5)
Net Incom e 378.9 359.5 367.9 804.4 360.4
Singapore Airlines Ltd > I ncome Statement
5 | P a g e
⊘ This is a preview!⊘
Do you want full access?
Subscribe today to unlock all pages.
Trusted by 1+ million students worldwide
6
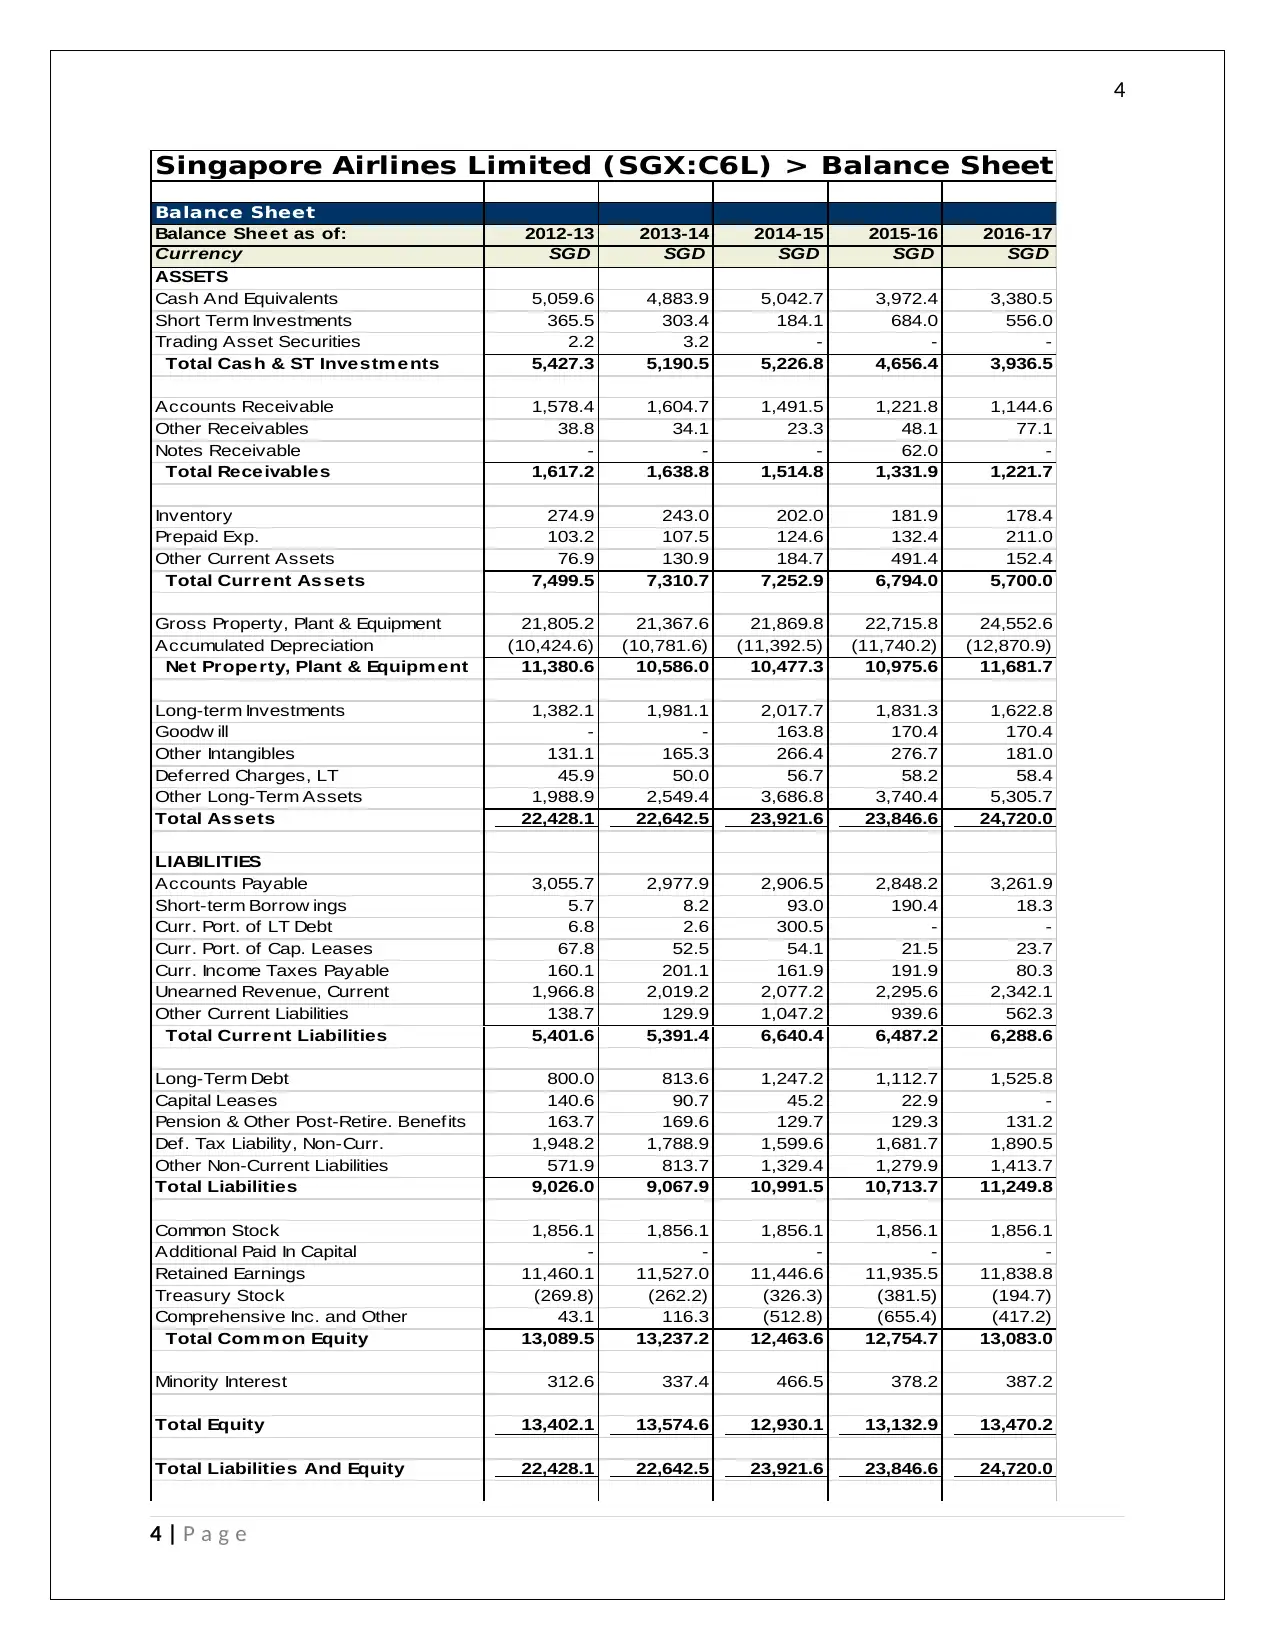
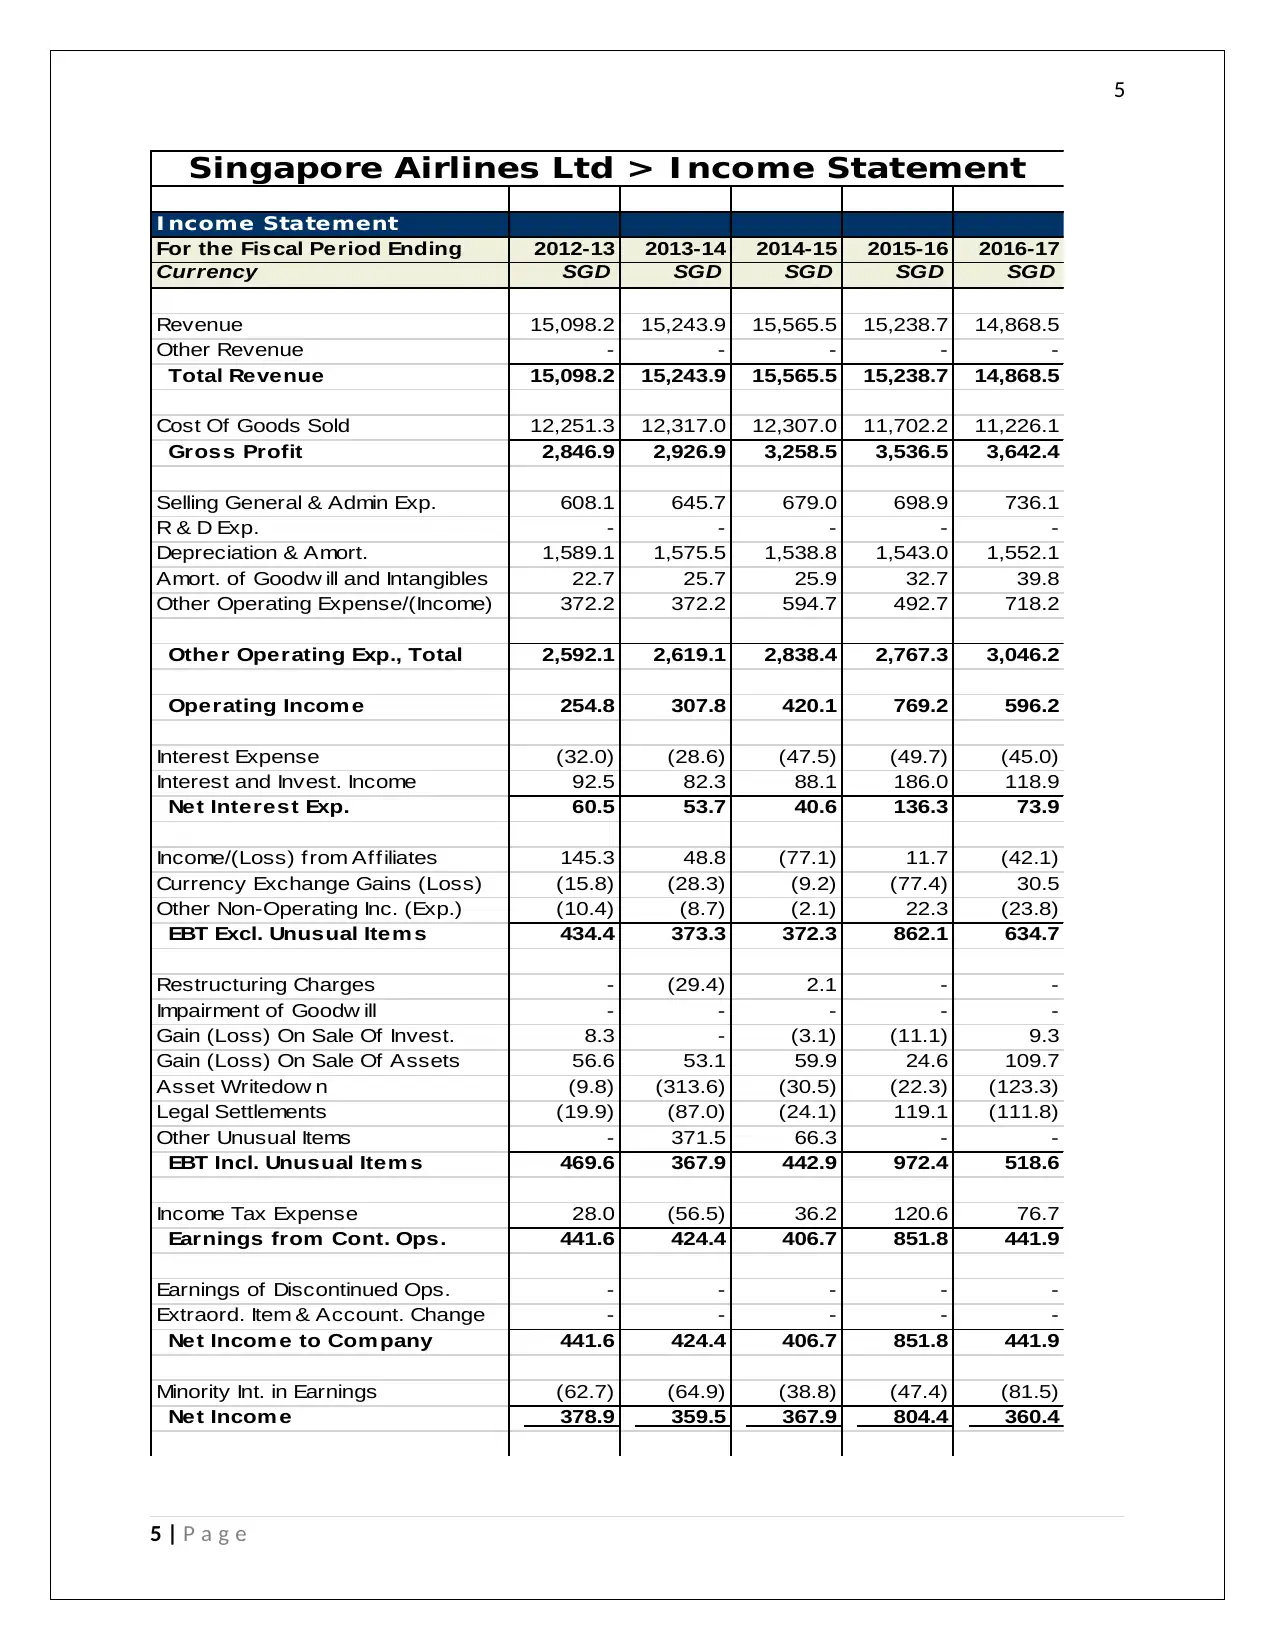
From the above analysis on the profit and loss account and balance sheet for the past 5 years, it is
evident that the sales of the company has been constantly increasing. The cost of goods sold has also
been constantly increasing and therefore the net profit of the company has been constant over the
years (Alexander, 2016). On the assets front, the current asset has been on the increasing side
particularly the cash and cash equivalents and accounts receivables. The PPE has been on the decreasing
trend and in totality the overall assets have declined. The accounts payable has been on the decreasing
trend but the equity has been constant. Over the liabilities have also declined.
Economic condition of the company
In terms of the economic condition of the company, the Singapore Airline has been on constanat terms
in terms of sales and profits. Even though it is not growing, but it can be said that the company is
performing well in terms of crises and depression in the market (Chongsoo, et al., 2017). Howevr, as per
the experts analysis, the future of the airline industry in Singapore is on a high in the coming 20 years
and it is expected to oupace many other neighbouring countries and areas. It is also expected to
generate double digit growth rate and to increase employment in the coming future. It is expected to
contribute nearly $ 88 Bn to the Singapore economy by 2035.
6 | P a g e
Paraphrase This Document
Need a fresh take? Get an instant paraphrase of this document with our AI Paraphraser
7
Profitability Analysis and Ratios
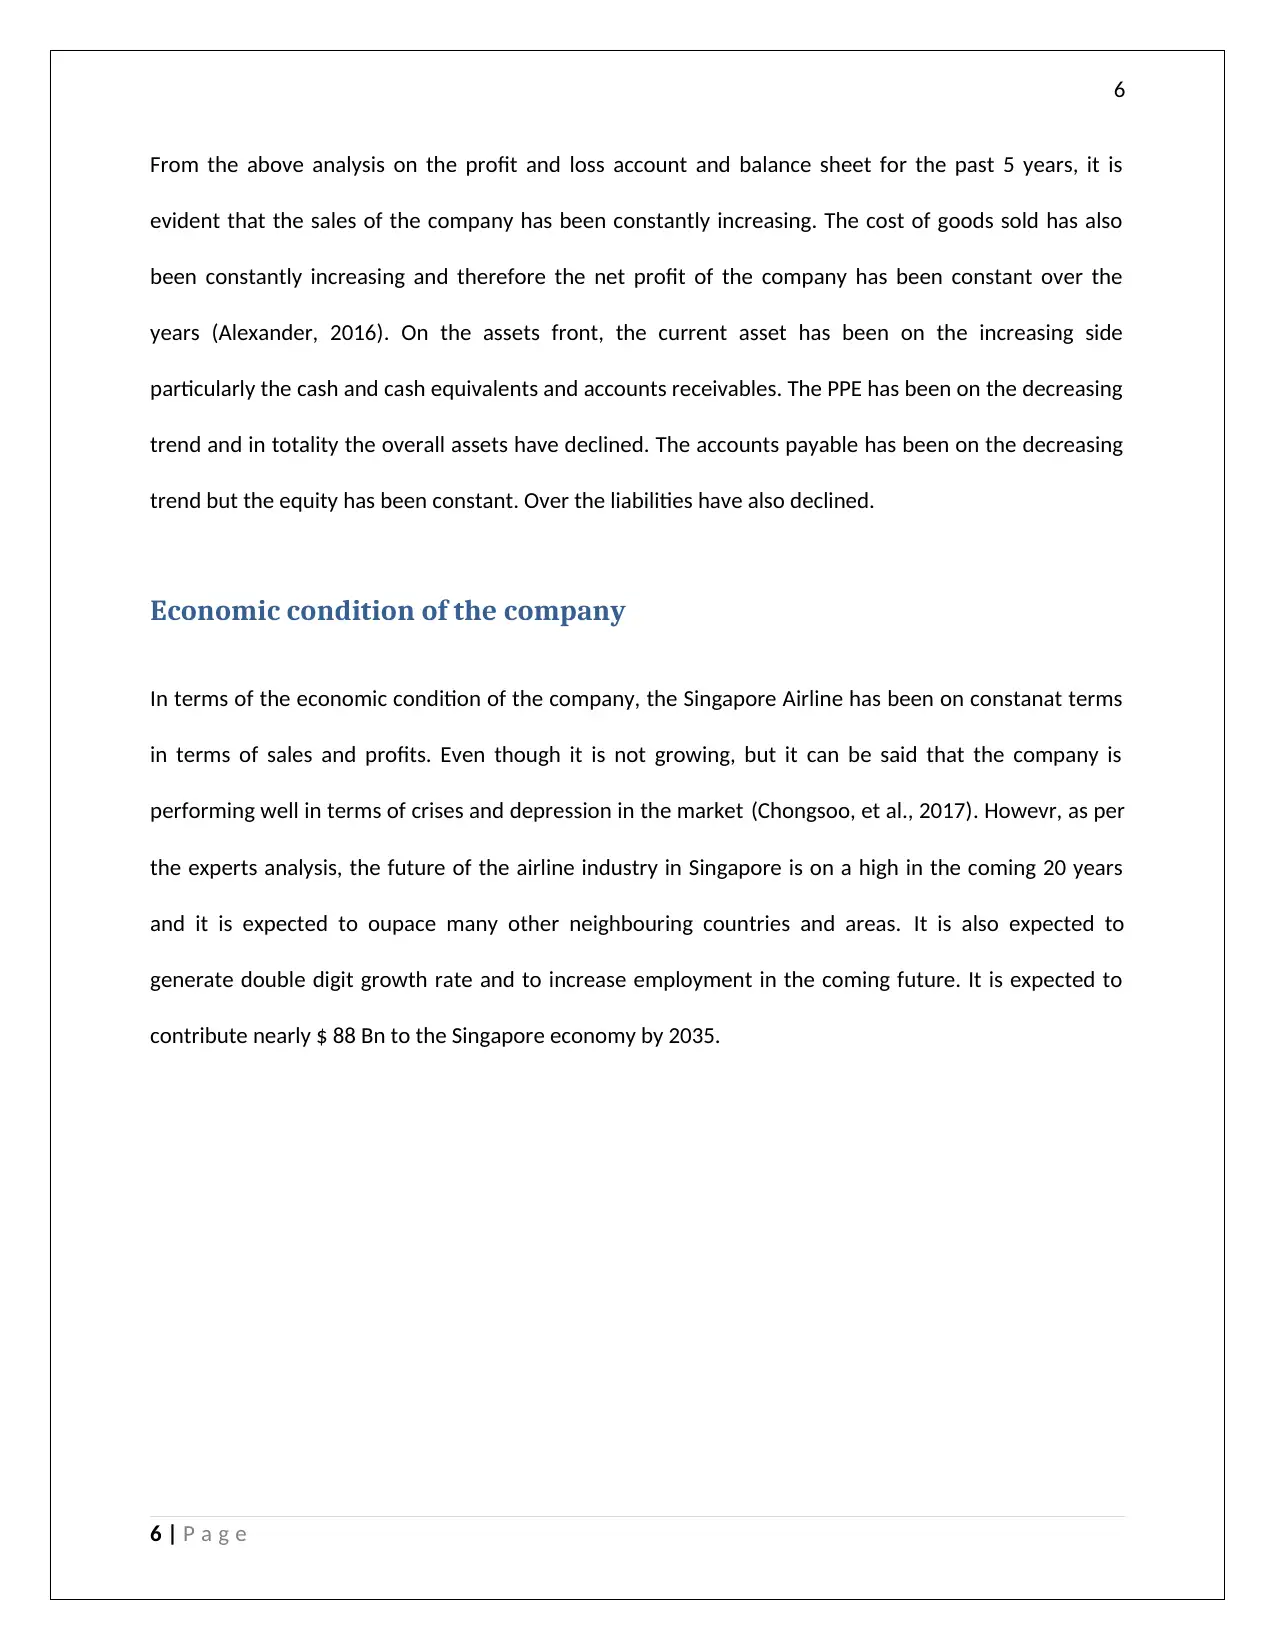
The below table shows the profitability analysis of the company using ratios over the past couple of
years. The table also incorporates the comparison with the industry trend.
Singapore Airlines Limited (SGX:C6L) > Ratios
Ratios
For the Fiscal Period Ending
2012-
13 2013-14
2014-
15 2015-16
2016-
17 Industry Ratios
Profitability
Gross Margin % 18.9% 19.2% 20.9% 23.2% 24.5% 70-72%
Net Income Margin % 2.5% 2.4% 2.4% 5.3% 2.4% 8-9%
Return on Assets % 0.7% 0.9% 1.1% 2.0% 1.5% 5-8%
Return on Equity % 3.3% 3.1% 3.1% 6.5% 3.3% 20-25%
EBITDA Margin % (Operating
Ratio)
12.2% 12.4% 12.6% 15.2% 14.5% 20-22%
2012-13 2013-14 2014-15 2015-16 2016-17 Industry Ratios
0
0.05
0.1
0.15
0.2
0.25
0.3
Chart Title
Profitability Gross Margin %
Net Income Margin % Return on Assets %
Return on Equity % EBITDA Margin % (Operating Ratio)
The above table depicts that the gross margin has been growing year on year from 18.9% in 2012 to
24.5% in 2017 however the same is still below the industry trend of 70-72% and hence the company
needs to work on the same. The net profit margin of the company has been fairly constant at 2.5% and
is well below the industry average of 8-9% (Das, 2017). This is mainly on account of the increased
depreciation and indirect expenses which is taking away major chunk of the profits. The return on assets
7 | P a g e
Profitability Analysis and Ratios
The below table shows the profitability analysis of the company using ratios over the past couple of
years. The table also incorporates the comparison with the industry trend.
Singapore Airlines Limited (SGX:C6L) > Ratios
Ratios
For the Fiscal Period Ending
2012-
13 2013-14
2014-
15 2015-16
2016-
17 Industry Ratios
Profitability
Gross Margin % 18.9% 19.2% 20.9% 23.2% 24.5% 70-72%
Net Income Margin % 2.5% 2.4% 2.4% 5.3% 2.4% 8-9%
Return on Assets % 0.7% 0.9% 1.1% 2.0% 1.5% 5-8%
Return on Equity % 3.3% 3.1% 3.1% 6.5% 3.3% 20-25%
EBITDA Margin % (Operating
Ratio)
12.2% 12.4% 12.6% 15.2% 14.5% 20-22%
2012-13 2013-14 2014-15 2015-16 2016-17 Industry Ratios
0
0.05
0.1
0.15
0.2
0.25
0.3
Chart Title
Profitability Gross Margin %
Net Income Margin % Return on Assets %
Return on Equity % EBITDA Margin % (Operating Ratio)
The above table depicts that the gross margin has been growing year on year from 18.9% in 2012 to
24.5% in 2017 however the same is still below the industry trend of 70-72% and hence the company
needs to work on the same. The net profit margin of the company has been fairly constant at 2.5% and
is well below the industry average of 8-9% (Das, 2017). This is mainly on account of the increased
depreciation and indirect expenses which is taking away major chunk of the profits. The return on assets
7 | P a g e
8
as well as the return on equity has been well below the industry average indicating the slowness of the
company. The company therefore needs to work out on increasing the return to the shareholders and
investors such that the funding is not affected. Finally, the operating margin of the company is the range
of 12-14%, which is again well below the industry average of 20-22%. This again is due to the increased
amortization, depreciation and interest expenses on the loan that the company has taken (DeZoort &
Harrison, 2016).
8 | P a g e
⊘ This is a preview!⊘
Do you want full access?
Subscribe today to unlock all pages.
Trusted by 1+ million students worldwide
9
Dividend of the company and related ratios
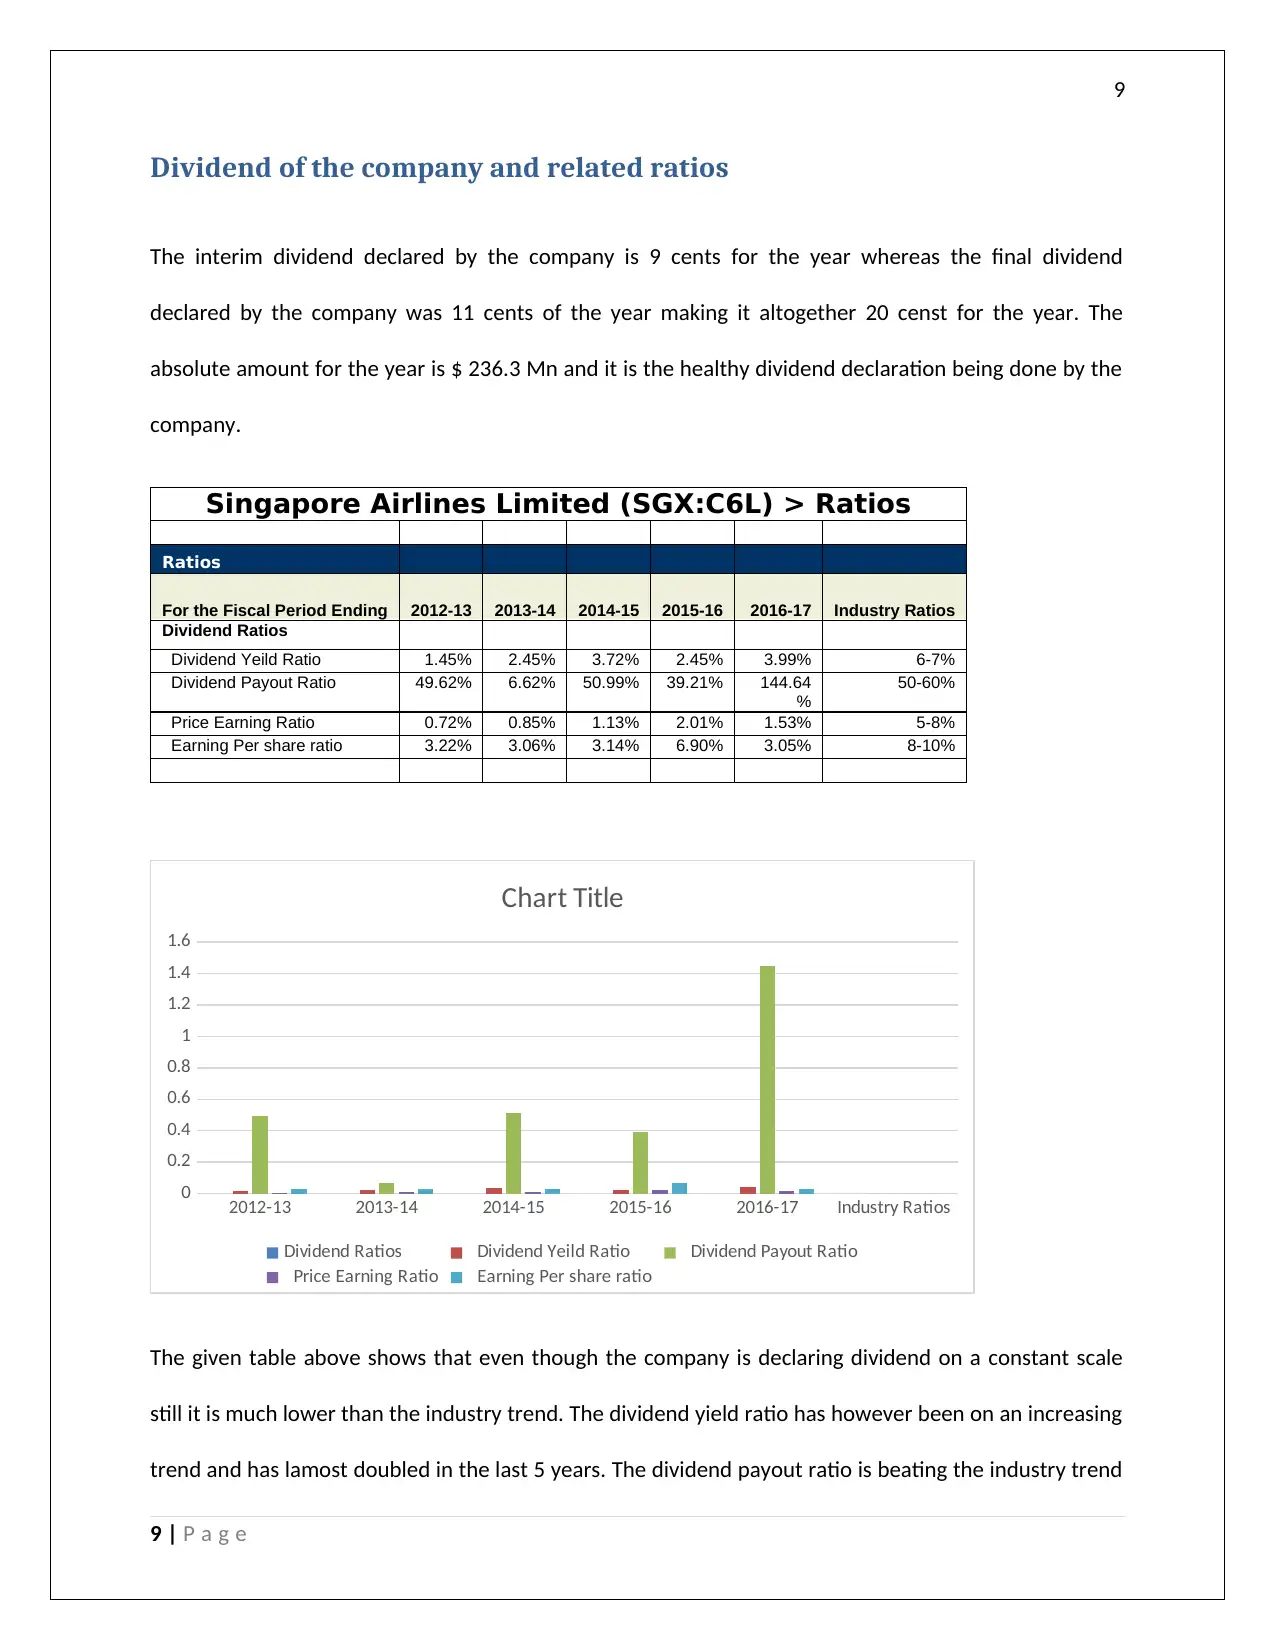
The interim dividend declared by the company is 9 cents for the year whereas the final dividend
declared by the company was 11 cents of the year making it altogether 20 censt for the year. The
absolute amount for the year is $ 236.3 Mn and it is the healthy dividend declaration being done by the
company.
Singapore Airlines Limited (SGX:C6L) > Ratios
Ratios
For the Fiscal Period Ending 2012-13 2013-14 2014-15 2015-16 2016-17 Industry Ratios
Dividend Ratios
Dividend Yeild Ratio 1.45% 2.45% 3.72% 2.45% 3.99% 6-7%
Dividend Payout Ratio 49.62% 6.62% 50.99% 39.21% 144.64
%
50-60%
Price Earning Ratio 0.72% 0.85% 1.13% 2.01% 1.53% 5-8%
Earning Per share ratio 3.22% 3.06% 3.14% 6.90% 3.05% 8-10%
2012-13 2013-14 2014-15 2015-16 2016-17 Industry Ratios
0
0.2
0.4
0.6
0.8
1
1.2
1.4
1.6
Chart Title
Dividend Ratios Dividend Yeild Ratio Dividend Payout Ratio
Price Earning Ratio Earning Per share ratio
The given table above shows that even though the company is declaring dividend on a constant scale
still it is much lower than the industry trend. The dividend yield ratio has however been on an increasing
trend and has lamost doubled in the last 5 years. The dividend payout ratio is beating the industry trend
9 | P a g e
Dividend of the company and related ratios
The interim dividend declared by the company is 9 cents for the year whereas the final dividend
declared by the company was 11 cents of the year making it altogether 20 censt for the year. The
absolute amount for the year is $ 236.3 Mn and it is the healthy dividend declaration being done by the
company.
Singapore Airlines Limited (SGX:C6L) > Ratios
Ratios
For the Fiscal Period Ending 2012-13 2013-14 2014-15 2015-16 2016-17 Industry Ratios
Dividend Ratios
Dividend Yeild Ratio 1.45% 2.45% 3.72% 2.45% 3.99% 6-7%
Dividend Payout Ratio 49.62% 6.62% 50.99% 39.21% 144.64
%
50-60%
Price Earning Ratio 0.72% 0.85% 1.13% 2.01% 1.53% 5-8%
Earning Per share ratio 3.22% 3.06% 3.14% 6.90% 3.05% 8-10%
2012-13 2013-14 2014-15 2015-16 2016-17 Industry Ratios
0
0.2
0.4
0.6
0.8
1
1.2
1.4
1.6
Chart Title
Dividend Ratios Dividend Yeild Ratio Dividend Payout Ratio
Price Earning Ratio Earning Per share ratio
The given table above shows that even though the company is declaring dividend on a constant scale
still it is much lower than the industry trend. The dividend yield ratio has however been on an increasing
trend and has lamost doubled in the last 5 years. The dividend payout ratio is beating the industry trend
9 | P a g e
Paraphrase This Document
Need a fresh take? Get an instant paraphrase of this document with our AI Paraphraser
10
in the recent times and has declared 144% in the last year (Farmer, 2018). The Price earning ratio shows
how much the investors are willing to pay for the shares of the company as a percentage of the earnings
per share. The earnings per share on the other hand is profit available for the equity shareholders
divided by the number of the shares. The same has been fairly constant in the last few years and is near
to 3%.
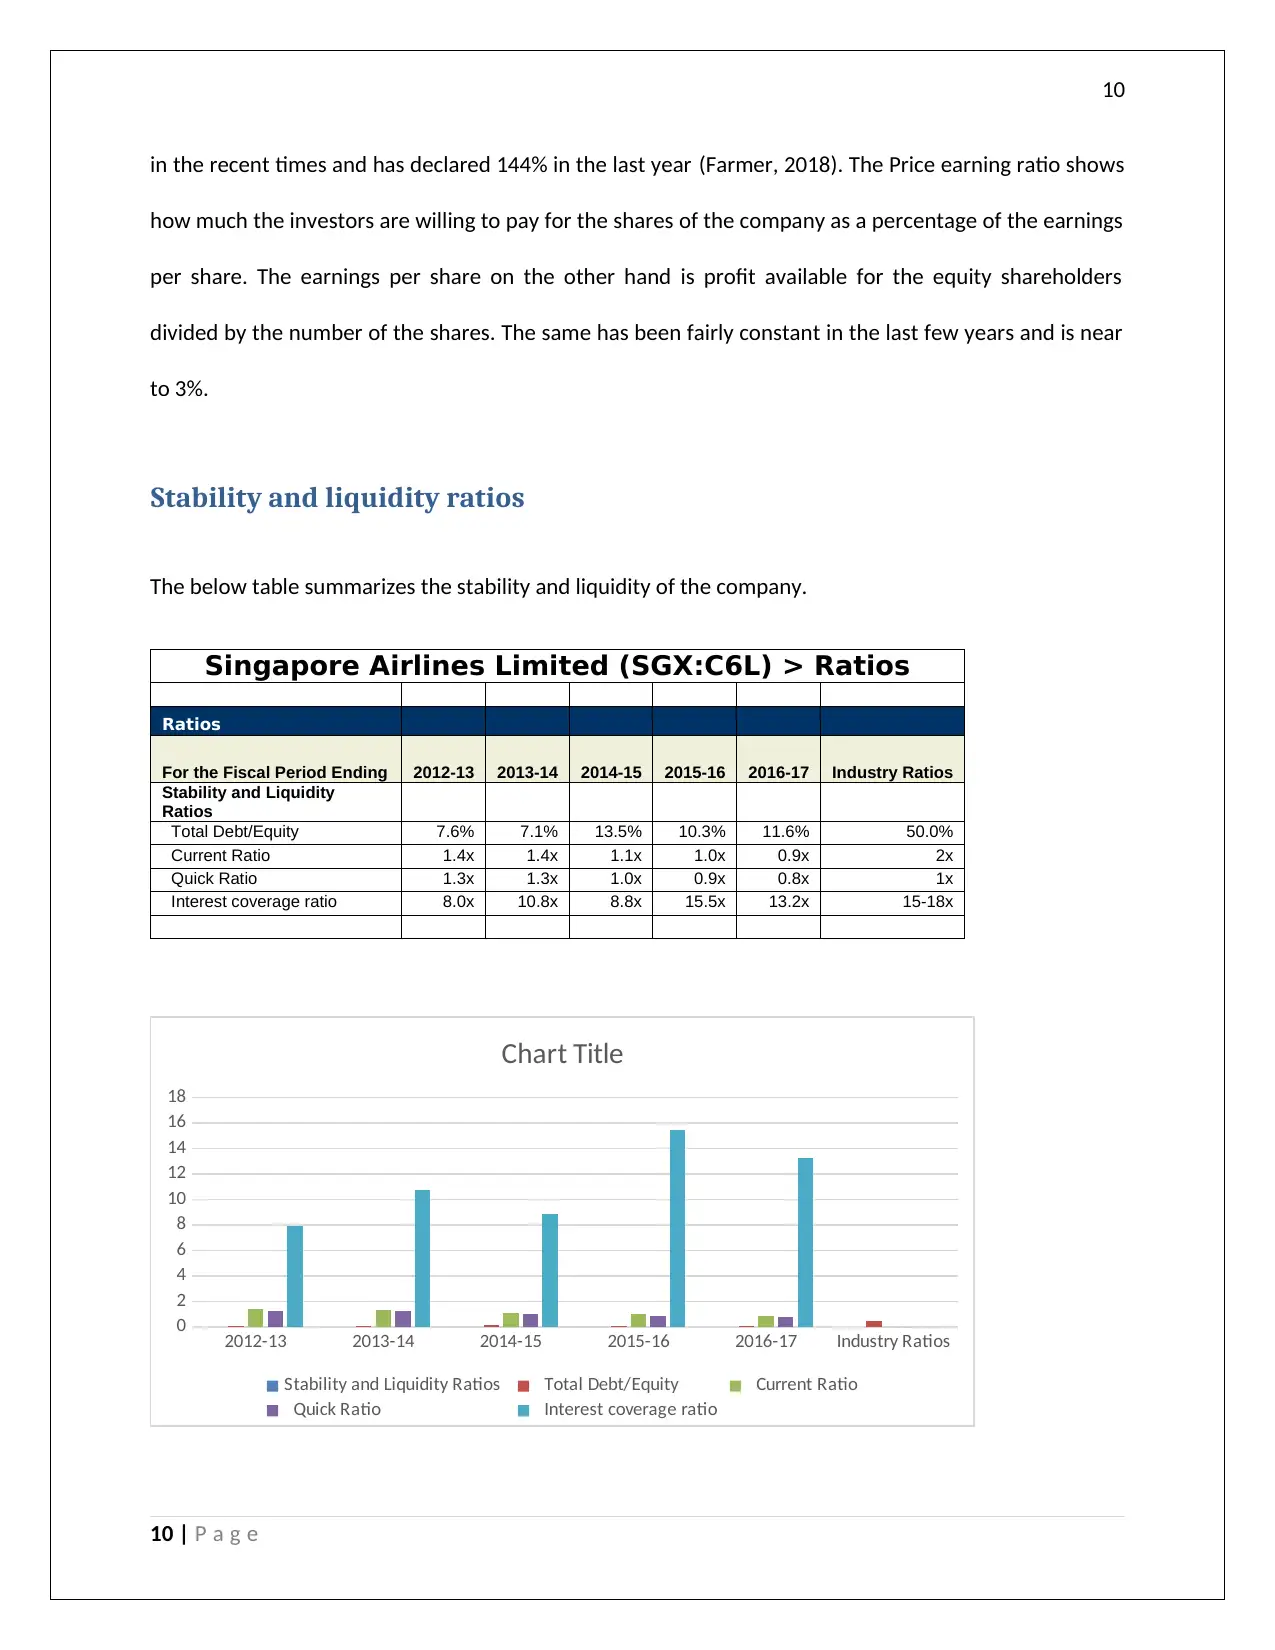
Stability and liquidity ratios
The below table summarizes the stability and liquidity of the company.
Singapore Airlines Limited (SGX:C6L) > Ratios
Ratios
For the Fiscal Period Ending 2012-13 2013-14 2014-15 2015-16 2016-17 Industry Ratios
Stability and Liquidity
Ratios
Total Debt/Equity 7.6% 7.1% 13.5% 10.3% 11.6% 50.0%
Current Ratio 1.4x 1.4x 1.1x 1.0x 0.9x 2x
Quick Ratio 1.3x 1.3x 1.0x 0.9x 0.8x 1x
Interest coverage ratio 8.0x 10.8x 8.8x 15.5x 13.2x 15-18x
2012-13 2013-14 2014-15 2015-16 2016-17 Industry Ratios
0
2
4
6
8
10
12
14
16
18
Chart Title
Stability and Liquidity Ratios Total Debt/Equity Current Ratio
Quick Ratio Interest coverage ratio
10 | P a g e
in the recent times and has declared 144% in the last year (Farmer, 2018). The Price earning ratio shows
how much the investors are willing to pay for the shares of the company as a percentage of the earnings
per share. The earnings per share on the other hand is profit available for the equity shareholders
divided by the number of the shares. The same has been fairly constant in the last few years and is near
to 3%.
Stability and liquidity ratios
The below table summarizes the stability and liquidity of the company.
Singapore Airlines Limited (SGX:C6L) > Ratios
Ratios
For the Fiscal Period Ending 2012-13 2013-14 2014-15 2015-16 2016-17 Industry Ratios
Stability and Liquidity
Ratios
Total Debt/Equity 7.6% 7.1% 13.5% 10.3% 11.6% 50.0%
Current Ratio 1.4x 1.4x 1.1x 1.0x 0.9x 2x
Quick Ratio 1.3x 1.3x 1.0x 0.9x 0.8x 1x
Interest coverage ratio 8.0x 10.8x 8.8x 15.5x 13.2x 15-18x
2012-13 2013-14 2014-15 2015-16 2016-17 Industry Ratios
0
2
4
6
8
10
12
14
16
18
Chart Title
Stability and Liquidity Ratios Total Debt/Equity Current Ratio
Quick Ratio Interest coverage ratio
10 | P a g e
11
The short term financial position of the company has been above average as the company has adequate
current assets to meet its financial obligations but it still lacks the quick assest which can be readily
convertible to cash (Félix, 2017). On the other hand the company has been doing well in terms of the
long term liquidity as it has very less proportion of debt capital in its capital structure which shows that
the company has minimal interest and debt obligations to fulfil.
The above table depicts that the debt equity ratio of the company is well below the industry average of
2:1 and hence the company does not faces any risk of shortfalling the debt trap. It can instead make use
of the trading on equity in future. The current ratio and the liquid ratio of the company has been fairly
constant over the last 5 years at 1 but it has fallen in the last year implying that the company is not
having adequate current assets to cover up the current liabilities. The interest coverage ratio shows how
much profits does a company has to cover up for the interest obligations of the company (Goldmann,
2016). Since the company is doing well and also the interst obligation is very low, the company has been
able to meet up the industry trends.
11 | P a g e
⊘ This is a preview!⊘
Do you want full access?
Subscribe today to unlock all pages.
Trusted by 1+ million students worldwide
1 out of 19
Related Documents


Your All-in-One AI-Powered Toolkit for Academic Success.
+13062052269
info@desklib.com
Available 24*7 on WhatsApp / Email
![[object Object]](/_next/static/media/star-bottom.7253800d.svg)
Unlock your academic potential
Copyright © 2020–2026 A2Z Services. All Rights Reserved. Developed and managed by ZUCOL.