Analyzing Singapore's Economic Performance: 2008-2018 (ECON12)
VerifiedAdded on 2022/08/24
|14
|2864
|13
Report
AI Summary
This report provides a detailed analysis of Singapore's economic performance from 2008 to 2018, examining key macroeconomic indicators such as real GDP, unemployment rates, and inflation rates. The study delves into the trends and fluctuations of these indicators, providing insights into the country's economic growth and challenges. The report explores the causes of inflation, including demand-pull and cost-push inflation, and analyzes the types of unemployment prevalent in Singapore, such as cyclical and structural unemployment. Furthermore, the report investigates the government's policies aimed at achieving full employment, stable prices, and economic growth, assessing their effectiveness. The analysis includes supporting evidence and data visualizations, offering a comprehensive understanding of Singapore's economic landscape over the specified decade. The report concludes with an evaluation of the overall economic performance, discussing its strengths and weaknesses based on the researched evidence.
Running head: ECONOMICS
Economics
Name of the Student
Name of the University
Authors Note
Course ID
Economics
Name of the Student
Name of the University
Authors Note
Course ID
Paraphrase This Document
Need a fresh take? Get an instant paraphrase of this document with our AI Paraphraser
1ECONOMICS
Introduction:
Singapore is regarded as one of the world’s extremely wealthy nations. The country
has business friendly regulatory environment and a very less rate of unemployment.
Singapore is observed as high earnings economy with “Gross National Income of
US$54,530” per capital as of 2017. Soon after the decades of freedom, Singapore
significantly progressed from a lower-earnings state to a higher-earnings state. The growth of
GDP in state-city has been recorded among the maximum internationally at an average of
7.7% ever since the freedom and recording 9.2% during the initial 25 years (Mankiw, 2020).
Following the industrialization in 1960s, manufacturing turned out to be the chief driver of
development in Singapore. The enterprises owned by state plays a vital role in development
of Singapore economy. Exports in computer electronics, chemicals and services offers chief
source of income for economy as this enables purchase of natural resources and raw goods in
which it is deficient.
The “Singapore economy” is stared as the main attraction of “FDI outflow financier”
internationally. The country has witnessed an inward flow of FDI which has benefited the
country because of the highly investment friendly environment and steady governmental
setting. The government of Singapore has set up “Economic Development Board” in order to
lead a venture drive and make Singapore as the highly striking country for FDI. The inflows
of FDI have augmented largely over the last decade and by 2001 overseas businesses
accounted for 75% of factory-made output and 85% of the factory-made exports.
The present study is based on careful examination of Singapore’s macroeconomic
indicators to determine its economic performance over the span of last decade from 2008 to
2018. Major areas of focus will be production and “performance analysis, labour market
analysis and price level analysis”.
2ECONOMICS
Production output performance analysis
Definition and explanation of Real GDP measures:
“Real gross domestic product” is regarded as the “inflation-adjusted” measures
which imitates the worth of every products and services which is generated in an economy
inside a specified year, stated in “base year prices” and usually denoted as the “constant
price”. To measure the performance of an economy the real GDP keeps track of variations in
price levels and delivers a highly correct figure of an economic development (Goodwin et al.,
2019). The real GDP measures the total products and service of an economy in a given year
by considering the price level changes. It facilitates in comparing the GDP by year as it
considers inflation. It acts as a good indicator of where an economy is in the business cycle.
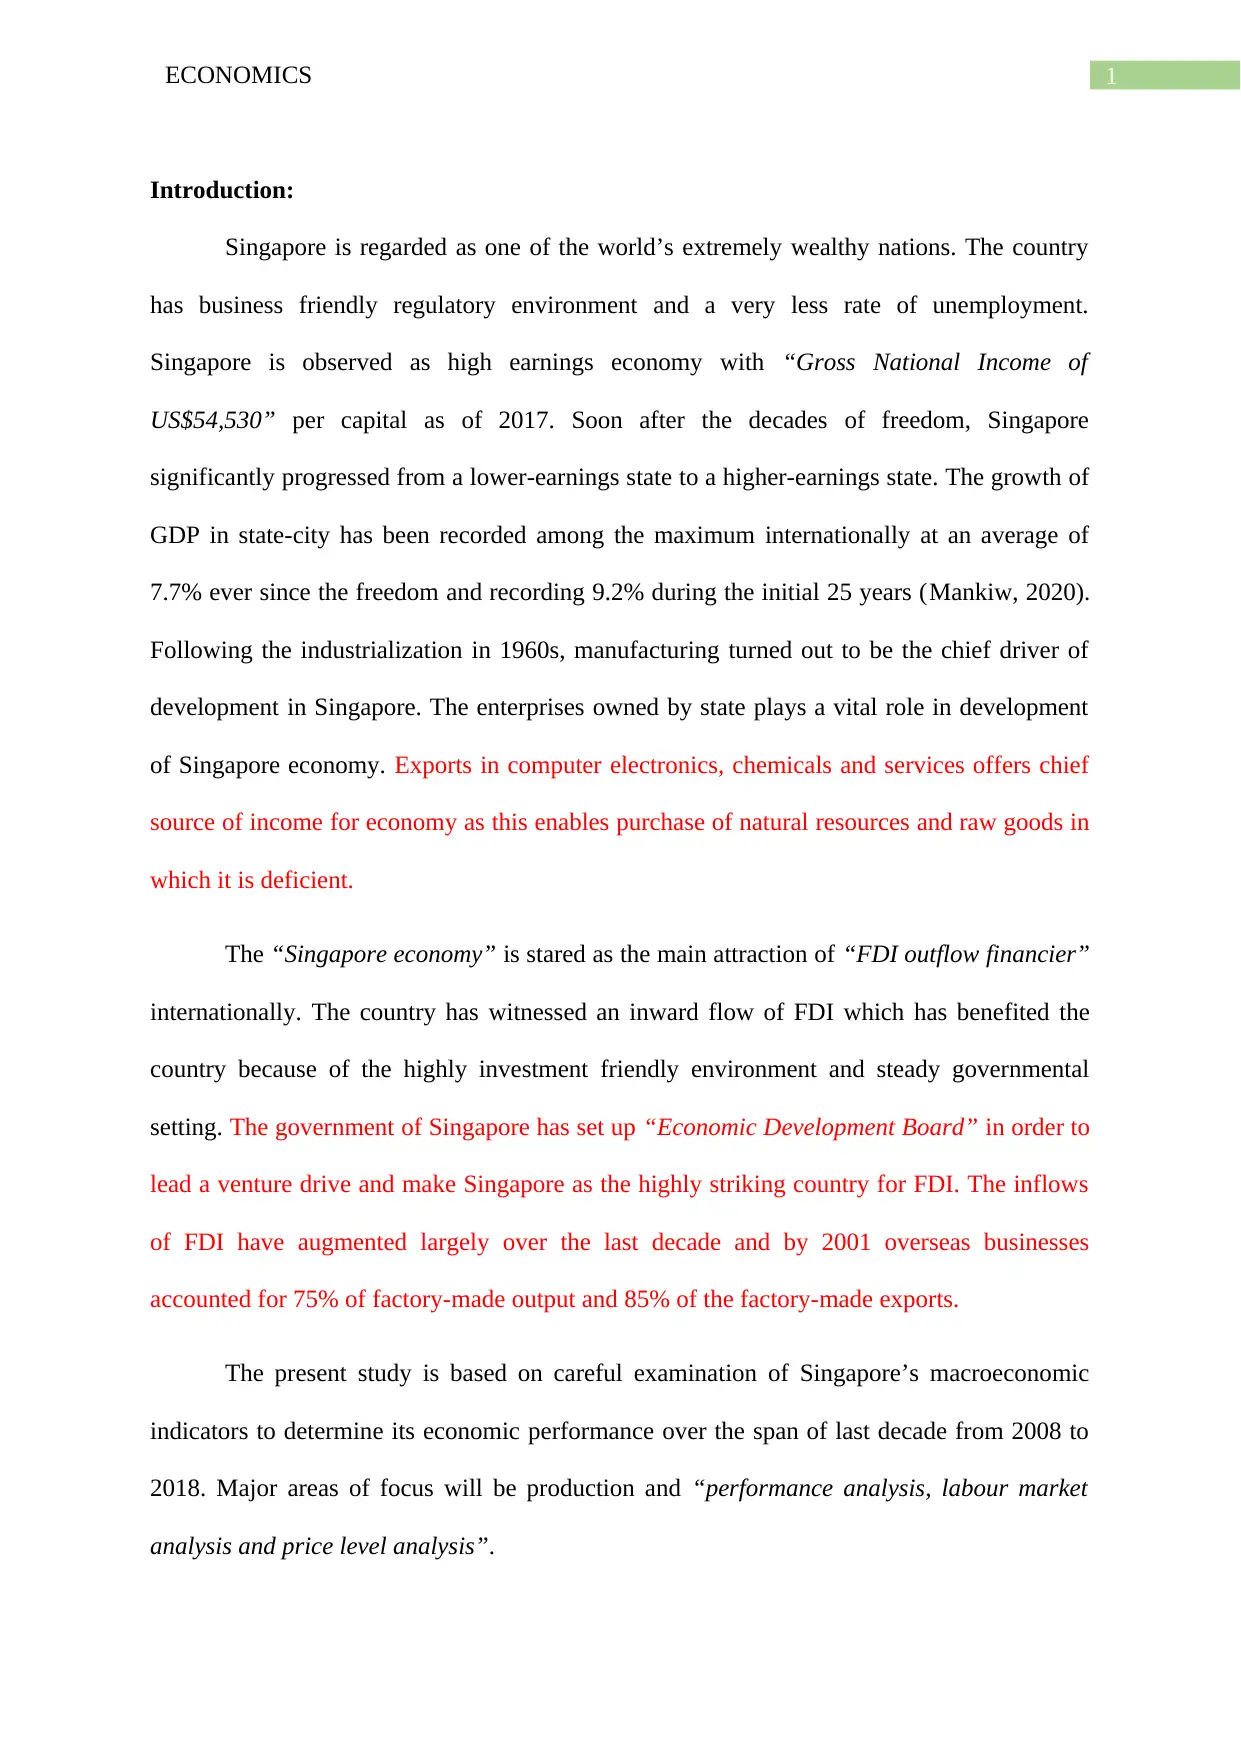
Real GDP Growth Rate:
Figure 1: Real GDP of Singapore
Source:
The figure clearly explains that the economy of Singapore has progressed by 3.8%
throughout the “second quarter of 2018”. The manufacturing sector of Singapore is the
largest in size which contributes around 20% to 25% of the nation’s yearly GDP. The GDP in
Singapore declined annually by 1.9% on quarter-to-quarter basis during the first quarter of
Production output performance analysis
Definition and explanation of Real GDP measures:
“Real gross domestic product” is regarded as the “inflation-adjusted” measures
which imitates the worth of every products and services which is generated in an economy
inside a specified year, stated in “base year prices” and usually denoted as the “constant
price”. To measure the performance of an economy the real GDP keeps track of variations in
price levels and delivers a highly correct figure of an economic development (Goodwin et al.,
2019). The real GDP measures the total products and service of an economy in a given year
by considering the price level changes. It facilitates in comparing the GDP by year as it
considers inflation. It acts as a good indicator of where an economy is in the business cycle.
Real GDP Growth Rate:
Figure 1: Real GDP of Singapore
Source:
The figure clearly explains that the economy of Singapore has progressed by 3.8%
throughout the “second quarter of 2018”. The manufacturing sector of Singapore is the
largest in size which contributes around 20% to 25% of the nation’s yearly GDP. The GDP in
Singapore declined annually by 1.9% on quarter-to-quarter basis during the first quarter of
⊘ This is a preview!⊘
Do you want full access?
Subscribe today to unlock all pages.
Trusted by 1+ million students worldwide
3ECONOMICS
2017 in comparison to the 12.3% growth in the fourth quarter of 2016 and in accordance with
the market anticipation (Kakarot-Handtke, 2014). This can be viewed as strong decline since
2012 mainly because of the fall in manufacturing by -6.6% from 39.8% in Q4 of 2016 and in
service -2.2% from 8.4% in Q4.
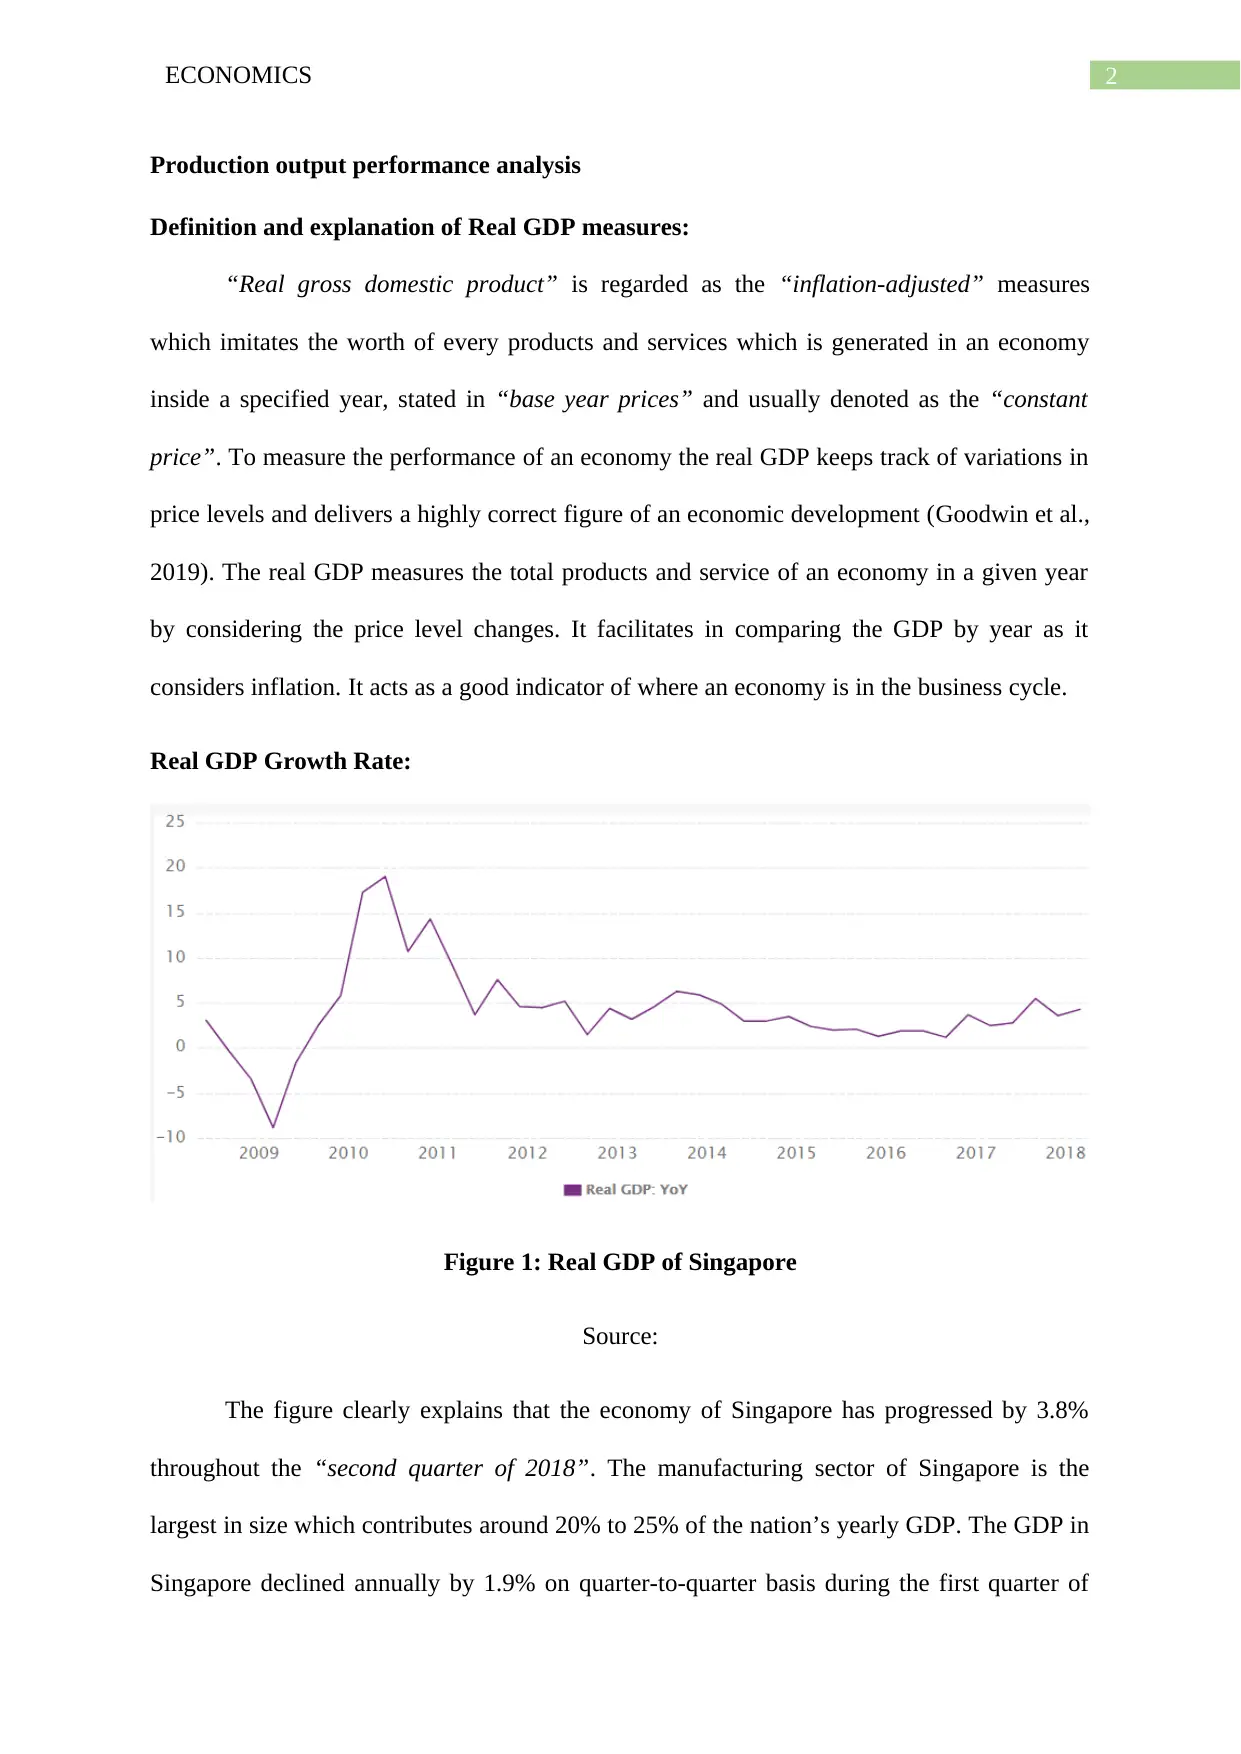
Figure 2: Real GDP Per Capita of Singapore
Source: (Tradingeconomics, 2020)
The Singapore economy grew a seasonally adjusted yearly 3.0% “quarter-to-
quarter” in the “third quarter” basis in 2018 which is well beyond 1% final growth for the
earlier quarter. However, it missed the anticipation of 4.2% rise and well below the
preliminary 4.7% print. This can be considered as the fastest growth in the four quarters,
largely snubbed by the sharp recover in construction industry by 5.1% against the 14.5% in
quarter 2. In the meantime the manufacturing sector expanded by 3.0% while the service
sector grew by 4.6% against the original 6.3% and 0.3% in quarter2.
Government measures to increase the production out of the economy:
Singapore has remarkably improved from the 2008 GFC as in 2010 the country
witnessed a growth rate of 15.2% growth. In the recent GFC the labor productivity growth
2017 in comparison to the 12.3% growth in the fourth quarter of 2016 and in accordance with
the market anticipation (Kakarot-Handtke, 2014). This can be viewed as strong decline since
2012 mainly because of the fall in manufacturing by -6.6% from 39.8% in Q4 of 2016 and in
service -2.2% from 8.4% in Q4.
Figure 2: Real GDP Per Capita of Singapore
Source: (Tradingeconomics, 2020)
The Singapore economy grew a seasonally adjusted yearly 3.0% “quarter-to-
quarter” in the “third quarter” basis in 2018 which is well beyond 1% final growth for the
earlier quarter. However, it missed the anticipation of 4.2% rise and well below the
preliminary 4.7% print. This can be considered as the fastest growth in the four quarters,
largely snubbed by the sharp recover in construction industry by 5.1% against the 14.5% in
quarter 2. In the meantime the manufacturing sector expanded by 3.0% while the service
sector grew by 4.6% against the original 6.3% and 0.3% in quarter2.
Government measures to increase the production out of the economy:
Singapore has remarkably improved from the 2008 GFC as in 2010 the country
witnessed a growth rate of 15.2% growth. In the recent GFC the labor productivity growth
Paraphrase This Document
Need a fresh take? Get an instant paraphrase of this document with our AI Paraphraser
4ECONOMICS
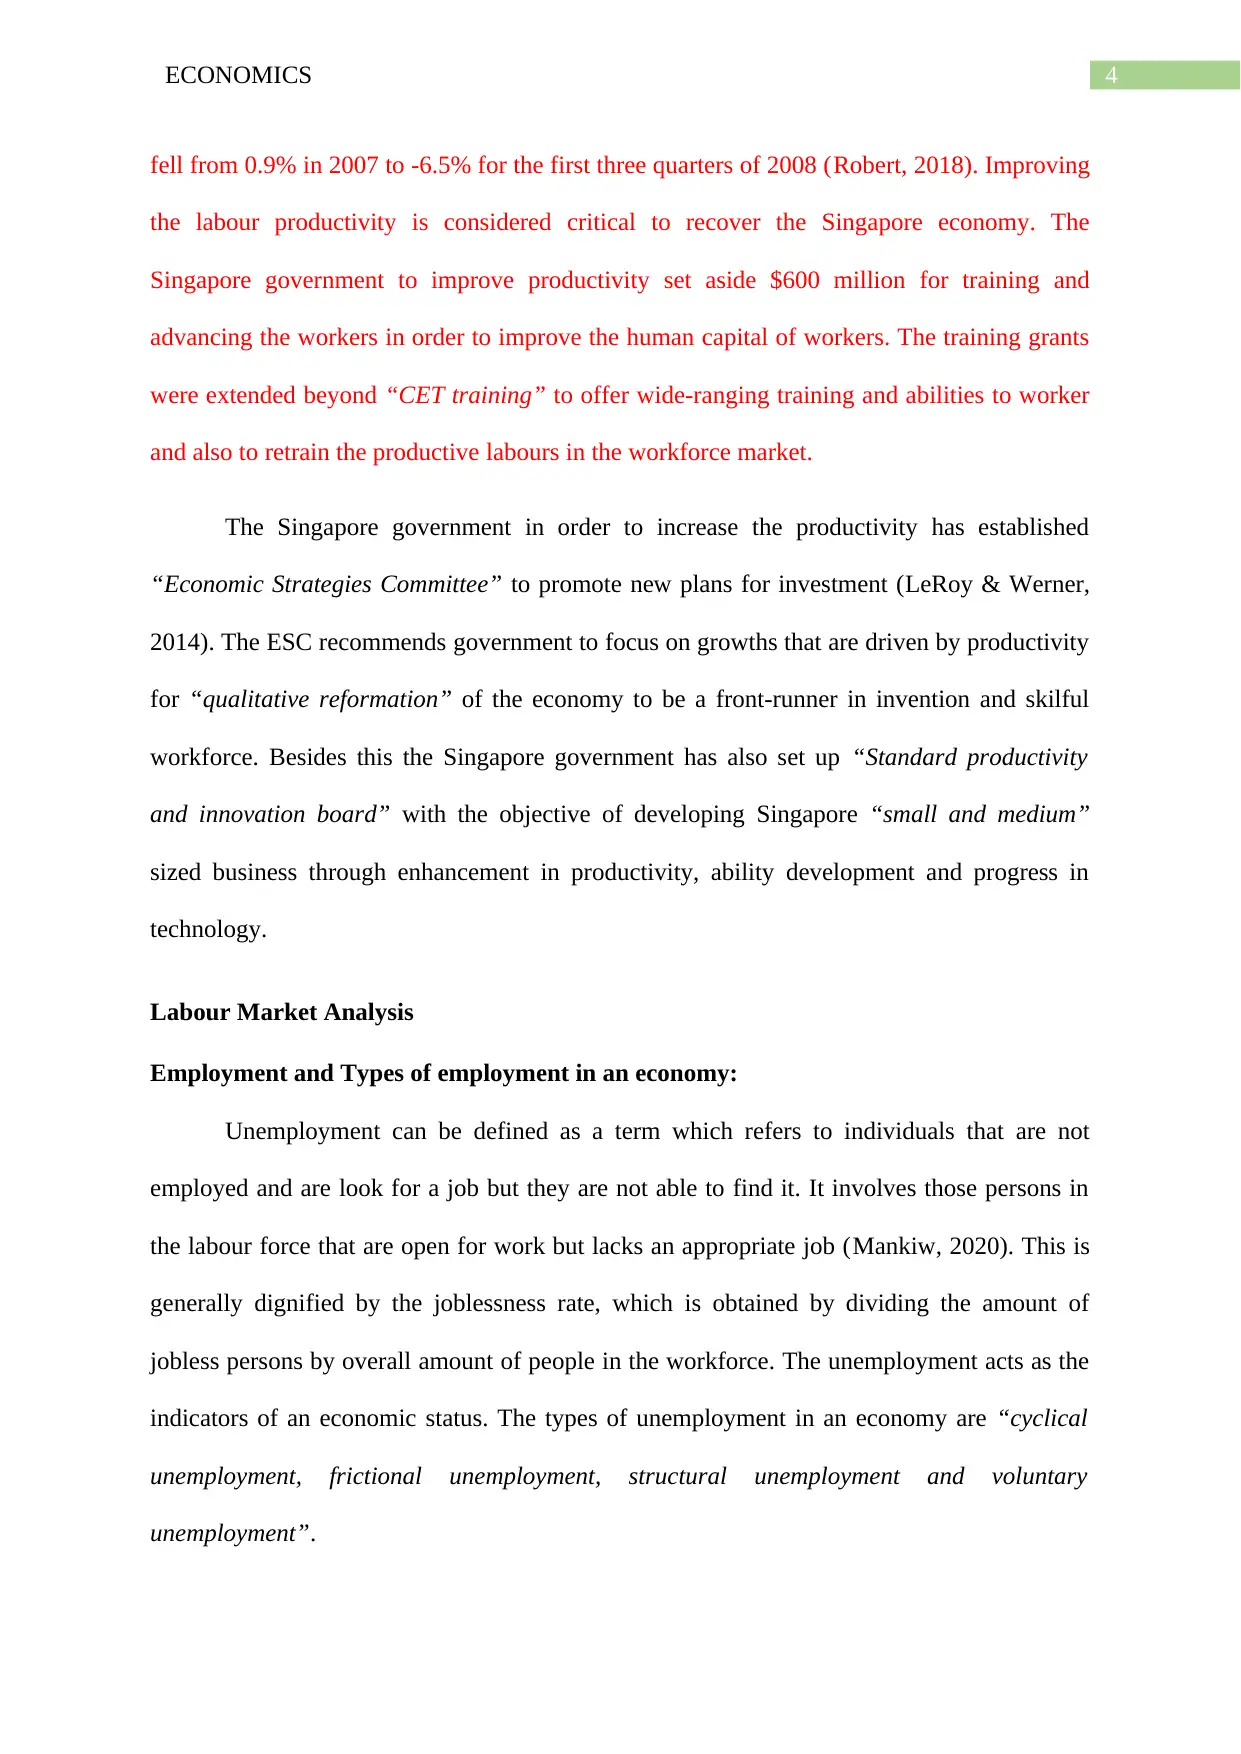
fell from 0.9% in 2007 to -6.5% for the first three quarters of 2008 (Robert, 2018). Improving
the labour productivity is considered critical to recover the Singapore economy. The
Singapore government to improve productivity set aside $600 million for training and
advancing the workers in order to improve the human capital of workers. The training grants
were extended beyond “CET training” to offer wide-ranging training and abilities to worker
and also to retrain the productive labours in the workforce market.
The Singapore government in order to increase the productivity has established
“Economic Strategies Committee” to promote new plans for investment (LeRoy & Werner,
2014). The ESC recommends government to focus on growths that are driven by productivity
for “qualitative reformation” of the economy to be a front-runner in invention and skilful
workforce. Besides this the Singapore government has also set up “Standard productivity
and innovation board” with the objective of developing Singapore “small and medium”
sized business through enhancement in productivity, ability development and progress in
technology.
Labour Market Analysis
Employment and Types of employment in an economy:
Unemployment can be defined as a term which refers to individuals that are not
employed and are look for a job but they are not able to find it. It involves those persons in
the labour force that are open for work but lacks an appropriate job (Mankiw, 2020). This is
generally dignified by the joblessness rate, which is obtained by dividing the amount of
jobless persons by overall amount of people in the workforce. The unemployment acts as the
indicators of an economic status. The types of unemployment in an economy are “cyclical
unemployment, frictional unemployment, structural unemployment and voluntary
unemployment”.
5ECONOMICS
“Cyclical unemployment” happens when the persons lose their employments because
of the drop in the “aggregate demand” (AG). If the fall in demand is continuous and the
joblessness is long-term, then it is viewed as demand deficient unemployment (Cowell,
2018). The biggest cause that contributes such kind of unemployment is particularly the
recession. The recession contributes fall in demand which forces cut back on production,
making it difficult to retain workforce inside the organization.
Frictional unemployment happens to workers that are in between jobs. In other words,
it happens when the workers lose their present job and they are in process of finding another
job. Little can be done to lower this type of unemployment apart from providing information
to lower the search time.
“Structural unemployment” happens when a certain skill set of a worker fails to
match with the skills demanded of availability of jobs or given the worker is unable to reach
the geographic location of a job (Devlin, 2014). For instance, the production of UK motor
vehicle in the last 20 years has fallen while the production has increased in the east, resulting
in structural unemployed car workers. This is mainly due to changes in technology in an
organization or automation in workflow.
Voluntary unemployment happens when a worker has taken a decision of leaving the
job since the job is not anymore financially fulfilling. For a reason or another, workers might
not decide to participate in the labour market based on the present equilibrium wage rate.
This may include higher welfare benefits and higher rates of income tax.
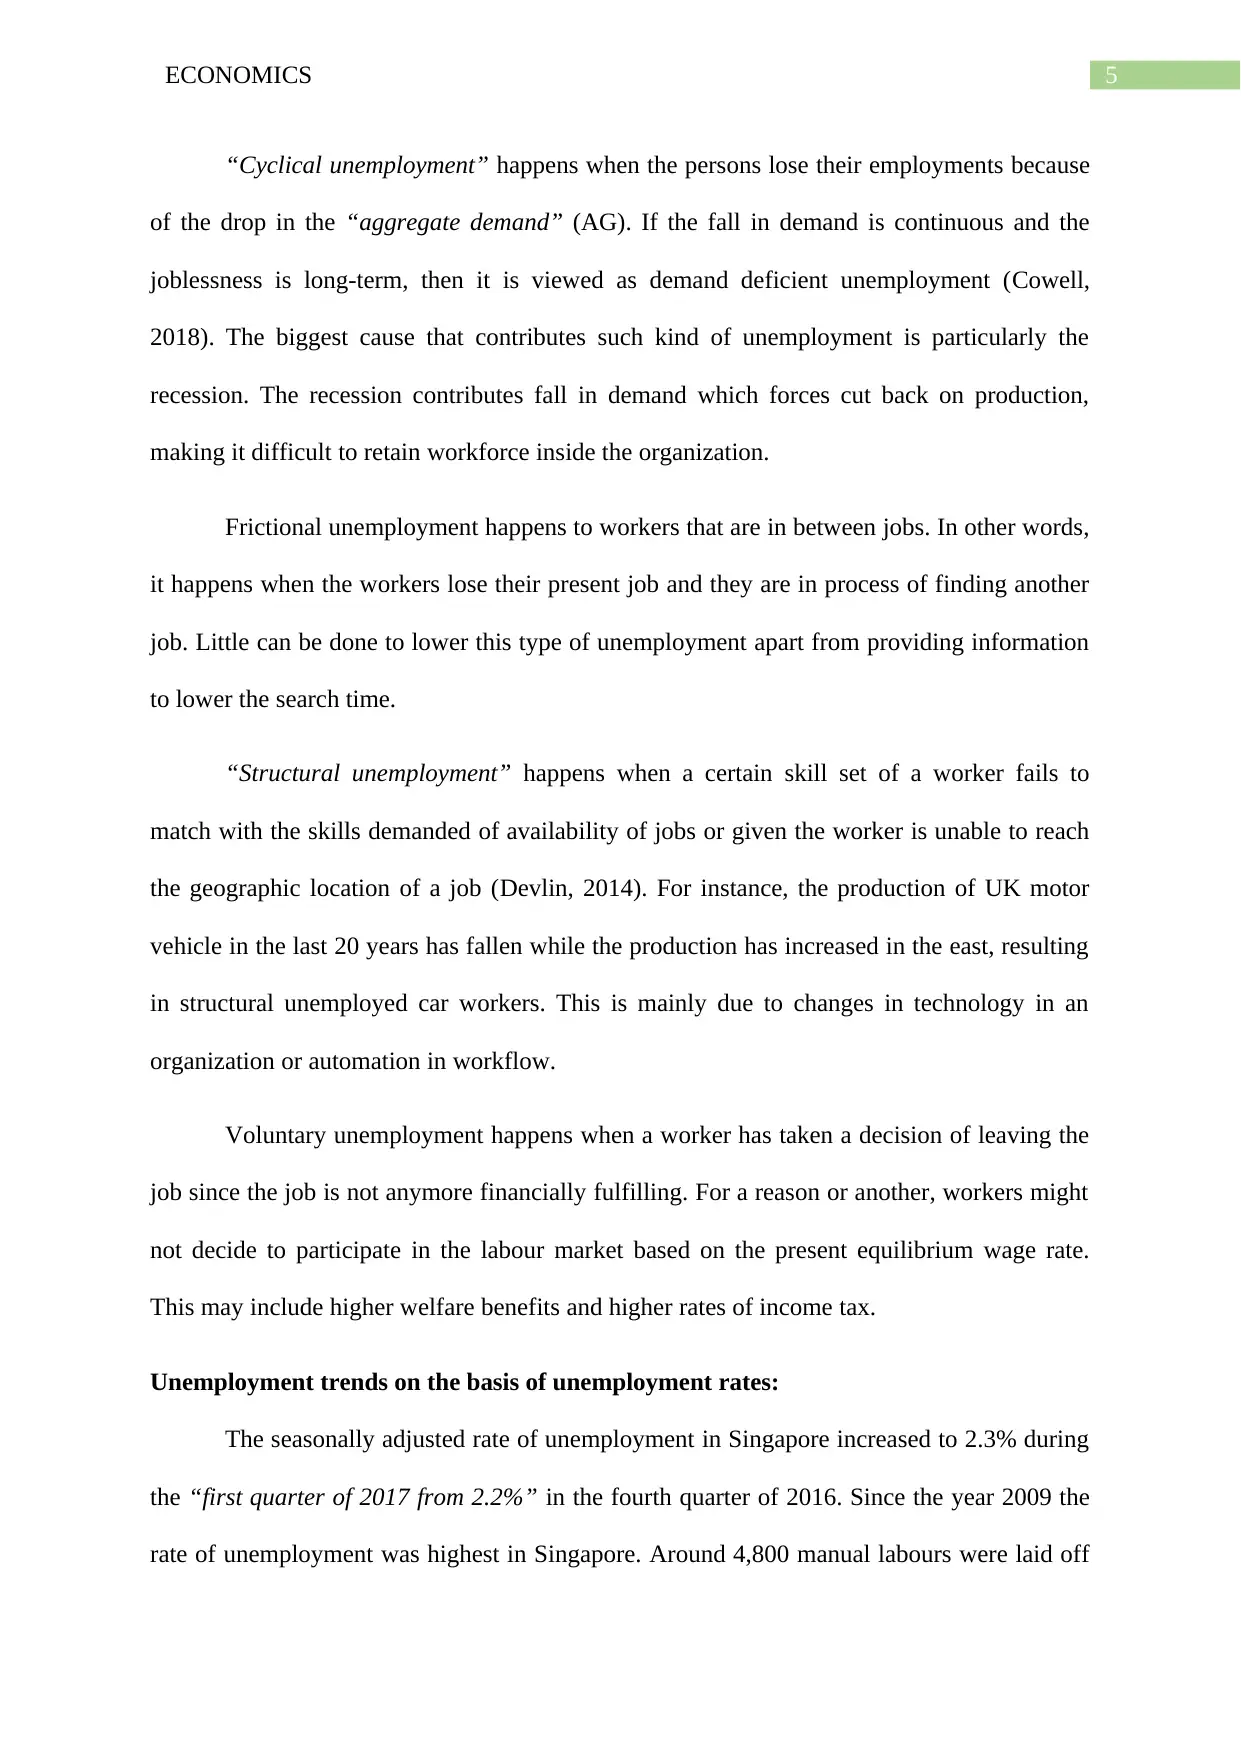
Unemployment trends on the basis of unemployment rates:
The seasonally adjusted rate of unemployment in Singapore increased to 2.3% during
the “first quarter of 2017 from 2.2%” in the fourth quarter of 2016. Since the year 2009 the
rate of unemployment was highest in Singapore. Around 4,800 manual labours were laid off
“Cyclical unemployment” happens when the persons lose their employments because
of the drop in the “aggregate demand” (AG). If the fall in demand is continuous and the
joblessness is long-term, then it is viewed as demand deficient unemployment (Cowell,
2018). The biggest cause that contributes such kind of unemployment is particularly the
recession. The recession contributes fall in demand which forces cut back on production,
making it difficult to retain workforce inside the organization.
Frictional unemployment happens to workers that are in between jobs. In other words,
it happens when the workers lose their present job and they are in process of finding another
job. Little can be done to lower this type of unemployment apart from providing information
to lower the search time.
“Structural unemployment” happens when a certain skill set of a worker fails to
match with the skills demanded of availability of jobs or given the worker is unable to reach
the geographic location of a job (Devlin, 2014). For instance, the production of UK motor
vehicle in the last 20 years has fallen while the production has increased in the east, resulting
in structural unemployed car workers. This is mainly due to changes in technology in an
organization or automation in workflow.
Voluntary unemployment happens when a worker has taken a decision of leaving the
job since the job is not anymore financially fulfilling. For a reason or another, workers might
not decide to participate in the labour market based on the present equilibrium wage rate.
This may include higher welfare benefits and higher rates of income tax.
Unemployment trends on the basis of unemployment rates:
The seasonally adjusted rate of unemployment in Singapore increased to 2.3% during
the “first quarter of 2017 from 2.2%” in the fourth quarter of 2016. Since the year 2009 the
rate of unemployment was highest in Singapore. Around 4,800 manual labours were laid off
⊘ This is a preview!⊘
Do you want full access?
Subscribe today to unlock all pages.
Trusted by 1+ million students worldwide
6ECONOMICS
less than the fourth quarter of 5440 but identical to a year before of 4710. The overall
employment fell to 8500 as compared to the seasonal high of 2300 in the previous quarter of
2300. It was the biggest in the last 10 years. The seasonally adjusted rate of unemployment in
Singapore increased to 2.2% during December quarter of 2018 in the earlier period in
accordance with the preliminary estimate shown by final data. Taking the entire 2018, the
rate of unemployed inched lower to stand at 2.1% from the previous 2.2% in 2017.
Figure 3: Unemployment trend in Singapore
Source: (Tradingeconomics, 2020)
Types of unemployment in Singapore:
In Singapore cyclical unemployment is prevalent. The cyclical unemployment has
increased from the first quarter of 2016 because the overall demand for domestic goods and
services are relatively slower than the “supply” of labour in the economy. Singapore is
relatively a small economy which is mainly reliant on the exports (Kaldor, 2015).
Nevertheless the exports have been slow in Singapore mainly because of huge import market
from China, US and European Union.
Paraphrase This Document
Need a fresh take? Get an instant paraphrase of this document with our AI Paraphraser
7ECONOMICS
Structural unemployment is additional type of joblessness which is prevalent in
Singapore. The increase in the speed of technological advancement in the last few years is
mainly because of structuring of economy from a labour-driven economy to a production-
driven economy. This is mainly because of the unsustainability of labour-driven economy
growth strategy which has resulted in increase in population in Singapore with restricted land
area. The technological unemployment because of low skills has resulted in increase in
structural unemployment.
Government measures adopted to achieve full employment:
To attain “full employment” in Singapore, the government has launched “Lean
Enterprise Development Scheme (LEDS)” which takes together many organisations to deliver
a single-stop service to make it easy for the “small and medium” enterprise to improve their
corporate competence and obtain an admission to the labour market. The Singapore
government has implemented a profession change plan which would be extended to
additional segments such as “pharmaceuticals, logistics and retail” to boost up the rate of
unemployment.
Price level analysis:
Inflation and its causes:
Inflation can be defined as rise in price because of increase in the price of production
particularly the raw materials and wages. A rise in demand for product and services can result
in inflation as customers are willing to pay more for the product (Karl, 2014). The reasons of
inflation mostly includes the “demand-pull inflation and cost push inflation”.
The “demand pull inflation” happens if the economy is at full or near to “full
employment” then an increase in the “aggregate demand” leads to rise the level of price.
When businesses reach full volume, they reply by increasing the price giving rise to inflation.
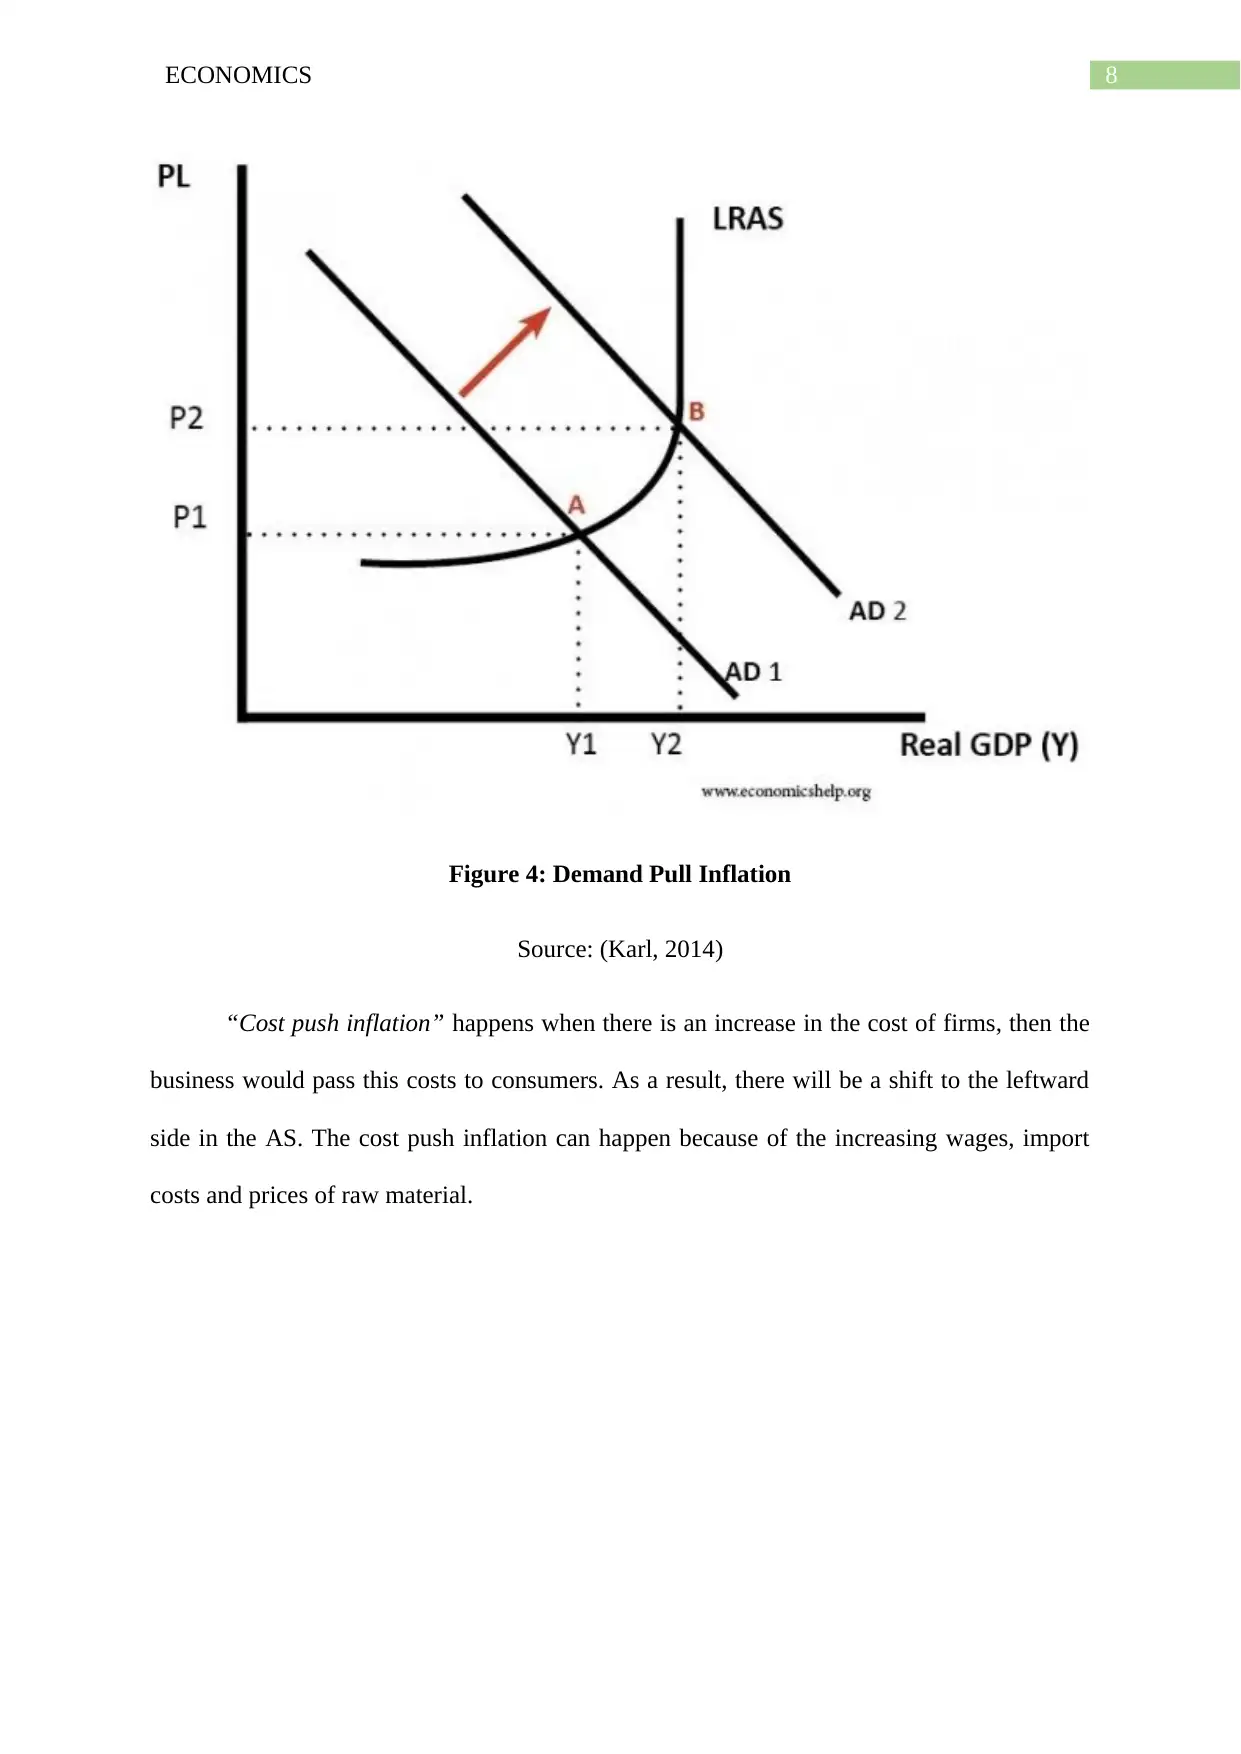
8ECONOMICS
Figure 4: Demand Pull Inflation
Source: (Karl, 2014)
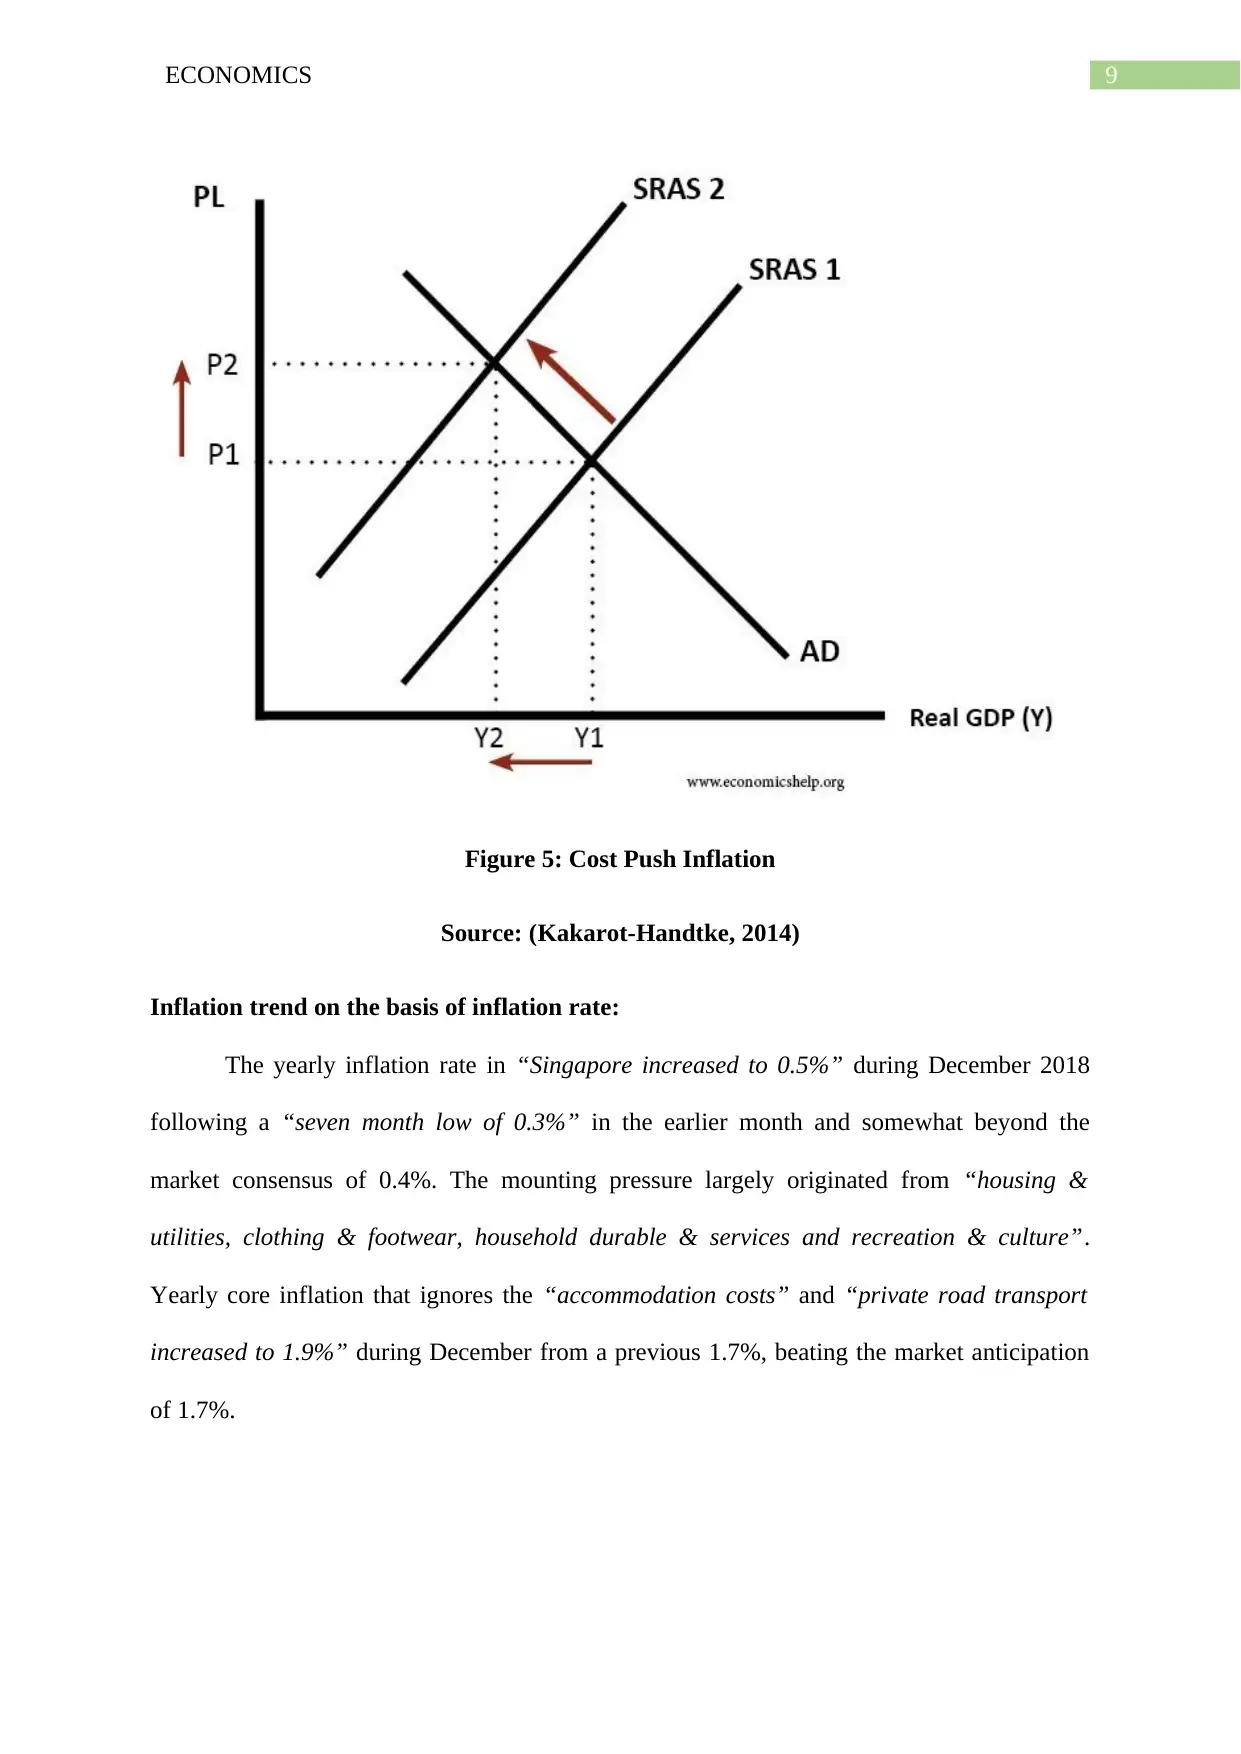
“Cost push inflation” happens when there is an increase in the cost of firms, then the
business would pass this costs to consumers. As a result, there will be a shift to the leftward
side in the AS. The cost push inflation can happen because of the increasing wages, import
costs and prices of raw material.
Figure 4: Demand Pull Inflation
Source: (Karl, 2014)
“Cost push inflation” happens when there is an increase in the cost of firms, then the
business would pass this costs to consumers. As a result, there will be a shift to the leftward
side in the AS. The cost push inflation can happen because of the increasing wages, import
costs and prices of raw material.
⊘ This is a preview!⊘
Do you want full access?
Subscribe today to unlock all pages.
Trusted by 1+ million students worldwide
9ECONOMICS
Figure 5: Cost Push Inflation
Source: (Kakarot-Handtke, 2014)
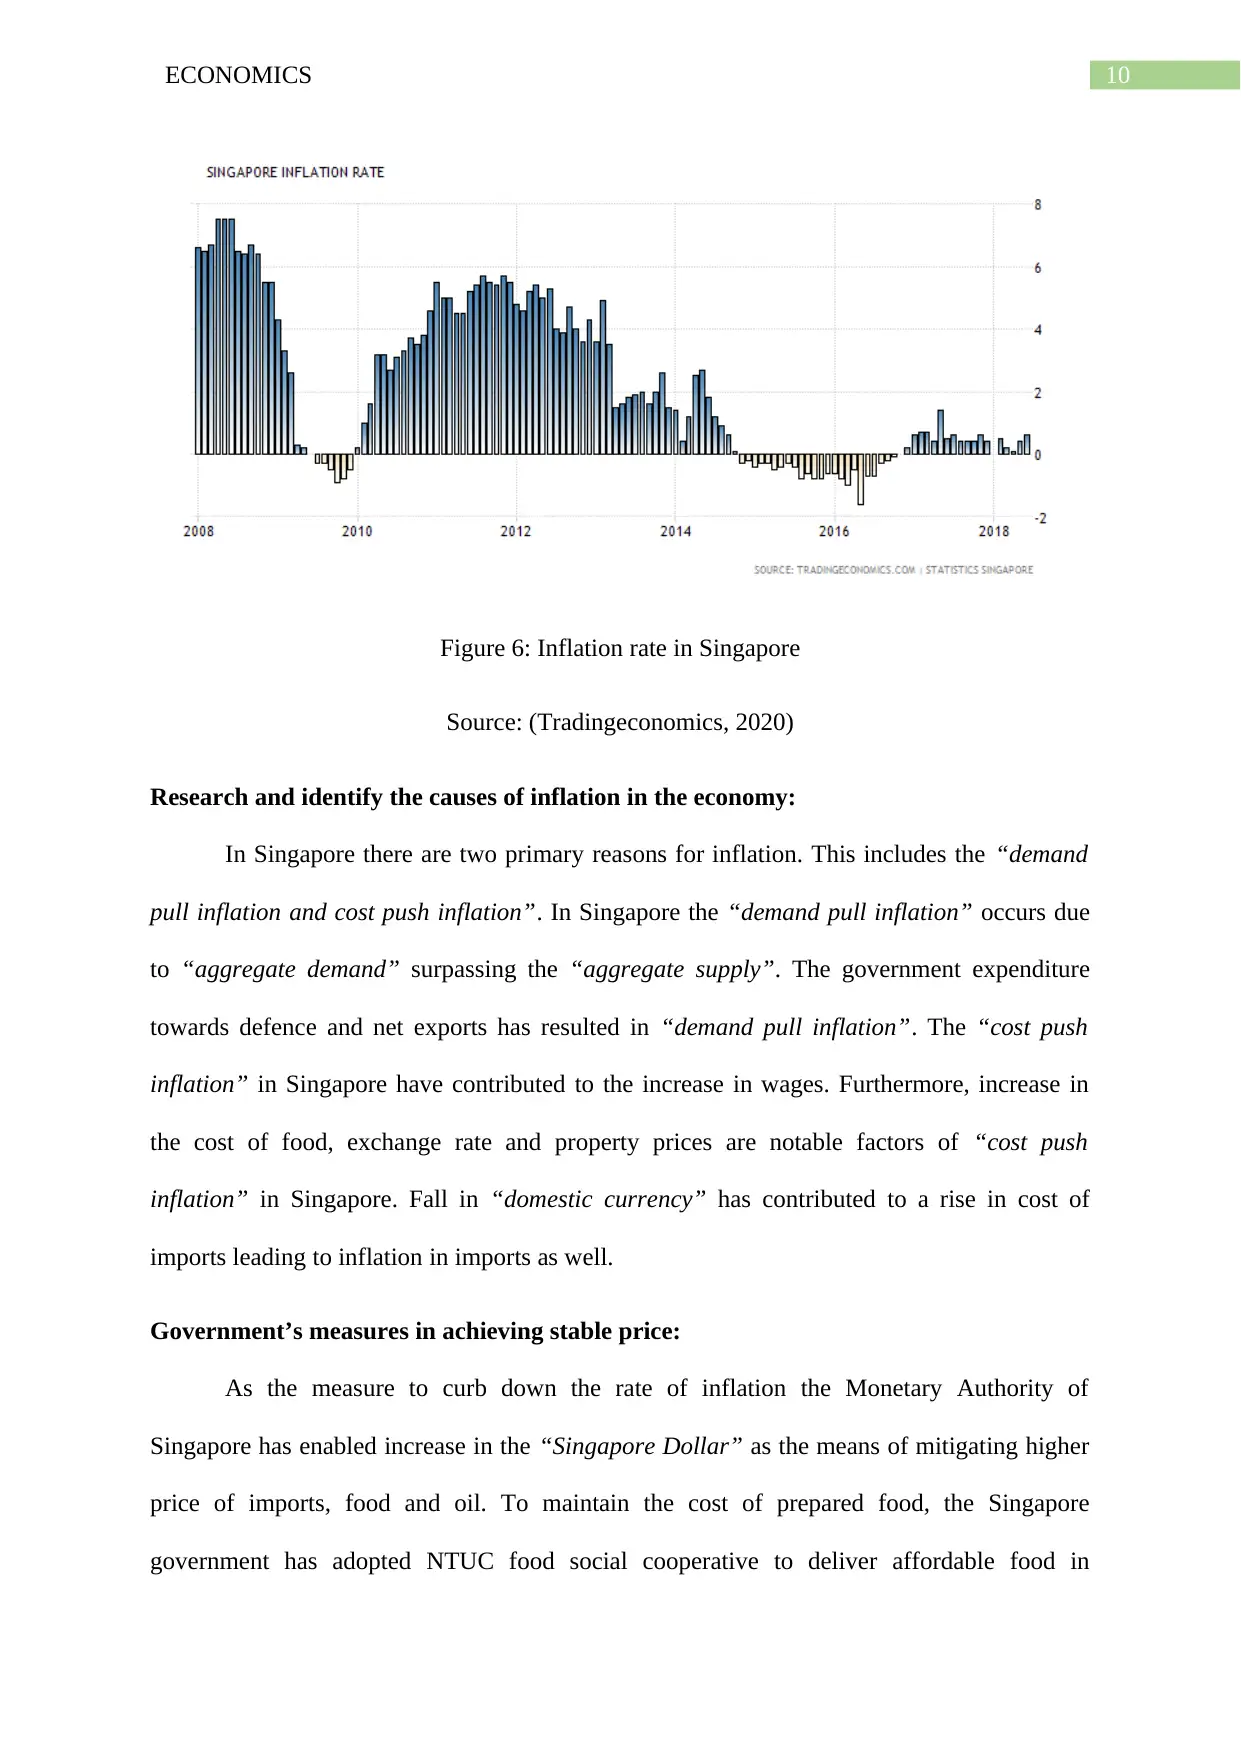
Inflation trend on the basis of inflation rate:
The yearly inflation rate in “Singapore increased to 0.5%” during December 2018
following a “seven month low of 0.3%” in the earlier month and somewhat beyond the
market consensus of 0.4%. The mounting pressure largely originated from “housing &
utilities, clothing & footwear, household durable & services and recreation & culture”.
Yearly core inflation that ignores the “accommodation costs” and “private road transport
increased to 1.9%” during December from a previous 1.7%, beating the market anticipation
of 1.7%.
Figure 5: Cost Push Inflation
Source: (Kakarot-Handtke, 2014)
Inflation trend on the basis of inflation rate:
The yearly inflation rate in “Singapore increased to 0.5%” during December 2018
following a “seven month low of 0.3%” in the earlier month and somewhat beyond the
market consensus of 0.4%. The mounting pressure largely originated from “housing &
utilities, clothing & footwear, household durable & services and recreation & culture”.
Yearly core inflation that ignores the “accommodation costs” and “private road transport
increased to 1.9%” during December from a previous 1.7%, beating the market anticipation
of 1.7%.
Paraphrase This Document
Need a fresh take? Get an instant paraphrase of this document with our AI Paraphraser
10ECONOMICS
Figure 6: Inflation rate in Singapore
Source: (Tradingeconomics, 2020)
Research and identify the causes of inflation in the economy:
In Singapore there are two primary reasons for inflation. This includes the “demand
pull inflation and cost push inflation”. In Singapore the “demand pull inflation” occurs due
to “aggregate demand” surpassing the “aggregate supply”. The government expenditure
towards defence and net exports has resulted in “demand pull inflation”. The “cost push
inflation” in Singapore have contributed to the increase in wages. Furthermore, increase in
the cost of food, exchange rate and property prices are notable factors of “cost push
inflation” in Singapore. Fall in “domestic currency” has contributed to a rise in cost of
imports leading to inflation in imports as well.
Government’s measures in achieving stable price:
As the measure to curb down the rate of inflation the Monetary Authority of
Singapore has enabled increase in the “Singapore Dollar” as the means of mitigating higher
price of imports, food and oil. To maintain the cost of prepared food, the Singapore
government has adopted NTUC food social cooperative to deliver affordable food in
11ECONOMICS
Singapore. To combat the supply side inflation, skill improvement scheme as the measure to
help the mid and lesser income group.
Conclusion:
On a conclusive note, the total growth of “Singapore economy” stood 3.2% in 2018.
The value added “manufacturing, especially electronics and precision engineering” sectors
are considered as the main drivers of economic growth. The service sector posted a growth of
5.9% based on year-on-year basis in the areas of finance & insurance, communication and
information industries as well. The economic development is anticipated to be reasonable in
2019 with “government forecasting of 1.5% to 3.5%,” anticipating the rate to be somewhat
below the middle of estimated range.
⊘ This is a preview!⊘
Do you want full access?
Subscribe today to unlock all pages.
Trusted by 1+ million students worldwide
1 out of 14
Related Documents


Your All-in-One AI-Powered Toolkit for Academic Success.
+13062052269
info@desklib.com
Available 24*7 on WhatsApp / Email
![[object Object]](/_next/static/media/star-bottom.7253800d.svg)
Unlock your academic potential
Copyright © 2020–2026 A2Z Services. All Rights Reserved. Developed and managed by ZUCOL.