Singapore's Economic Performance Analysis: 2005-2014 Economics Report
VerifiedAdded on 2023/06/10
|15
|3197
|181
Report
AI Summary
This economics assignment analyzes the economic performance of Singapore from 2005 to 2014, utilizing macroeconomic indicators like real GDP, real GDP growth rate, per capita real GDP, unemployment rate, and inflation rate. The analysis reveals an overall upward trend in real GDP, though with a dip in 2009, and fluctuating GDP growth rates with a decline during the global financial crisis. Per capita GDP mirrors the real GDP trend, reflecting the average income and living standards. The report also explores government policies aimed at fostering economic growth, including infrastructural development, tax incentives, and labor force skill enhancement. It examines unemployment trends, highlighting cyclical, structural, and frictional unemployment, alongside government measures to combat unemployment. Finally, it analyzes inflation trends, identifying demand-pull and cost-push inflation factors, and discusses the government's efforts to maintain price stability. The study concludes with an assessment of Singapore's economic strength during the period, supported by empirical data and economic explanations.
Running Head: ECONOMICS ASSIGNMENT
Economics Assignment
Name of the Student
Name of the University
Student ID
Course ID
Economics Assignment
Name of the Student
Name of the University
Student ID
Course ID
Paraphrase This Document
Need a fresh take? Get an instant paraphrase of this document with our AI Paraphraser
1ECONOMICS ASSIGNMENT
Introduction
The economy of Singapore is known as a high-income nation with gross national income
recorded to be USD 52, 600 in 2017. The nation offers a business friendly environment to its
local entrepreneurs (Tremewan, 2016). The economy is considered as one of the most
competitive economies of world. The decade after independence is known as a period for rapid
development for the country. With its rapid growth rate the economy has gradually upgraded its
status from an initially low-income nation to a high-income one. The city based GDP growth rate
for Singapore is highest in the world. Since independence, the nation has maintained an average
growth rate of 7.7%. The two main pillars of the high value-added economy are its
manufacturing and service sector. The key drivers of growth in manufacturing sector include
electronics and engineering sector. In the service sector, the main industries are storage and
transport industries. International trade plays a key role in the economy (worldbank.org, 2018).
The main exportable of Singapore are computers, refined petroleum, packaged medicaments and
integrated circuits. Refined petroleum, Integrated Circuits, Crude petroleum, Computers and Gas
turbines are the main importable of Singapore.
The essay attempts to analyze economic performance of Singapore over the period
ranging from 2005 to 2014. The performance trends are analyzed using major macroeconomic
indicators like real GDP, growth in real GDP, per capita real GDP, unemployment and rate of
inflation.
Production Output Performance Analysis
2ECONOMICS ASSIGNMENT
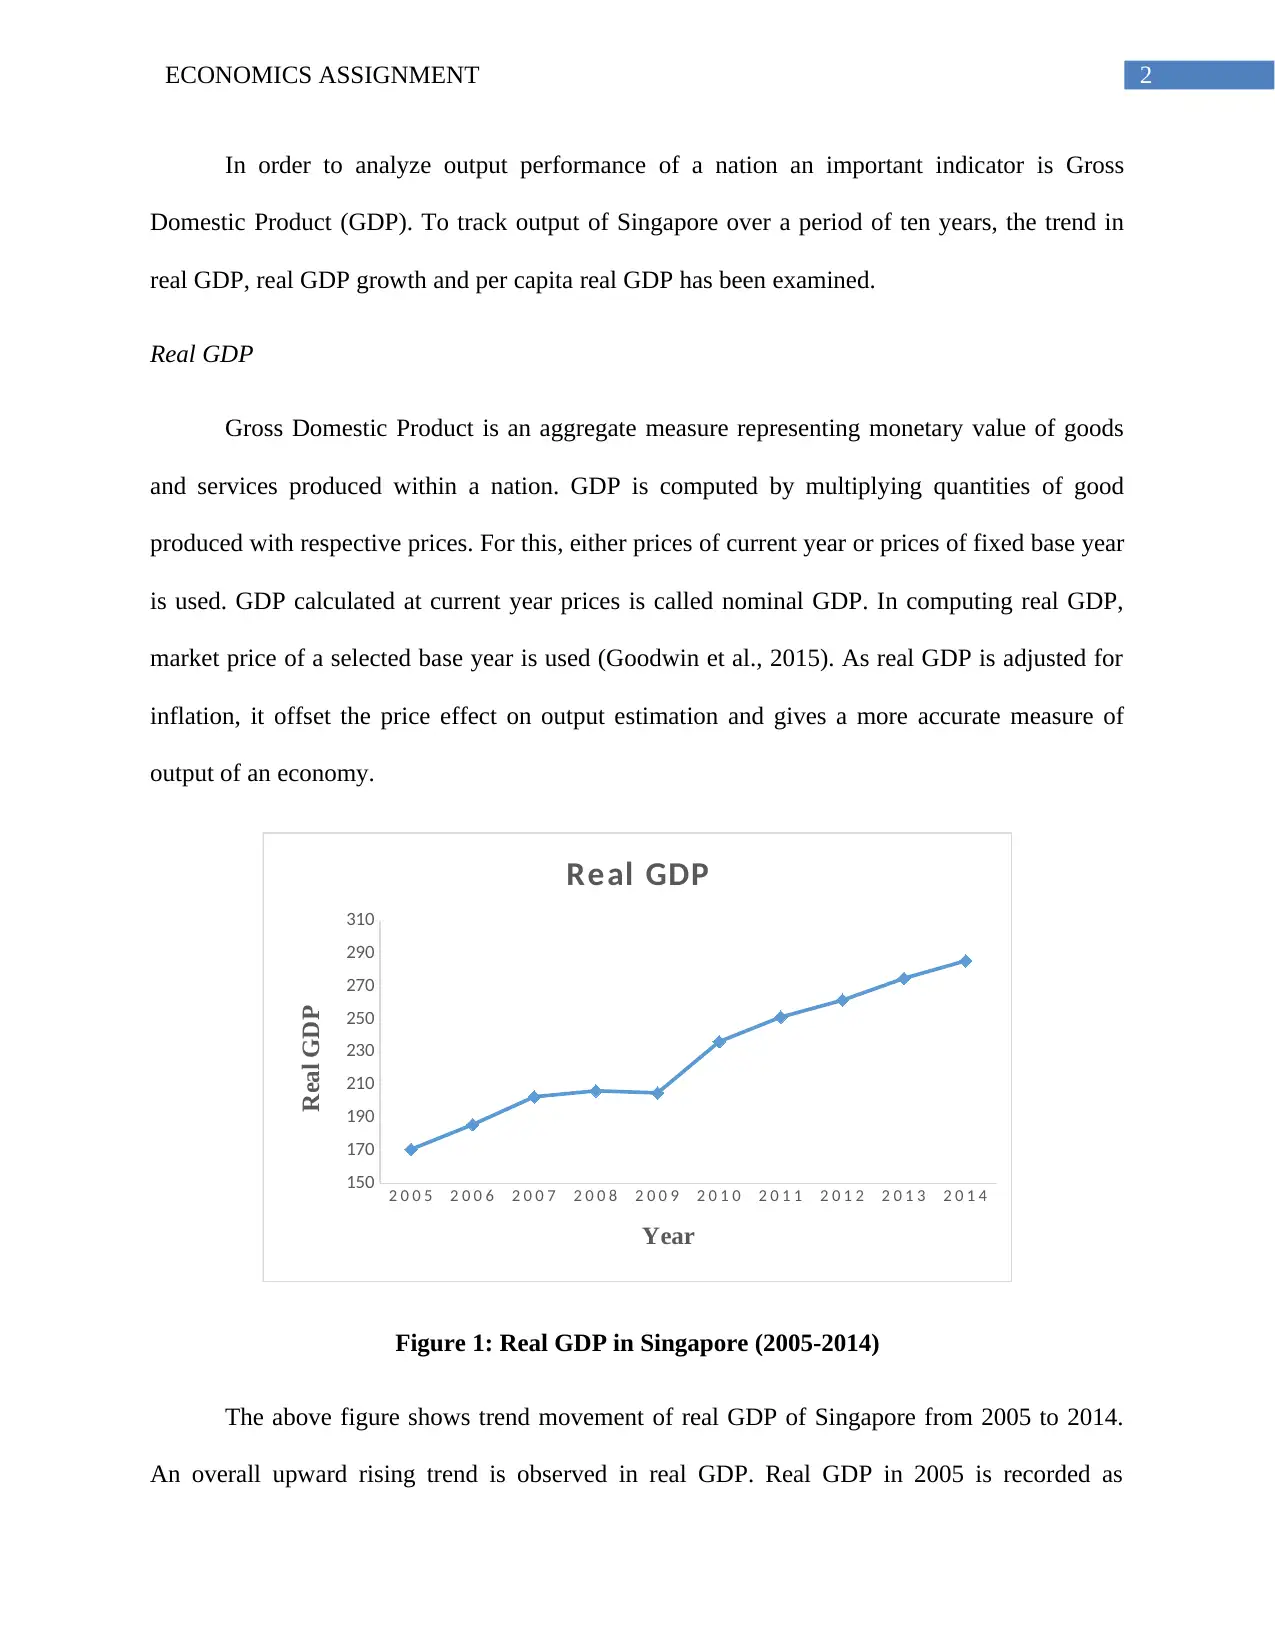
In order to analyze output performance of a nation an important indicator is Gross
Domestic Product (GDP). To track output of Singapore over a period of ten years, the trend in
real GDP, real GDP growth and per capita real GDP has been examined.
Real GDP
Gross Domestic Product is an aggregate measure representing monetary value of goods
and services produced within a nation. GDP is computed by multiplying quantities of good
produced with respective prices. For this, either prices of current year or prices of fixed base year
is used. GDP calculated at current year prices is called nominal GDP. In computing real GDP,
market price of a selected base year is used (Goodwin et al., 2015). As real GDP is adjusted for
inflation, it offset the price effect on output estimation and gives a more accurate measure of
output of an economy.
2 0 0 5 2 0 0 6 2 0 0 7 2 0 0 8 2 0 0 9 2 0 1 0 2 0 1 1 2 0 1 2 2 0 1 3 2 0 1 4
150
170
190
210
230
250
270
290
310
Real GDP
Year
Real GDP
Figure 1: Real GDP in Singapore (2005-2014)
The above figure shows trend movement of real GDP of Singapore from 2005 to 2014.
An overall upward rising trend is observed in real GDP. Real GDP in 2005 is recorded as
⊘ This is a preview!⊘
Do you want full access?
Subscribe today to unlock all pages.
Trusted by 1+ million students worldwide
3ECONOMICS ASSIGNMENT
170.717 billion, which increases to 285.763 billion in 2014. Only exception in the real GDP
trend is observed in 2009 (data.worldbank.org, 2018). Real GDP during this year fell to 205.155
billion from 206.401 billion in 2008. The highest real GDP is recorded in the year 2014.
Real GDP growth rate
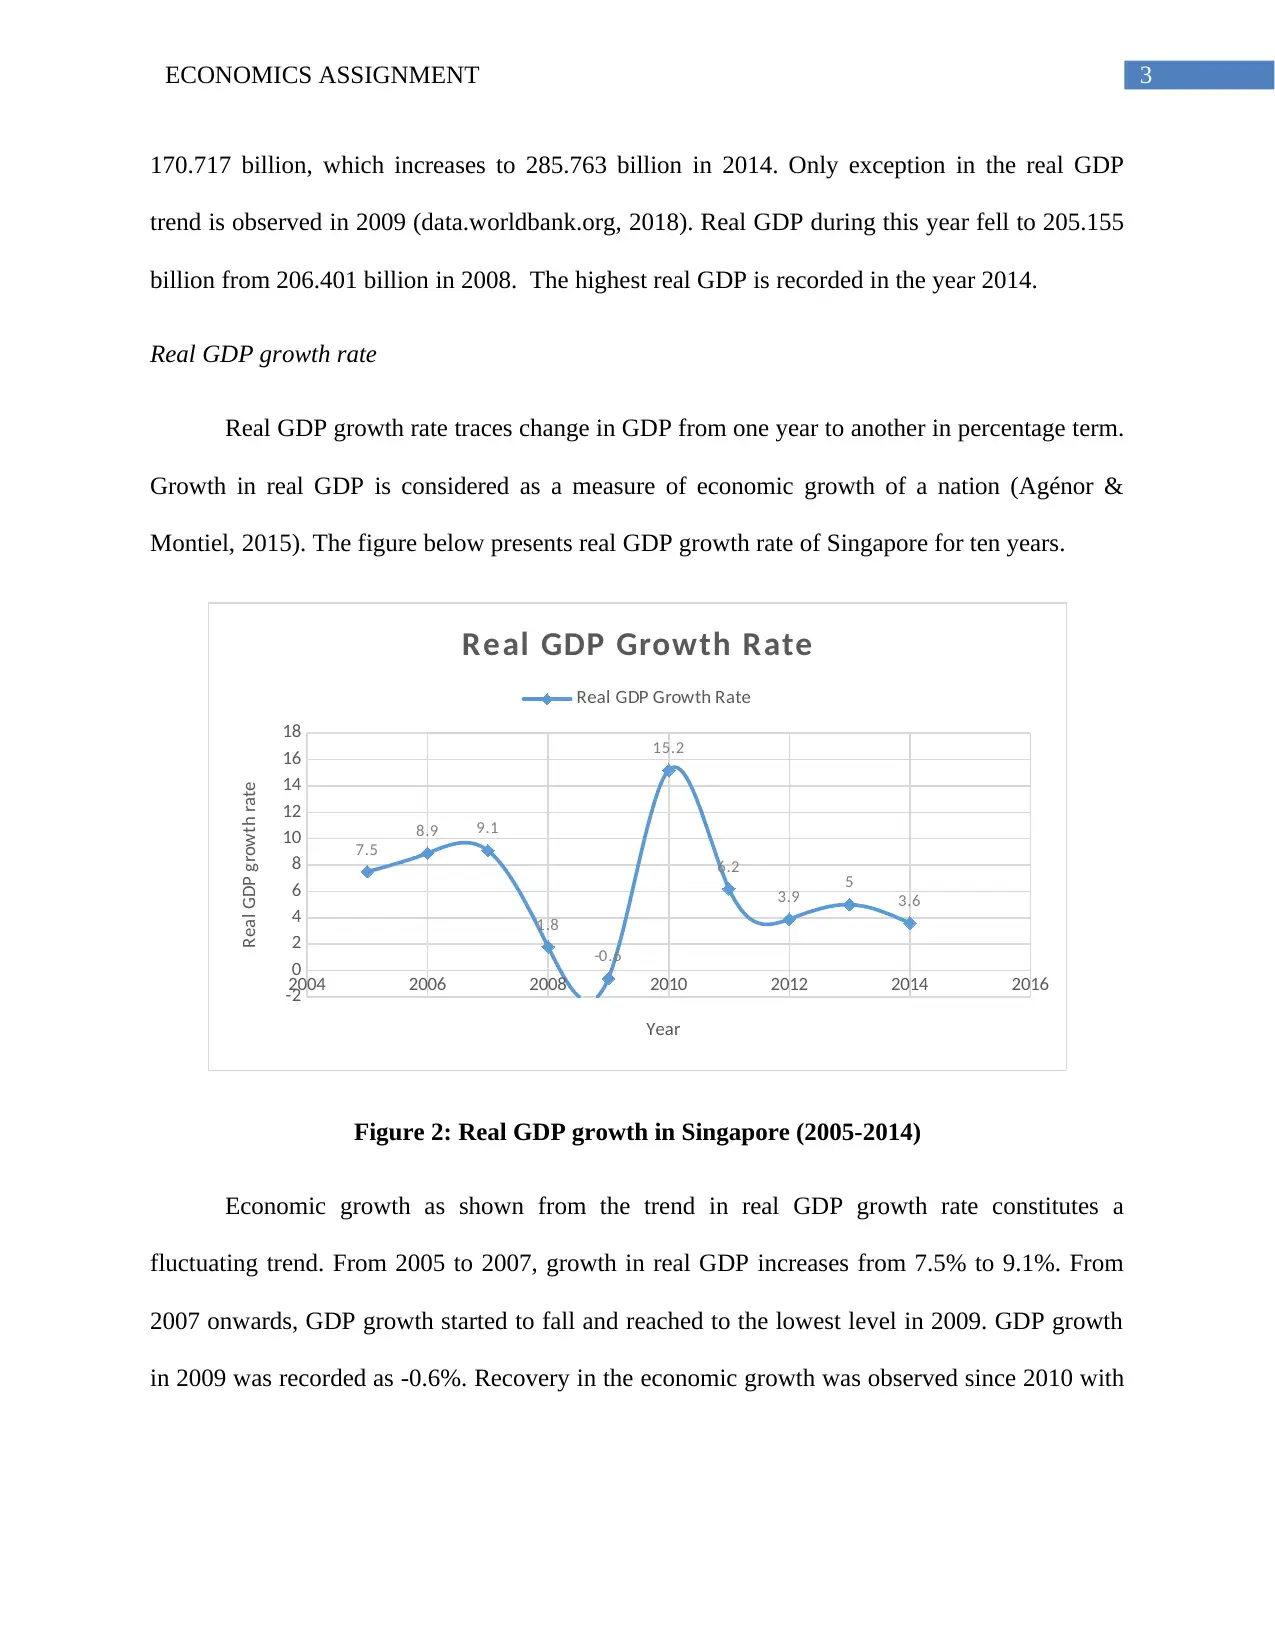
Real GDP growth rate traces change in GDP from one year to another in percentage term.
Growth in real GDP is considered as a measure of economic growth of a nation (Agénor &
Montiel, 2015). The figure below presents real GDP growth rate of Singapore for ten years.
2004 2006 2008 2010 2012 2014 2016
-2
0
2
4
6
8
10
12
14
16
18
7.5
8.9 9.1
1.8
-0.6
15.2
6.2
3.9 5
3.6
Real GDP Growth Rate
Real GDP Growth Rate
Year
Real GDP growth rate
Figure 2: Real GDP growth in Singapore (2005-2014)
Economic growth as shown from the trend in real GDP growth rate constitutes a
fluctuating trend. From 2005 to 2007, growth in real GDP increases from 7.5% to 9.1%. From
2007 onwards, GDP growth started to fall and reached to the lowest level in 2009. GDP growth
in 2009 was recorded as -0.6%. Recovery in the economic growth was observed since 2010 with
170.717 billion, which increases to 285.763 billion in 2014. Only exception in the real GDP
trend is observed in 2009 (data.worldbank.org, 2018). Real GDP during this year fell to 205.155
billion from 206.401 billion in 2008. The highest real GDP is recorded in the year 2014.
Real GDP growth rate
Real GDP growth rate traces change in GDP from one year to another in percentage term.
Growth in real GDP is considered as a measure of economic growth of a nation (Agénor &
Montiel, 2015). The figure below presents real GDP growth rate of Singapore for ten years.
2004 2006 2008 2010 2012 2014 2016
-2
0
2
4
6
8
10
12
14
16
18
7.5
8.9 9.1
1.8
-0.6
15.2
6.2
3.9 5
3.6
Real GDP Growth Rate
Real GDP Growth Rate
Year
Real GDP growth rate
Figure 2: Real GDP growth in Singapore (2005-2014)
Economic growth as shown from the trend in real GDP growth rate constitutes a
fluctuating trend. From 2005 to 2007, growth in real GDP increases from 7.5% to 9.1%. From
2007 onwards, GDP growth started to fall and reached to the lowest level in 2009. GDP growth
in 2009 was recorded as -0.6%. Recovery in the economic growth was observed since 2010 with
Paraphrase This Document
Need a fresh take? Get an instant paraphrase of this document with our AI Paraphraser
4ECONOMICS ASSIGNMENT
GDP reached to all time high level of 15.2%. GDP again began to fall from 2011
(data.worldbank.org, 2018). The last recorded GDP in 2014 was 3.6 percent.
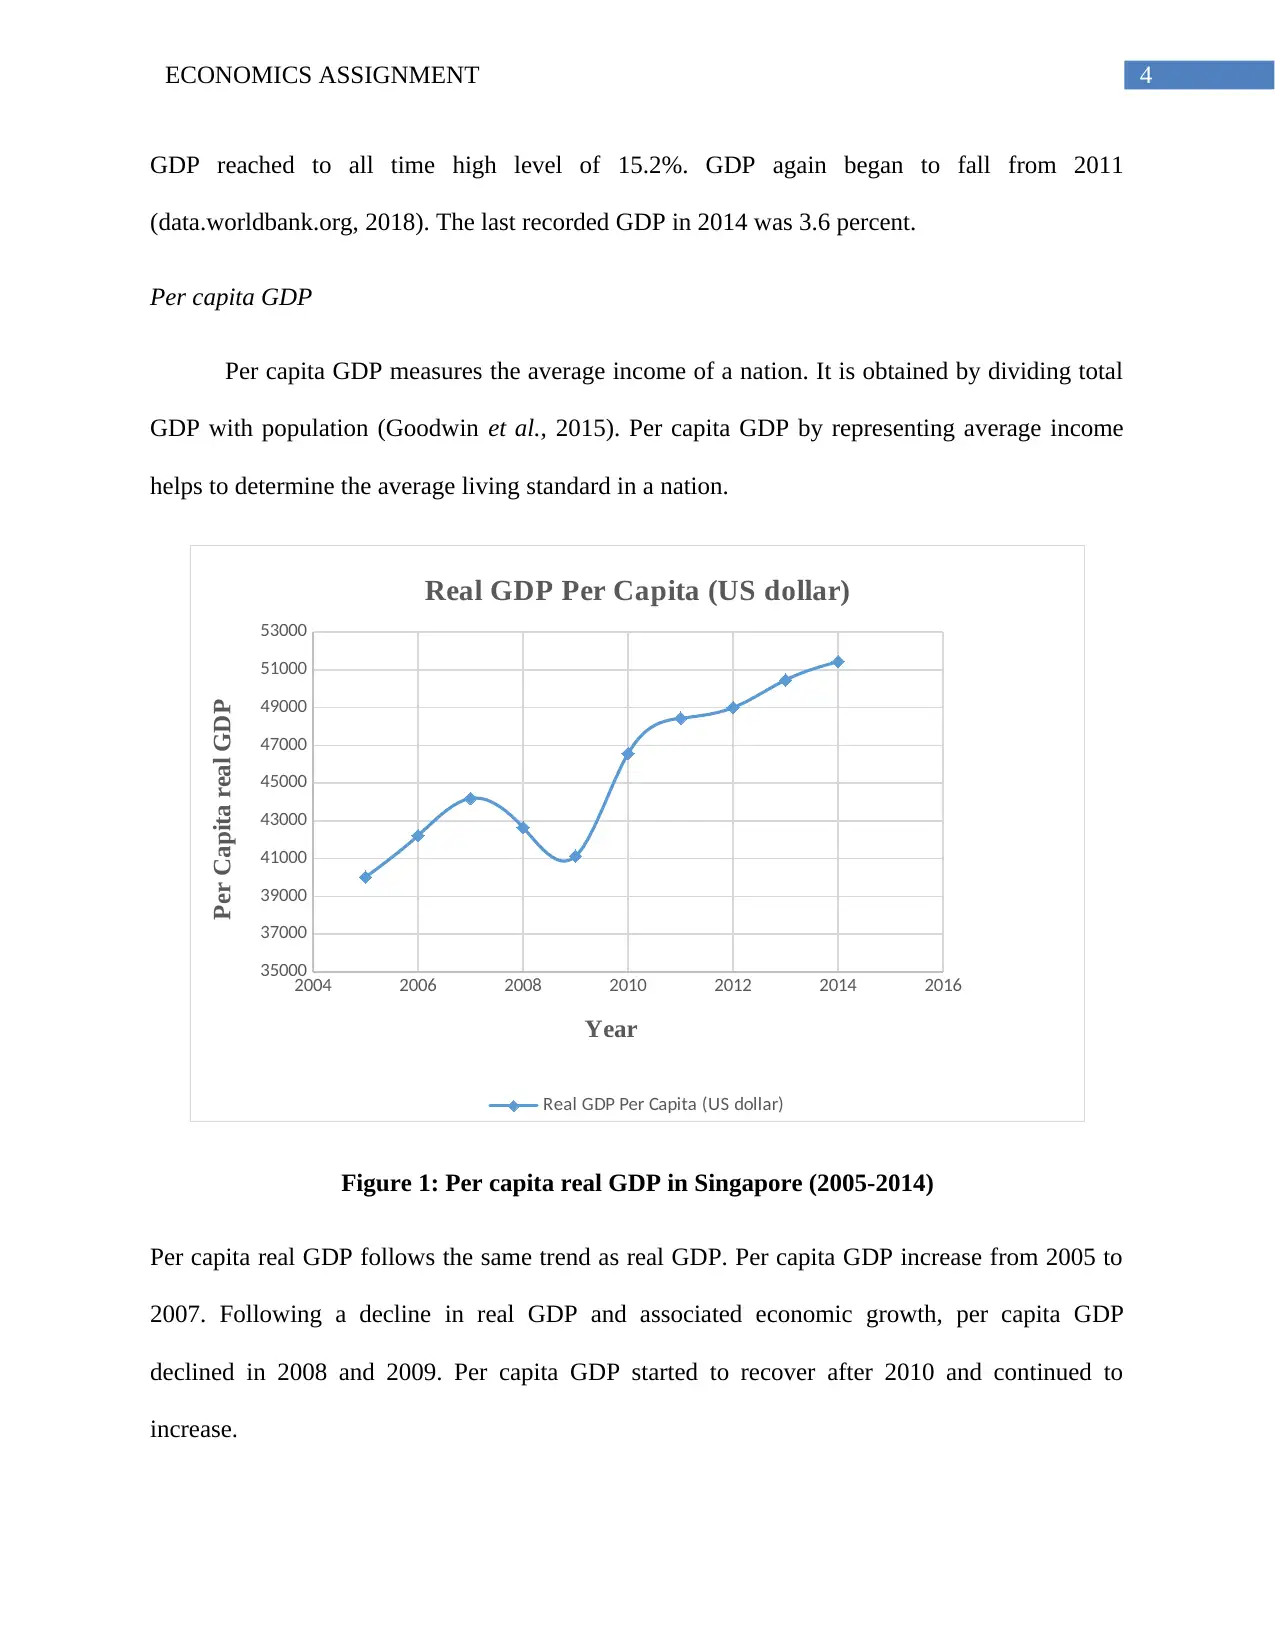
Per capita GDP
Per capita GDP measures the average income of a nation. It is obtained by dividing total
GDP with population (Goodwin et al., 2015). Per capita GDP by representing average income
helps to determine the average living standard in a nation.
2004 2006 2008 2010 2012 2014 2016
35000
37000
39000
41000
43000
45000
47000
49000
51000
53000
Real GDP Per Capita (US dollar)
Real GDP Per Capita (US dollar)
Year
Per Capita real GDP
Figure 1: Per capita real GDP in Singapore (2005-2014)
Per capita real GDP follows the same trend as real GDP. Per capita GDP increase from 2005 to
2007. Following a decline in real GDP and associated economic growth, per capita GDP
declined in 2008 and 2009. Per capita GDP started to recover after 2010 and continued to
increase.
GDP reached to all time high level of 15.2%. GDP again began to fall from 2011
(data.worldbank.org, 2018). The last recorded GDP in 2014 was 3.6 percent.
Per capita GDP
Per capita GDP measures the average income of a nation. It is obtained by dividing total
GDP with population (Goodwin et al., 2015). Per capita GDP by representing average income
helps to determine the average living standard in a nation.
2004 2006 2008 2010 2012 2014 2016
35000
37000
39000
41000
43000
45000
47000
49000
51000
53000
Real GDP Per Capita (US dollar)
Real GDP Per Capita (US dollar)
Year
Per Capita real GDP
Figure 1: Per capita real GDP in Singapore (2005-2014)
Per capita real GDP follows the same trend as real GDP. Per capita GDP increase from 2005 to
2007. Following a decline in real GDP and associated economic growth, per capita GDP
declined in 2008 and 2009. Per capita GDP started to recover after 2010 and continued to
increase.
5ECONOMICS ASSIGNMENT
Government measures adapted to achieve output performance
The government of Singapore has undertaken several policies to make the nation as one
of the fastest growing nation in world. At the initial stage of industrialization, key measures
taken by the government to promote economic growth include infrastructural development, tax
provision, policies to attract foreign investment and direct intervention of government in the
economy. The government of Singapore offered different financial incentives to attract
companies and offered access to the market and technology (Maitra, 2016). Companies are thus
willing to make long-term investment. Instead of giving cash grants, most incentives are in the
form of tax concessions. The primary incentives were income tax exemption to the companies
for the first five years. In addition to this, tax concessions are also given in terms of accelerated
depreciation on plants and deduction on interest of foreign loans and payment of royalty.
With the objective of enhancing productivity, government has focused on improving
skills of the labor force. In order to reduce cost of production and increase productivity
government encourages new techniques of production. To increase productivity and output
government has set up a high-level national council. In order to sustain productivity production
driven growth workers’ qualification should be measured in global frontier (Tan, 2016). The
Singapore government has announced that at least fifty percent of the population has diploma
degree by 2020.
Labor Market Analysis
⊘ This is a preview!⊘
Do you want full access?
Subscribe today to unlock all pages.
Trusted by 1+ million students worldwide
6ECONOMICS ASSIGNMENT
2004 2006 2008 2010 2012 2014 2016
1.5
1.7
1.9
2.1
2.3
2.5
2.7
2.9
3.1
3.3 3.1 3.1
2.1 2.2
3
2.1 2 1.9 1.9 1.95
Unemployment Rate
Unemployment Rate
Year
Rate of Unemployment
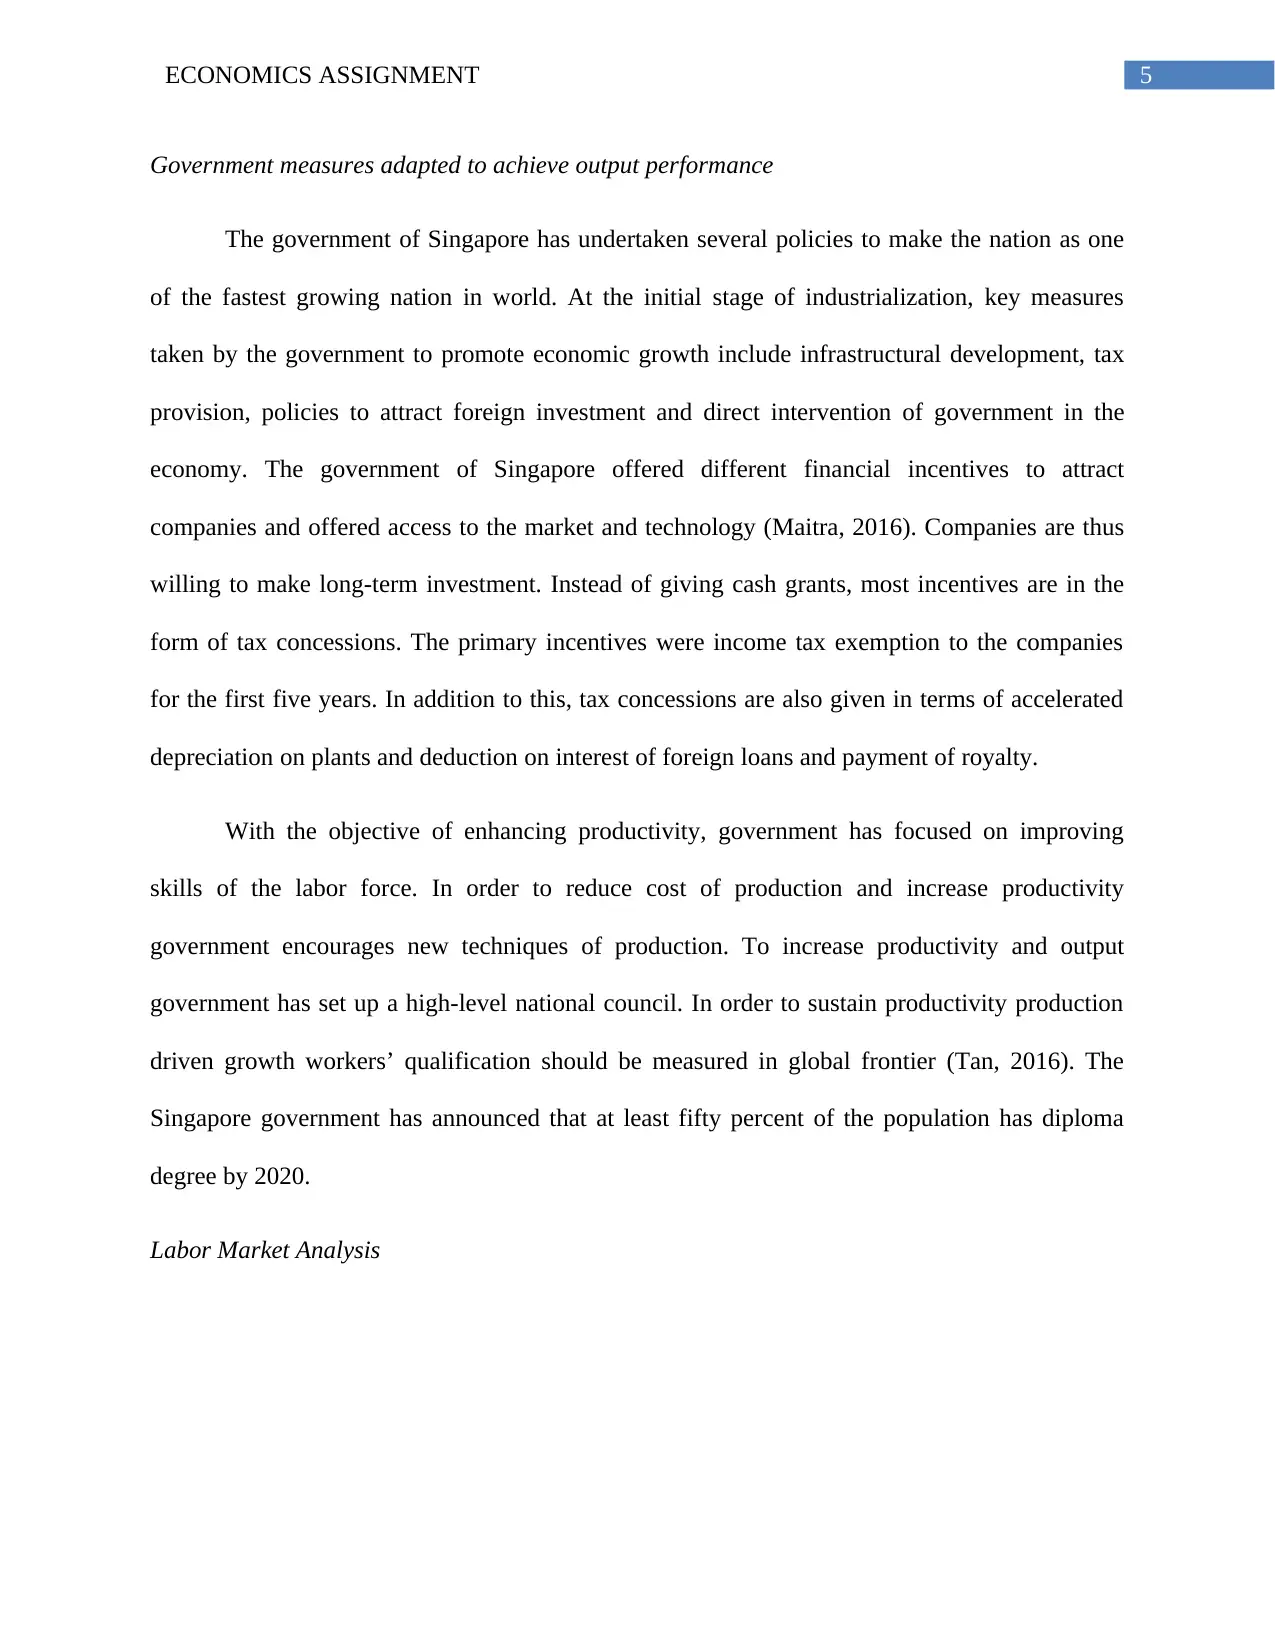
Figure 4: Unemployment trend in Singapore (2005-2014)
Above figure depicts the trend in general unemployment in Singapore. Overall, there is a
declining trend in rate of unemployment. Recorded unemployment rate in 2005 was 3.1 percent.
Unemployment fell sharply from 3.1 percent in 2005 to 2.1 percent in 2007 (data.worldbank.org,
2018). For the next two consecutive years, 2008 and 2009, unemployment rate increased to
become 3 percent in 2009. After that, unemployment rate started to fall continuously and reached
to 1.95 percent in 2014.
Main forms of unemployment in an economy
Unemployment describes a situation in the labor market where some members in the
labor force fail to find job the existing market wage. In an economy, different forms of
unemployment exist based on different reasons. The main forms of unemployment in an
economy is described below.
2004 2006 2008 2010 2012 2014 2016
1.5
1.7
1.9
2.1
2.3
2.5
2.7
2.9
3.1
3.3 3.1 3.1
2.1 2.2
3
2.1 2 1.9 1.9 1.95
Unemployment Rate
Unemployment Rate
Year
Rate of Unemployment
Figure 4: Unemployment trend in Singapore (2005-2014)
Above figure depicts the trend in general unemployment in Singapore. Overall, there is a
declining trend in rate of unemployment. Recorded unemployment rate in 2005 was 3.1 percent.
Unemployment fell sharply from 3.1 percent in 2005 to 2.1 percent in 2007 (data.worldbank.org,
2018). For the next two consecutive years, 2008 and 2009, unemployment rate increased to
become 3 percent in 2009. After that, unemployment rate started to fall continuously and reached
to 1.95 percent in 2014.
Main forms of unemployment in an economy
Unemployment describes a situation in the labor market where some members in the
labor force fail to find job the existing market wage. In an economy, different forms of
unemployment exist based on different reasons. The main forms of unemployment in an
economy is described below.
Paraphrase This Document
Need a fresh take? Get an instant paraphrase of this document with our AI Paraphraser
7ECONOMICS ASSIGNMENT
Unemployment caused due to the structural change in an economy is called structural
unemployment (Case, Fair & Oster, 2014). As structure of an industry changes, the skills of the
existing labor force does not match with requirement of the industry.
Unemployment related with business cycle fluctuation is known as cyclical
unemployment. Business cycle in an economy is described by the alternative phases of recession
and economic prosperity. During recession, the economy experiences a decline in economic
activity. Contraction in economic activity creates significant unemployment in the economy.
Another common form of unemployment in the economy is frictional unemployment
(Agénor & Montiel, 2015). This type of unemployment is created during the process of moving
between one jobs to another.
In addition to these form of unemployment, people in the economy often experiences
seasonal unemployment, disguised unemployment, technological unemployment and others.
Main types of unemployment in Singapore
In Singapore, the most prevalent form of unemployment are cyclical, structural and
frictional unemployment. In Singapore, lack of demand is one of the main cause of
unemployment. Being an export dependent nation, domestic demand varies greatly with external
demand. Following its trade dependency especially on US, Singapore experienced rise of
cyclical unemployment during global economic crisis occurred in 2008 (Tan, 2016).
The changing comparative advantage causes the nation to move from one industry to
another. When the nation shifted from secondary to tertiary sector, there occurs significant
mismatch between skills of the workers and new job requirement.
8ECONOMICS ASSIGNMENT
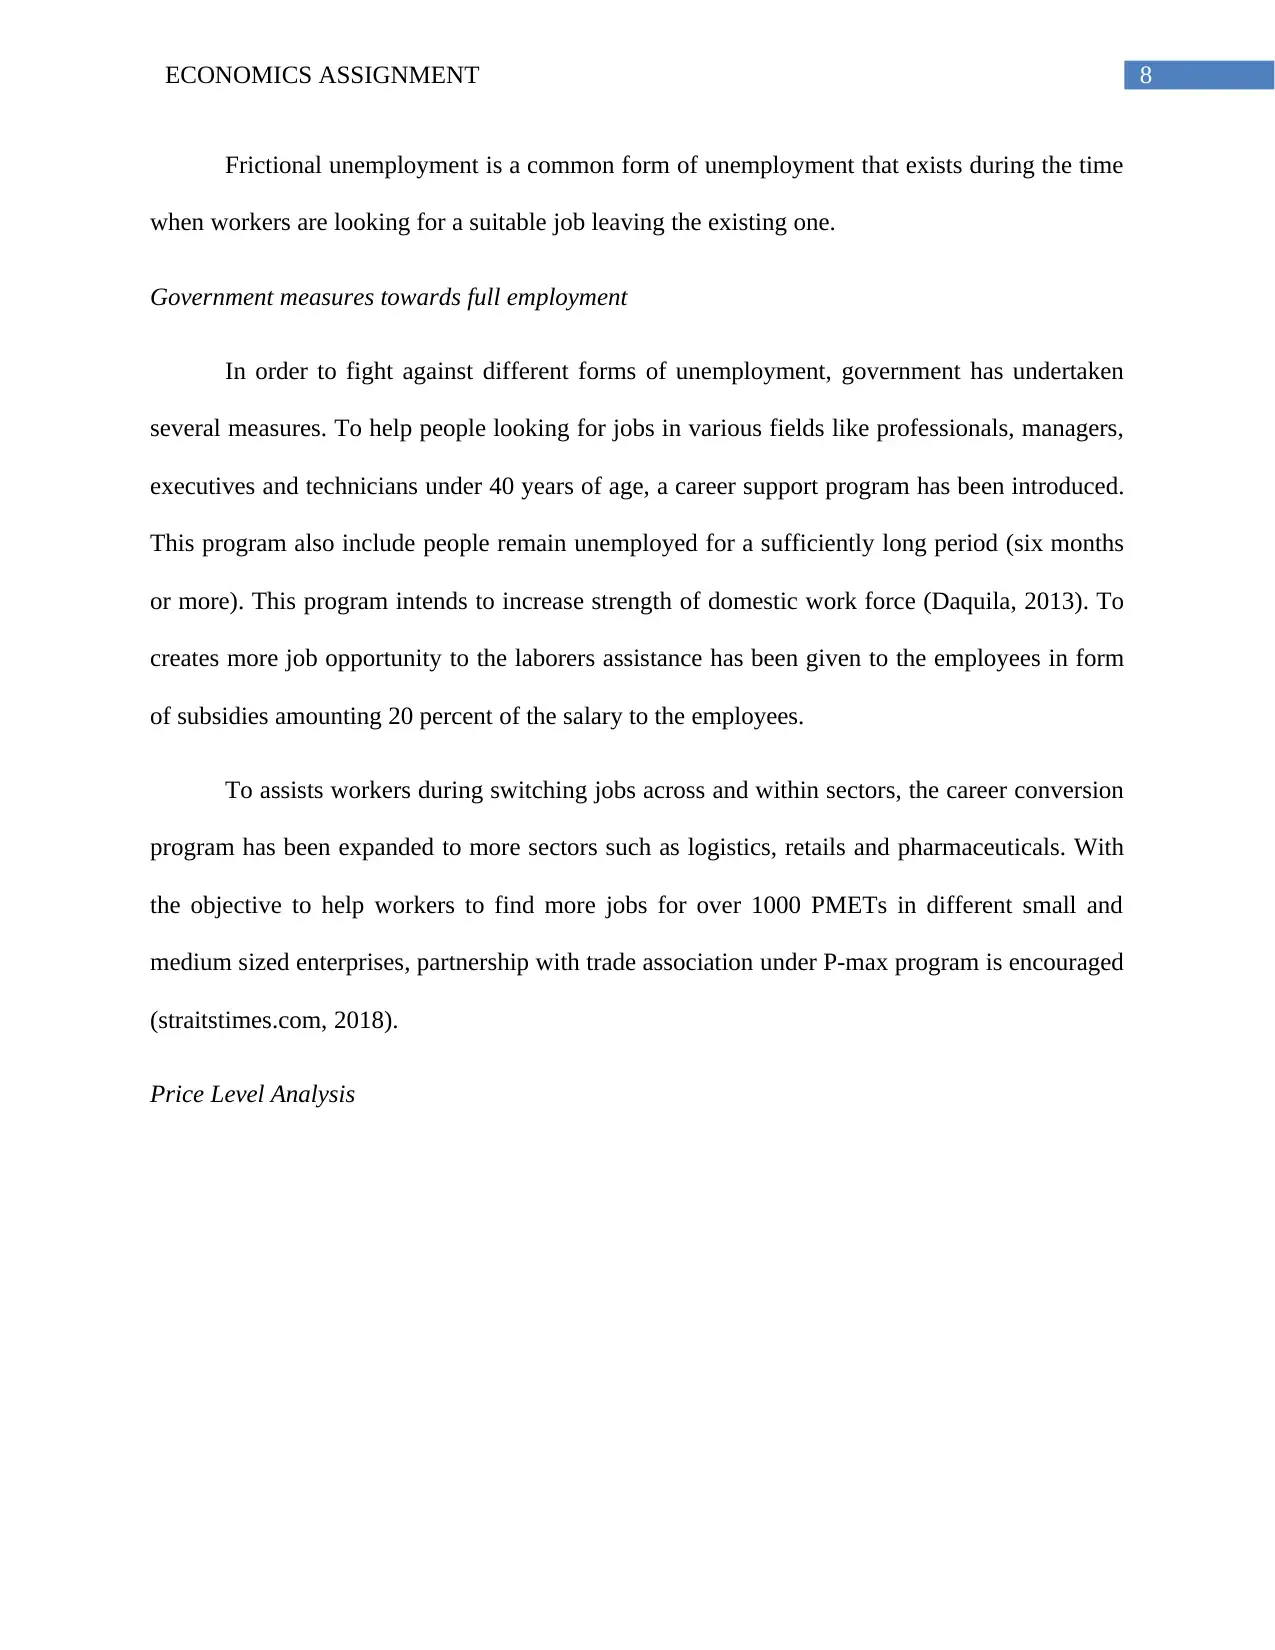
Frictional unemployment is a common form of unemployment that exists during the time
when workers are looking for a suitable job leaving the existing one.
Government measures towards full employment
In order to fight against different forms of unemployment, government has undertaken
several measures. To help people looking for jobs in various fields like professionals, managers,
executives and technicians under 40 years of age, a career support program has been introduced.
This program also include people remain unemployed for a sufficiently long period (six months
or more). This program intends to increase strength of domestic work force (Daquila, 2013). To
creates more job opportunity to the laborers assistance has been given to the employees in form
of subsidies amounting 20 percent of the salary to the employees.
To assists workers during switching jobs across and within sectors, the career conversion
program has been expanded to more sectors such as logistics, retails and pharmaceuticals. With
the objective to help workers to find more jobs for over 1000 PMETs in different small and
medium sized enterprises, partnership with trade association under P-max program is encouraged
(straitstimes.com, 2018).
Price Level Analysis
⊘ This is a preview!⊘
Do you want full access?
Subscribe today to unlock all pages.
Trusted by 1+ million students worldwide
9ECONOMICS ASSIGNMENT
2004 2006 2008 2010 2012 2014 2016
0
1
2
3
4
5
6
7
0.4
1
2.1
6.5
0.6
2.8
5.2
4.6
2.4
1.01
Infl ati on Rate
Inflation Rate
Year
Rate of inflation
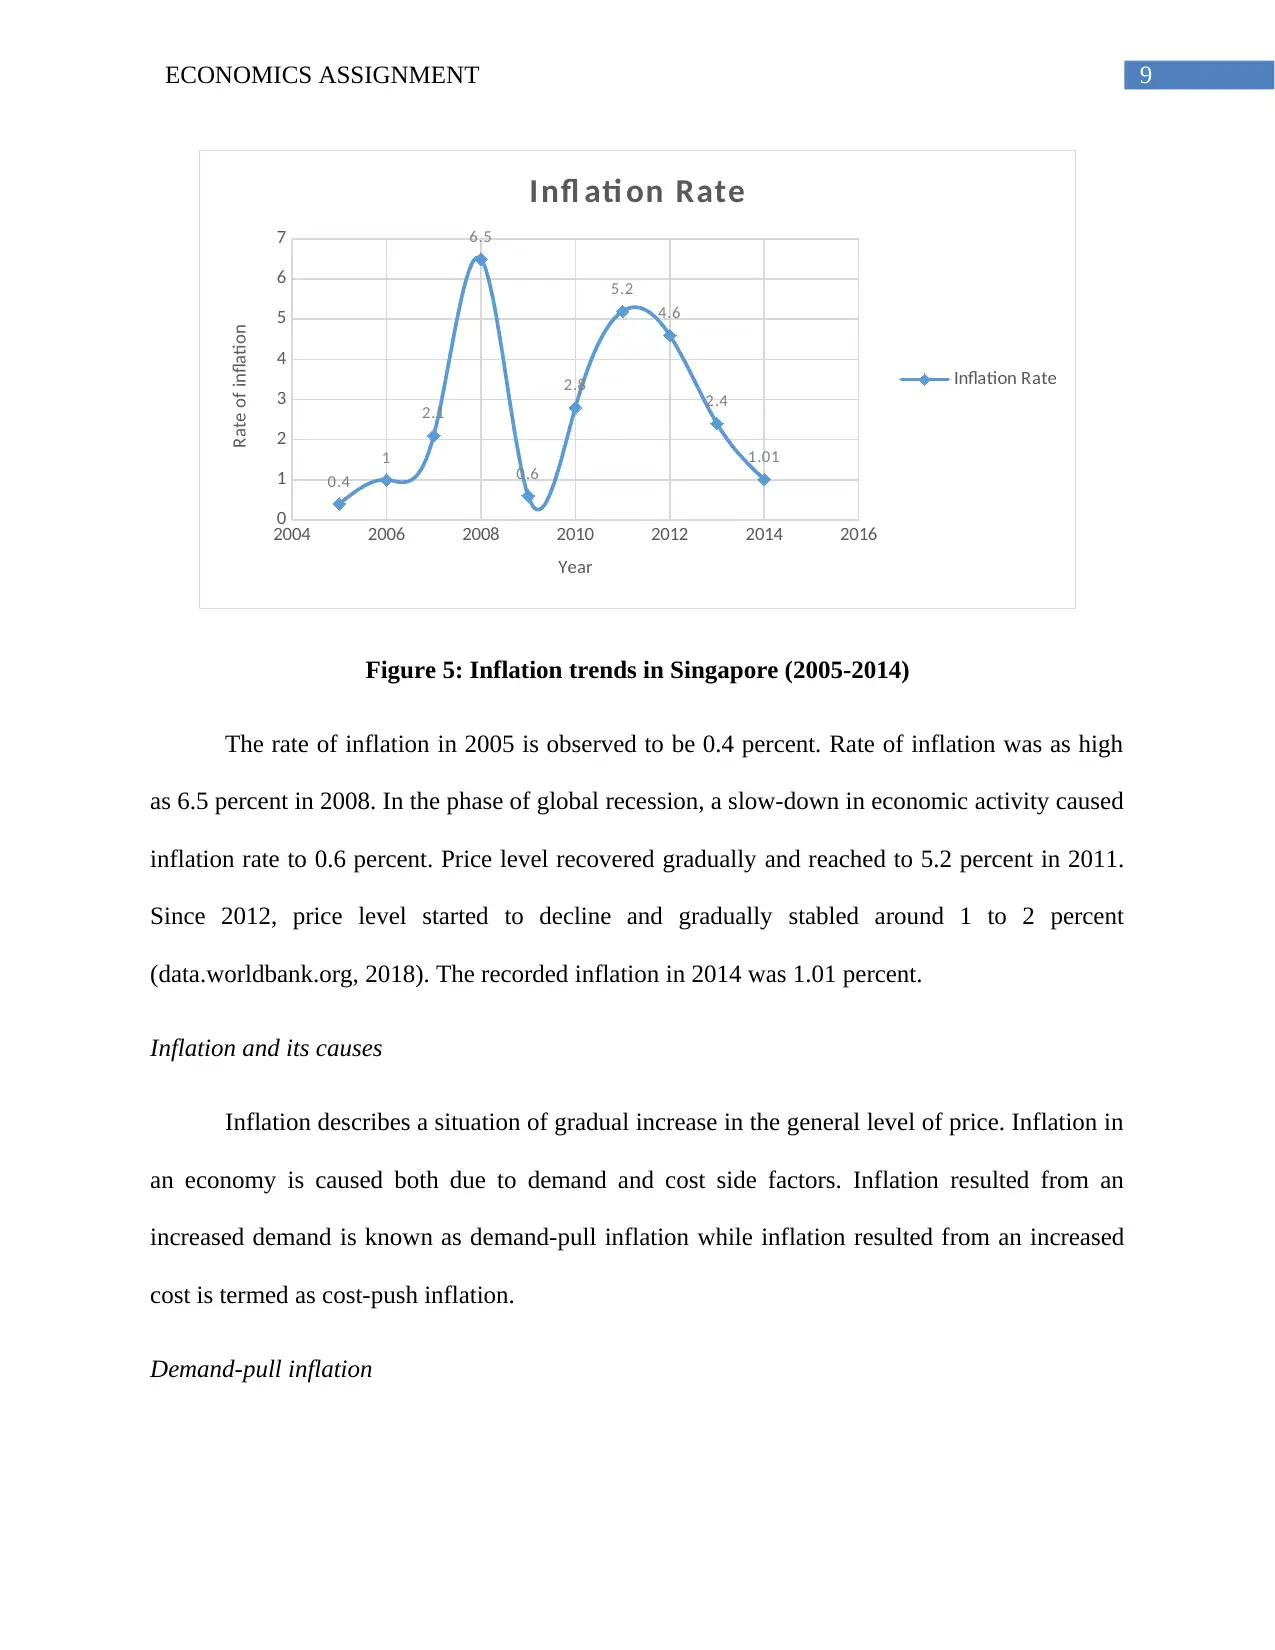
Figure 5: Inflation trends in Singapore (2005-2014)
The rate of inflation in 2005 is observed to be 0.4 percent. Rate of inflation was as high
as 6.5 percent in 2008. In the phase of global recession, a slow-down in economic activity caused
inflation rate to 0.6 percent. Price level recovered gradually and reached to 5.2 percent in 2011.
Since 2012, price level started to decline and gradually stabled around 1 to 2 percent
(data.worldbank.org, 2018). The recorded inflation in 2014 was 1.01 percent.
Inflation and its causes
Inflation describes a situation of gradual increase in the general level of price. Inflation in
an economy is caused both due to demand and cost side factors. Inflation resulted from an
increased demand is known as demand-pull inflation while inflation resulted from an increased
cost is termed as cost-push inflation.
Demand-pull inflation
2004 2006 2008 2010 2012 2014 2016
0
1
2
3
4
5
6
7
0.4
1
2.1
6.5
0.6
2.8
5.2
4.6
2.4
1.01
Infl ati on Rate
Inflation Rate
Year
Rate of inflation
Figure 5: Inflation trends in Singapore (2005-2014)
The rate of inflation in 2005 is observed to be 0.4 percent. Rate of inflation was as high
as 6.5 percent in 2008. In the phase of global recession, a slow-down in economic activity caused
inflation rate to 0.6 percent. Price level recovered gradually and reached to 5.2 percent in 2011.
Since 2012, price level started to decline and gradually stabled around 1 to 2 percent
(data.worldbank.org, 2018). The recorded inflation in 2014 was 1.01 percent.
Inflation and its causes
Inflation describes a situation of gradual increase in the general level of price. Inflation in
an economy is caused both due to demand and cost side factors. Inflation resulted from an
increased demand is known as demand-pull inflation while inflation resulted from an increased
cost is termed as cost-push inflation.
Demand-pull inflation
Paraphrase This Document
Need a fresh take? Get an instant paraphrase of this document with our AI Paraphraser

10ECONOMICS ASSIGNMENT
A sudden increase in aggregate demand causes demand-pull inflation. The aggregate
demand in an economy has four main sections- household, government, business and foreign
buyers. When the four main sectors attempts to buy more product over the production capacity,
the economic agents actually compete to purchase limited goods and services (Bernanke,
Antonovics & Frank, 2015). The excess of demand over the supply causes prices to increase.
Cost-pull inflation
An economy likely to experience cost push inflation when there is a decline in aggregate
supply following an increase in cost of production. Cost-push inflation can occur due to rise in
any one of the four factors of production (Agénor & Montiel, 2015). In the phase of rising
production cost, companies maintain their profit margin by charging a high price on goods and
services.
Causes of inflation in Singapore
Two common form of inflation in Singapore are demand-pull and cost-push inflation. In
addition to these two types of inflation, the economy also suffered from imported inflation.
Demand-pull inflation in Singapore occurs as the aggregate demand in the economy
exceeds the aggregate supply. Factor responsible for demand-pull inflation in Singapore include
high government spending in police or defense force and in net export (Gerlach & Tillmann,
2012).
The economy of Singapore experiences cost-push inflation due to the increase in wage
cost. Increases in prices of food, exchange rate and property prices are other factors responsible
for cost-push inflation.
11ECONOMICS ASSIGNMENT
Depreciation of domestic currency raises the cost of imported goods leading to imported
inflation in Singapore (Mihov & Santacreu, 2013).
Government measures towards price stability
Government of Singapore has taken several policies to the stabilize price. The imported
inflation is controlled through stabilizing exchange rate. Policies are taken to appreciate
currency. Appreciation of domestic currency makes imported goods cheaper and controls the
price level. Singapore government takes supply side policies to address demand-pull inflation.
The supply side policies include improvement in quality of workers by arranging skill
development program (gov.sg, 2018). To curb inflationary pressure government also provides
direct assistance to middle and lower income household.
Conclusion
The essay briefly discusses performance of Singapore economy for ten years, from 2005
to 2014. In order to analyze economic performance, focus has been given on three main
dimensions- output, labor market and price level. Output of the economy is measured in terms of
real GDP, growth in real GDP and per capita real GDP. Except in the period of global financial
crisis, real GDP of Singapore for the chosen period has constituted an upward rising trend. The
economic growth rate measured by the growth in real GDP has found to constitute a fluctuating
trend. With a stable population and rising trend in real GDP, per capita real GDP increases as
well. Government of Singapore has undertaken several policies to enhance productivity and
output. Key policy measures of government include offering tax concessions to multinational
companies, arranging skill development program, improvement in level of education and others.
Singapore suffers from different types of unemployment. Structural shift in the economy causes
⊘ This is a preview!⊘
Do you want full access?
Subscribe today to unlock all pages.
Trusted by 1+ million students worldwide
1 out of 15
Related Documents


Your All-in-One AI-Powered Toolkit for Academic Success.
+13062052269
info@desklib.com
Available 24*7 on WhatsApp / Email
![[object Object]](/_next/static/media/star-bottom.7253800d.svg)
Unlock your academic potential
Copyright © 2020–2026 A2Z Services. All Rights Reserved. Developed and managed by ZUCOL.