Analysis of SCC in Singapore Retail: Business Research Methods Report
VerifiedAdded on 2023/06/08
|12
|2175
|98
Report
AI Summary
This report delves into business research methods, focusing on the Singapore retail industry, particularly the use of self-checkout counters (SCC). It begins with an analysis of the purpose of the research, research questions, and the survey instrument employed. The study investigates demographic factors influencing SCC usage and perceptual differences between users and non-users. Statistical methods, including chi-square tests, t-tests, and Cronbach's alpha for reliability, are discussed. The report then presents findings, highlighting the absence of significant demographic differences in SCC usage, and interprets the statistical results. Two case studies are included. The first case study analyzes consumer behavior regarding Amazon Fresh using hypothesis testing. The second case study examines entrepreneurship intention among students, including statistical analysis, and ANOVA tests. The report concludes with references and appendices containing supporting data.

BUSINESS RESEARCH
METHODS
METHODS
Paraphrase This Document
Need a fresh take? Get an instant paraphrase of this document with our AI Paraphraser
Table of Contents
Part one............................................................................................................................................3
1...................................................................................................................................................3
2...................................................................................................................................................3
3...................................................................................................................................................4
5...................................................................................................................................................4
Part Two...........................................................................................................................................5
Case Study 1....................................................................................................................................5
Case Study 2....................................................................................................................................6
References........................................................................................................................................8
APPENDIX......................................................................................................................................9
Part one
1.
Purpose of the research paper
The purpose of this research article is to establish the comparison among the non-users & users
of Self – checkout counters (SCC) in order to determine how their preferences differ with
regards to the retail industry of Singapore.
Research questions
1. What are the differences associated with demographic factors of the non-users and users of
SCC in Singapore?
2. What are the perceptual differences exist among the non-users & users of SCC in terms of
perceiving the characteristics of SCC within the retail industry of Singapore?
3. What are the differences in situational factors affecting the intention of users & non-users of
SCC with respect to using the SCC?
2.
a.
Survey Instrument has been organized into three sections in the given research article, which are
as follows:
The first section involves measurement of whether the respondent is a user or non-user of
SCC along with the information pertaining to the respondent’s demographic profile.
The second section involves measurement of respondent’s perception with regards to the
relative advantages of SCC through five – point Likert scale.
The third question is about situational analysis to indicate the chances of using SCC
through 7 five – point Likert scale statements.
b. The name of the concept that would be measured in second section is perception of users &
non-users of SCC. It was further divided into four different factors which involves Fun, relative
advantage, reliability and perceived complexity. For measuring each of these factor, the
researcher has adopted the three item scale similar to previous studies.
⊘ This is a preview!⊘
Do you want full access?
Subscribe today to unlock all pages.
Trusted by 1+ million students worldwide
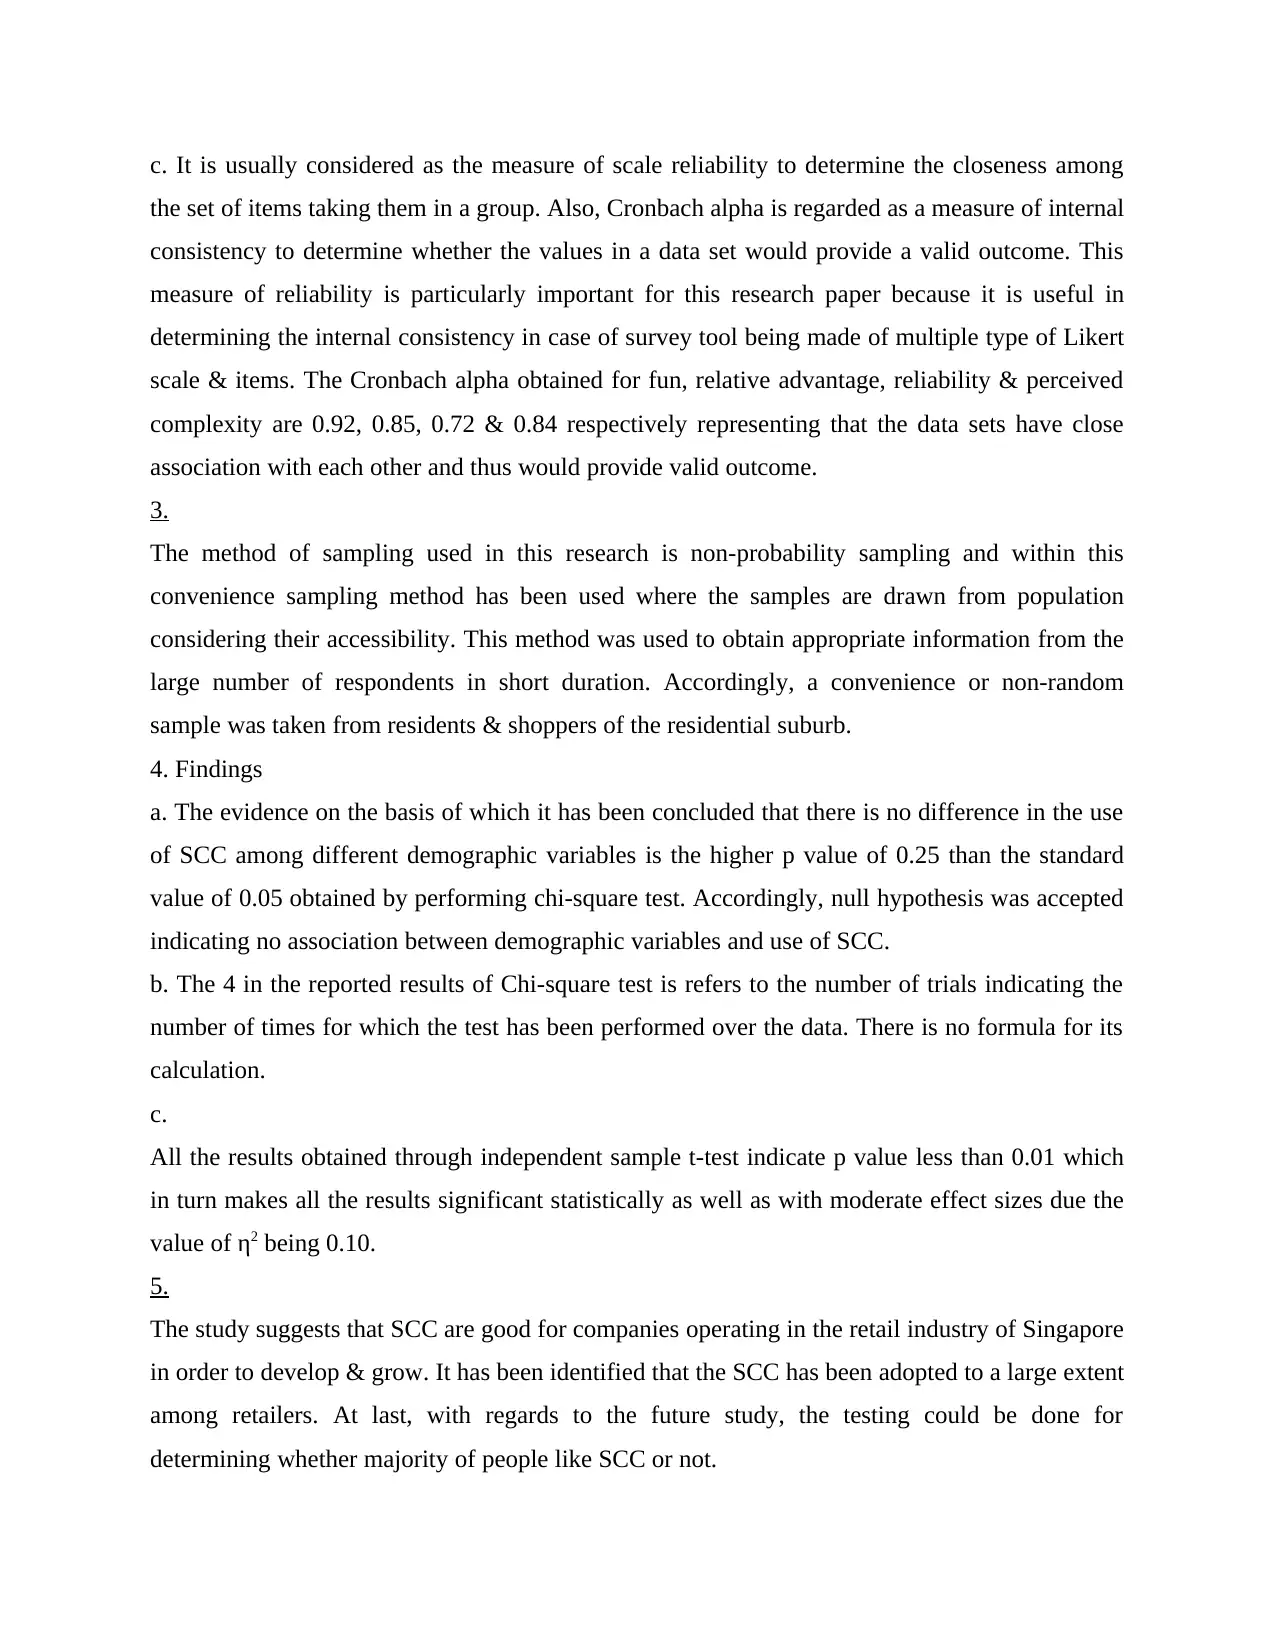
c. It is usually considered as the measure of scale reliability to determine the closeness among
the set of items taking them in a group. Also, Cronbach alpha is regarded as a measure of internal
consistency to determine whether the values in a data set would provide a valid outcome. This
measure of reliability is particularly important for this research paper because it is useful in
determining the internal consistency in case of survey tool being made of multiple type of Likert
scale & items. The Cronbach alpha obtained for fun, relative advantage, reliability & perceived
complexity are 0.92, 0.85, 0.72 & 0.84 respectively representing that the data sets have close
association with each other and thus would provide valid outcome.
3.
The method of sampling used in this research is non-probability sampling and within this
convenience sampling method has been used where the samples are drawn from population
considering their accessibility. This method was used to obtain appropriate information from the
large number of respondents in short duration. Accordingly, a convenience or non-random
sample was taken from residents & shoppers of the residential suburb.
4. Findings
a. The evidence on the basis of which it has been concluded that there is no difference in the use
of SCC among different demographic variables is the higher p value of 0.25 than the standard
value of 0.05 obtained by performing chi-square test. Accordingly, null hypothesis was accepted
indicating no association between demographic variables and use of SCC.
b. The 4 in the reported results of Chi-square test is refers to the number of trials indicating the
number of times for which the test has been performed over the data. There is no formula for its
calculation.
c.
All the results obtained through independent sample t-test indicate p value less than 0.01 which
in turn makes all the results significant statistically as well as with moderate effect sizes due the
value of η2 being 0.10.
5.
The study suggests that SCC are good for companies operating in the retail industry of Singapore
in order to develop & grow. It has been identified that the SCC has been adopted to a large extent
among retailers. At last, with regards to the future study, the testing could be done for
determining whether majority of people like SCC or not.
Paraphrase This Document
Need a fresh take? Get an instant paraphrase of this document with our AI Paraphraser
Part Two
Case Study 1
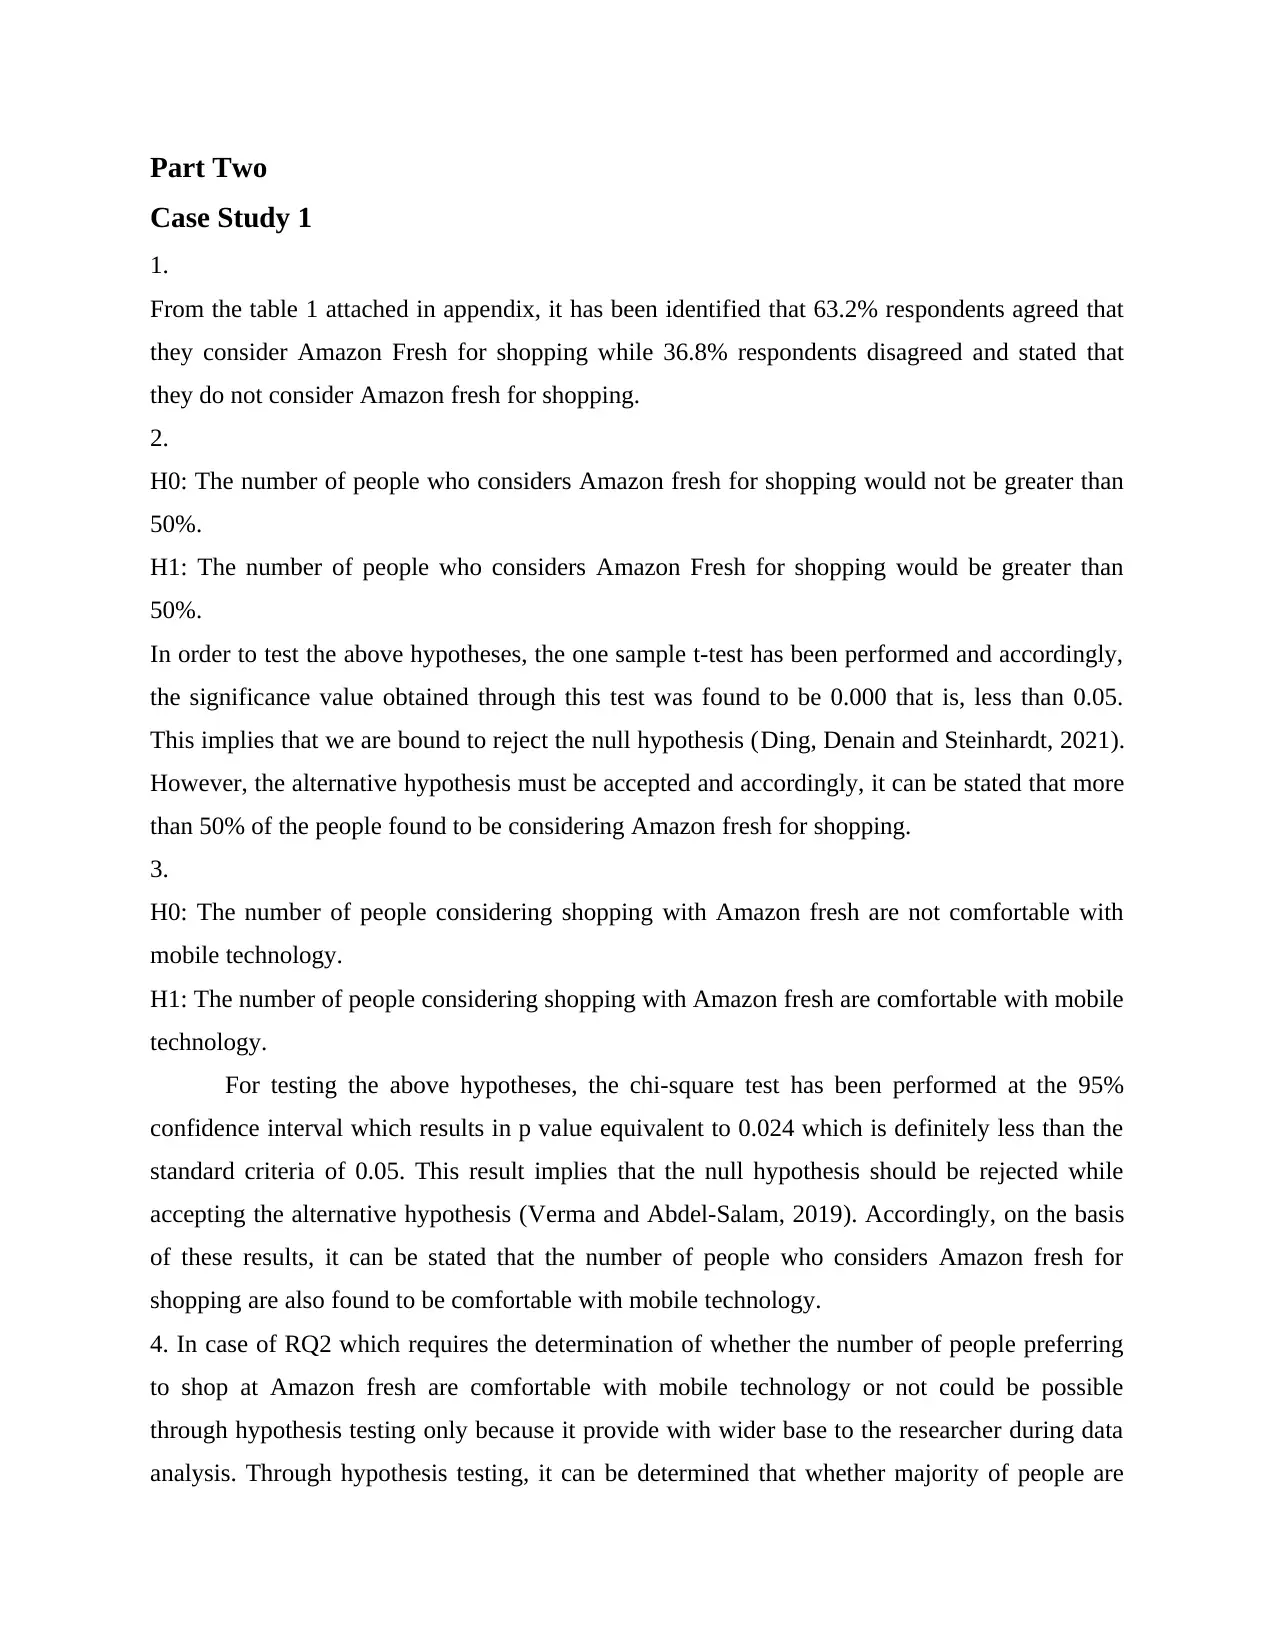
1.
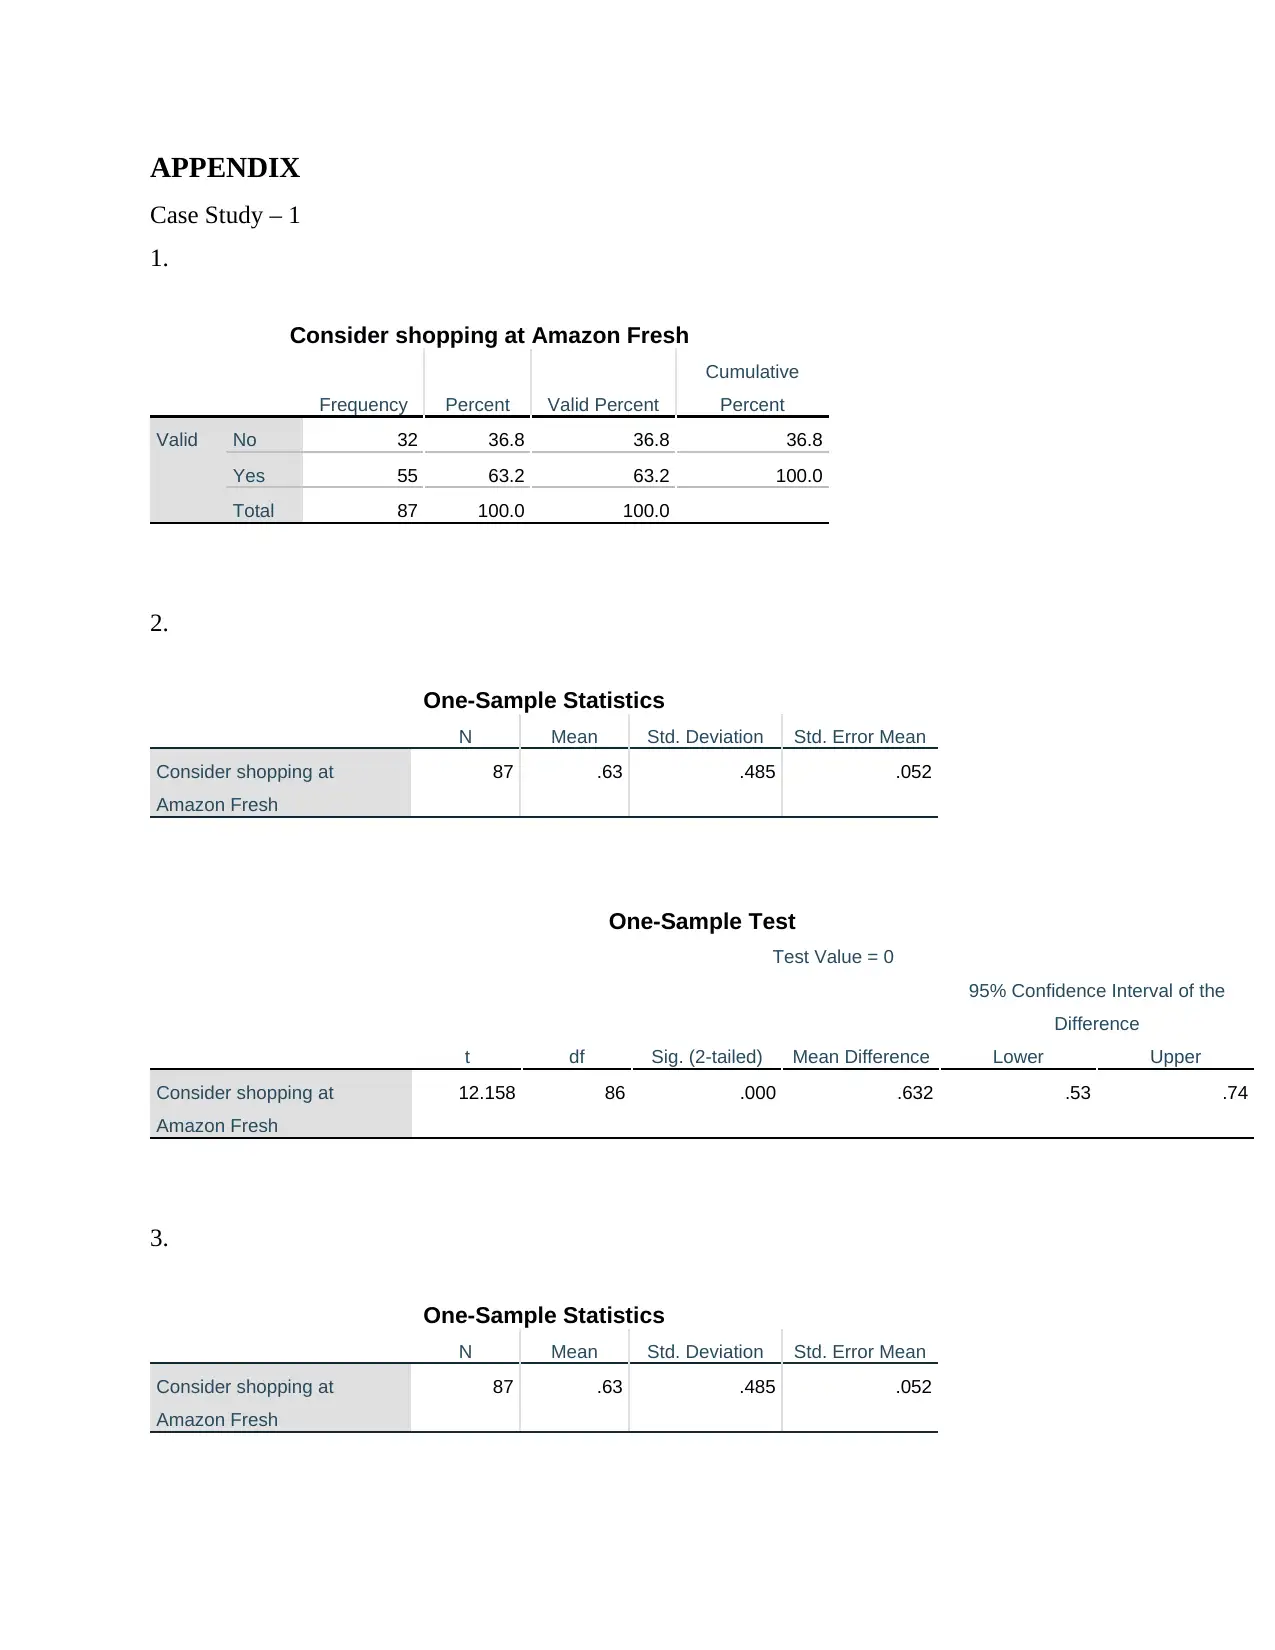
From the table 1 attached in appendix, it has been identified that 63.2% respondents agreed that
they consider Amazon Fresh for shopping while 36.8% respondents disagreed and stated that
they do not consider Amazon fresh for shopping.
2.
H0: The number of people who considers Amazon fresh for shopping would not be greater than
50%.
H1: The number of people who considers Amazon Fresh for shopping would be greater than
50%.
In order to test the above hypotheses, the one sample t-test has been performed and accordingly,
the significance value obtained through this test was found to be 0.000 that is, less than 0.05.
This implies that we are bound to reject the null hypothesis (Ding, Denain and Steinhardt, 2021).
However, the alternative hypothesis must be accepted and accordingly, it can be stated that more
than 50% of the people found to be considering Amazon fresh for shopping.
3.
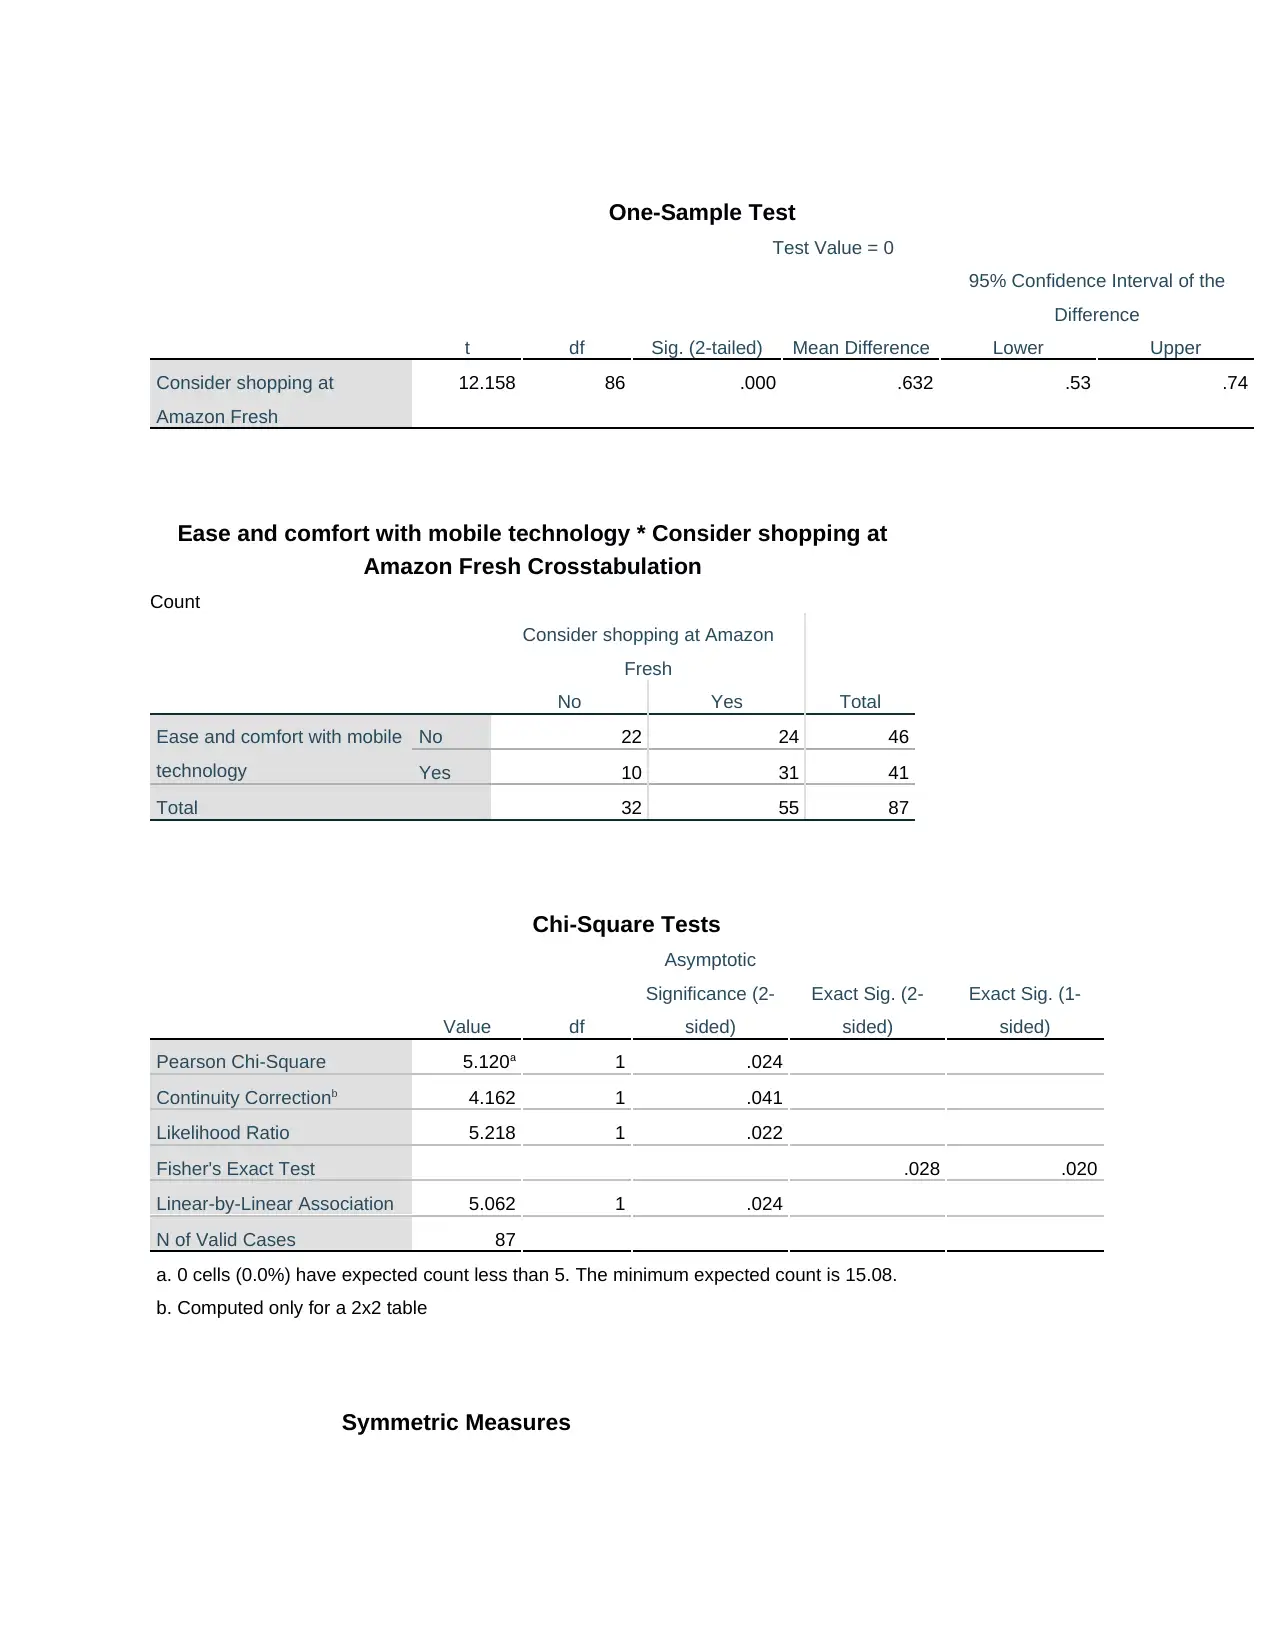
H0: The number of people considering shopping with Amazon fresh are not comfortable with
mobile technology.
H1: The number of people considering shopping with Amazon fresh are comfortable with mobile
technology.
For testing the above hypotheses, the chi-square test has been performed at the 95%
confidence interval which results in p value equivalent to 0.024 which is definitely less than the
standard criteria of 0.05. This result implies that the null hypothesis should be rejected while
accepting the alternative hypothesis (Verma and Abdel-Salam, 2019). Accordingly, on the basis
of these results, it can be stated that the number of people who considers Amazon fresh for
shopping are also found to be comfortable with mobile technology.
4. In case of RQ2 which requires the determination of whether the number of people preferring
to shop at Amazon fresh are comfortable with mobile technology or not could be possible
through hypothesis testing only because it provide with wider base to the researcher during data
analysis. Through hypothesis testing, it can be determined that whether majority of people are
Case Study 1
1.
From the table 1 attached in appendix, it has been identified that 63.2% respondents agreed that
they consider Amazon Fresh for shopping while 36.8% respondents disagreed and stated that
they do not consider Amazon fresh for shopping.
2.
H0: The number of people who considers Amazon fresh for shopping would not be greater than
50%.
H1: The number of people who considers Amazon Fresh for shopping would be greater than
50%.
In order to test the above hypotheses, the one sample t-test has been performed and accordingly,
the significance value obtained through this test was found to be 0.000 that is, less than 0.05.
This implies that we are bound to reject the null hypothesis (Ding, Denain and Steinhardt, 2021).
However, the alternative hypothesis must be accepted and accordingly, it can be stated that more
than 50% of the people found to be considering Amazon fresh for shopping.
3.
H0: The number of people considering shopping with Amazon fresh are not comfortable with
mobile technology.
H1: The number of people considering shopping with Amazon fresh are comfortable with mobile
technology.
For testing the above hypotheses, the chi-square test has been performed at the 95%
confidence interval which results in p value equivalent to 0.024 which is definitely less than the
standard criteria of 0.05. This result implies that the null hypothesis should be rejected while
accepting the alternative hypothesis (Verma and Abdel-Salam, 2019). Accordingly, on the basis
of these results, it can be stated that the number of people who considers Amazon fresh for
shopping are also found to be comfortable with mobile technology.
4. In case of RQ2 which requires the determination of whether the number of people preferring
to shop at Amazon fresh are comfortable with mobile technology or not could be possible
through hypothesis testing only because it provide with wider base to the researcher during data
analysis. Through hypothesis testing, it can be determined that whether majority of people are
preferring to shop at Amazon fresh or not along with determining their comfortability with
mobile technology while shopping at Amazon fresh. However, sample statistics would not be
useful in determining the acceptance or rejection of hypothesis and accordingly claiming that
some kind of fact is true because sample statistics is useful in determining the central tendency
only.
Case Study 2
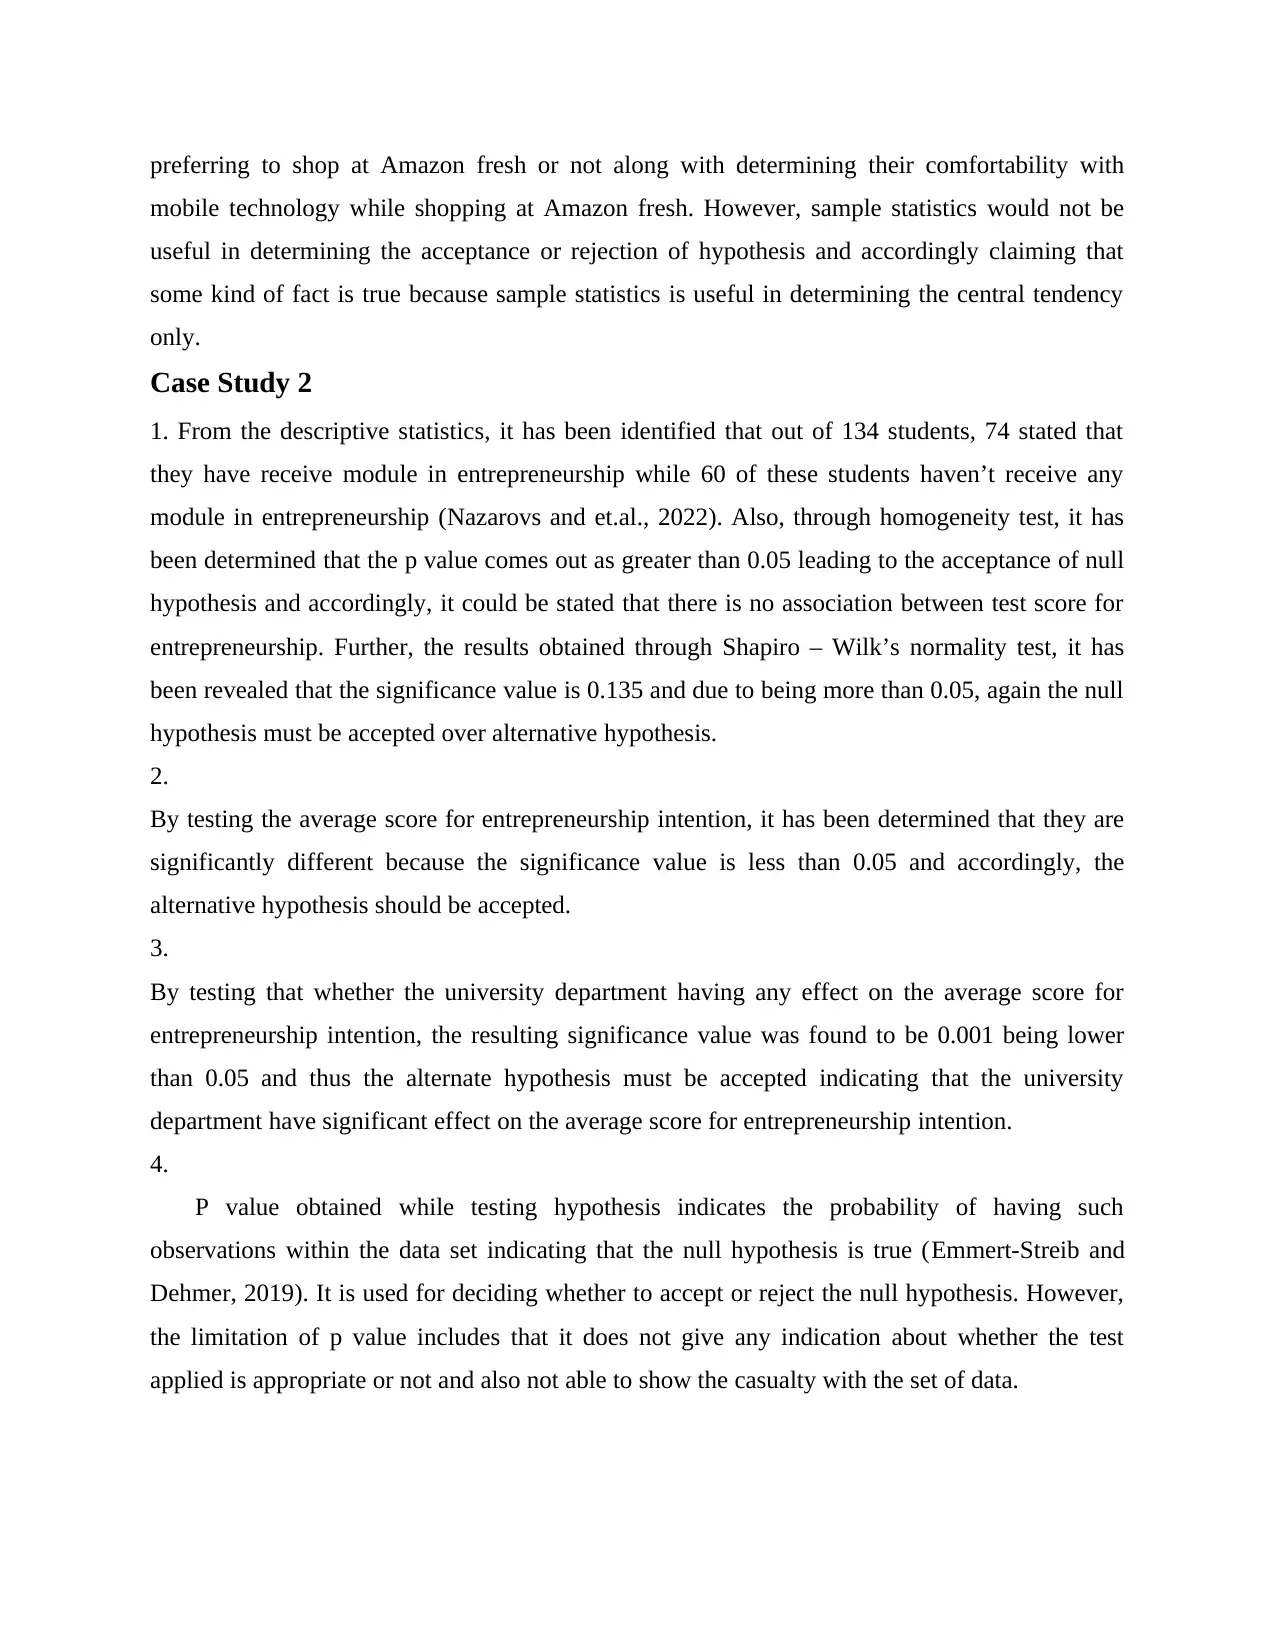
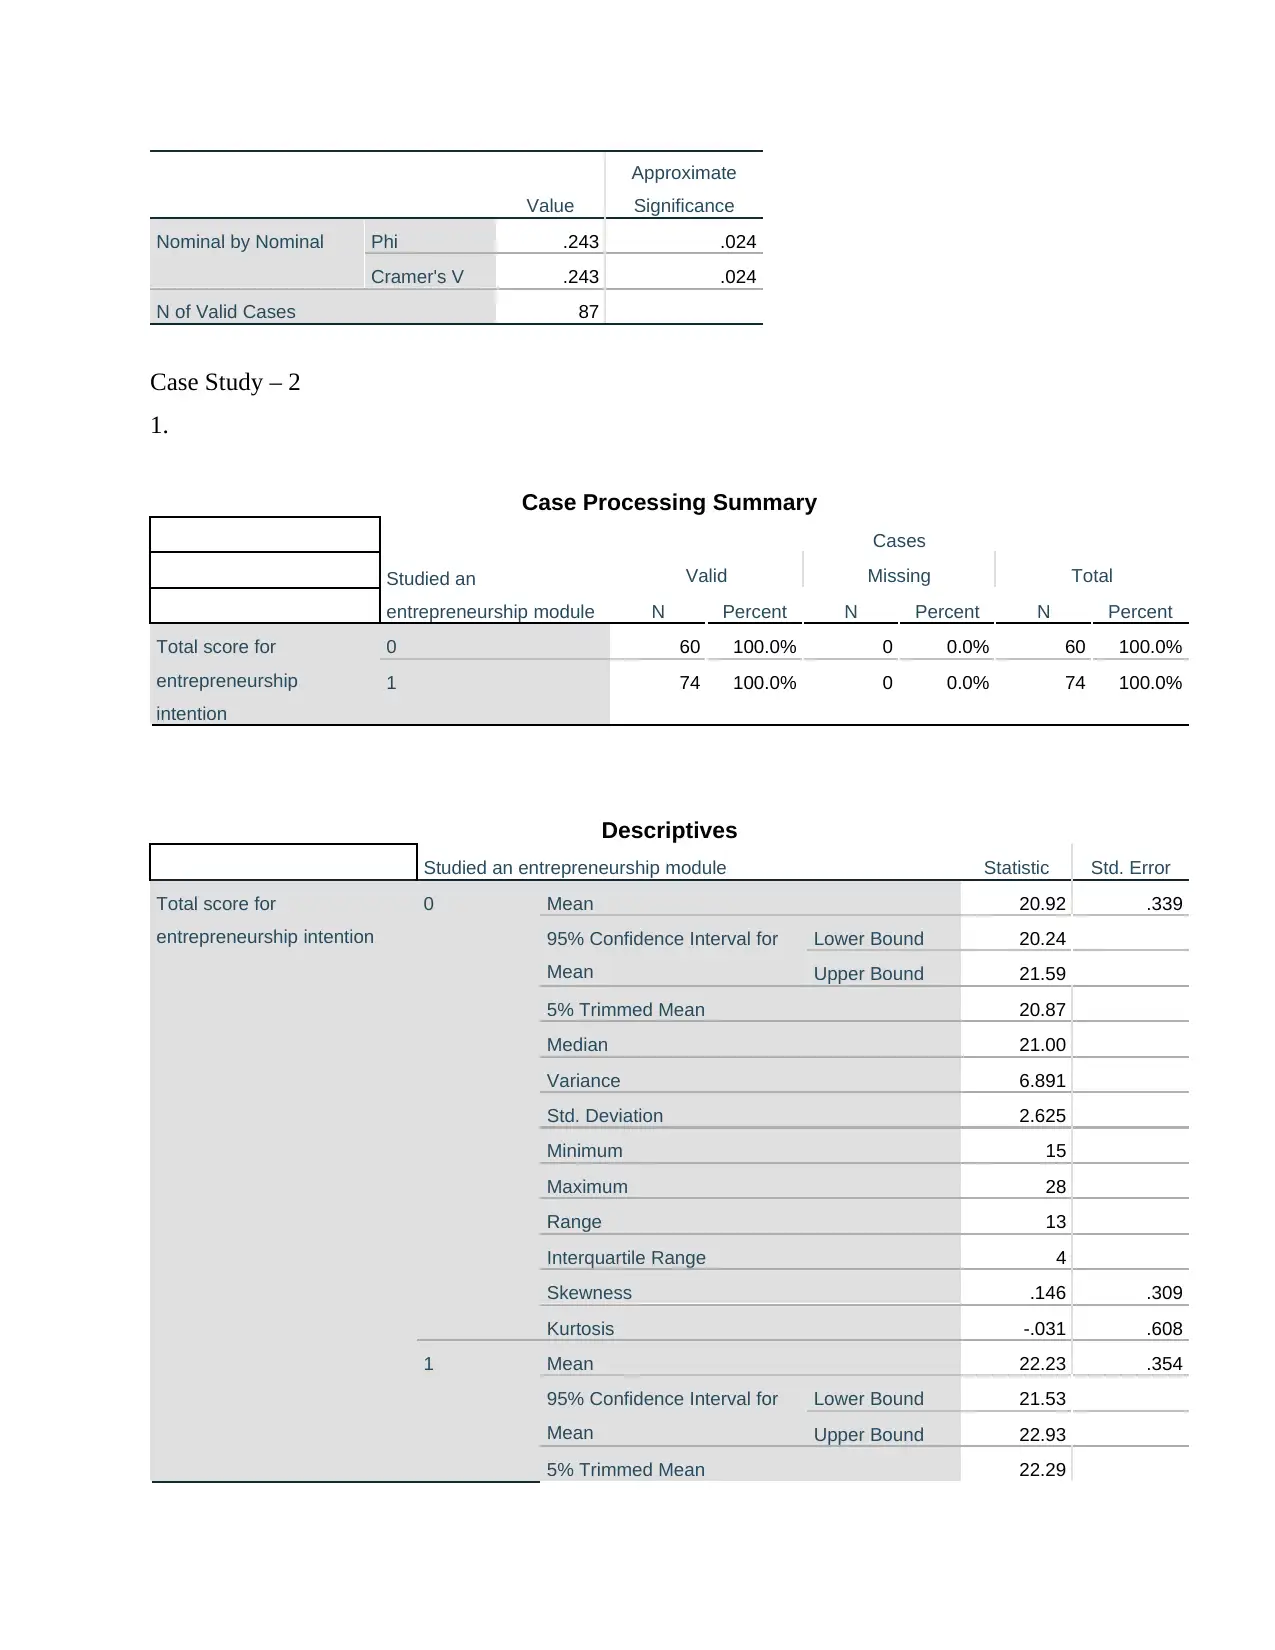
1. From the descriptive statistics, it has been identified that out of 134 students, 74 stated that
they have receive module in entrepreneurship while 60 of these students haven’t receive any
module in entrepreneurship (Nazarovs and et.al., 2022). Also, through homogeneity test, it has
been determined that the p value comes out as greater than 0.05 leading to the acceptance of null
hypothesis and accordingly, it could be stated that there is no association between test score for
entrepreneurship. Further, the results obtained through Shapiro – Wilk’s normality test, it has
been revealed that the significance value is 0.135 and due to being more than 0.05, again the null
hypothesis must be accepted over alternative hypothesis.
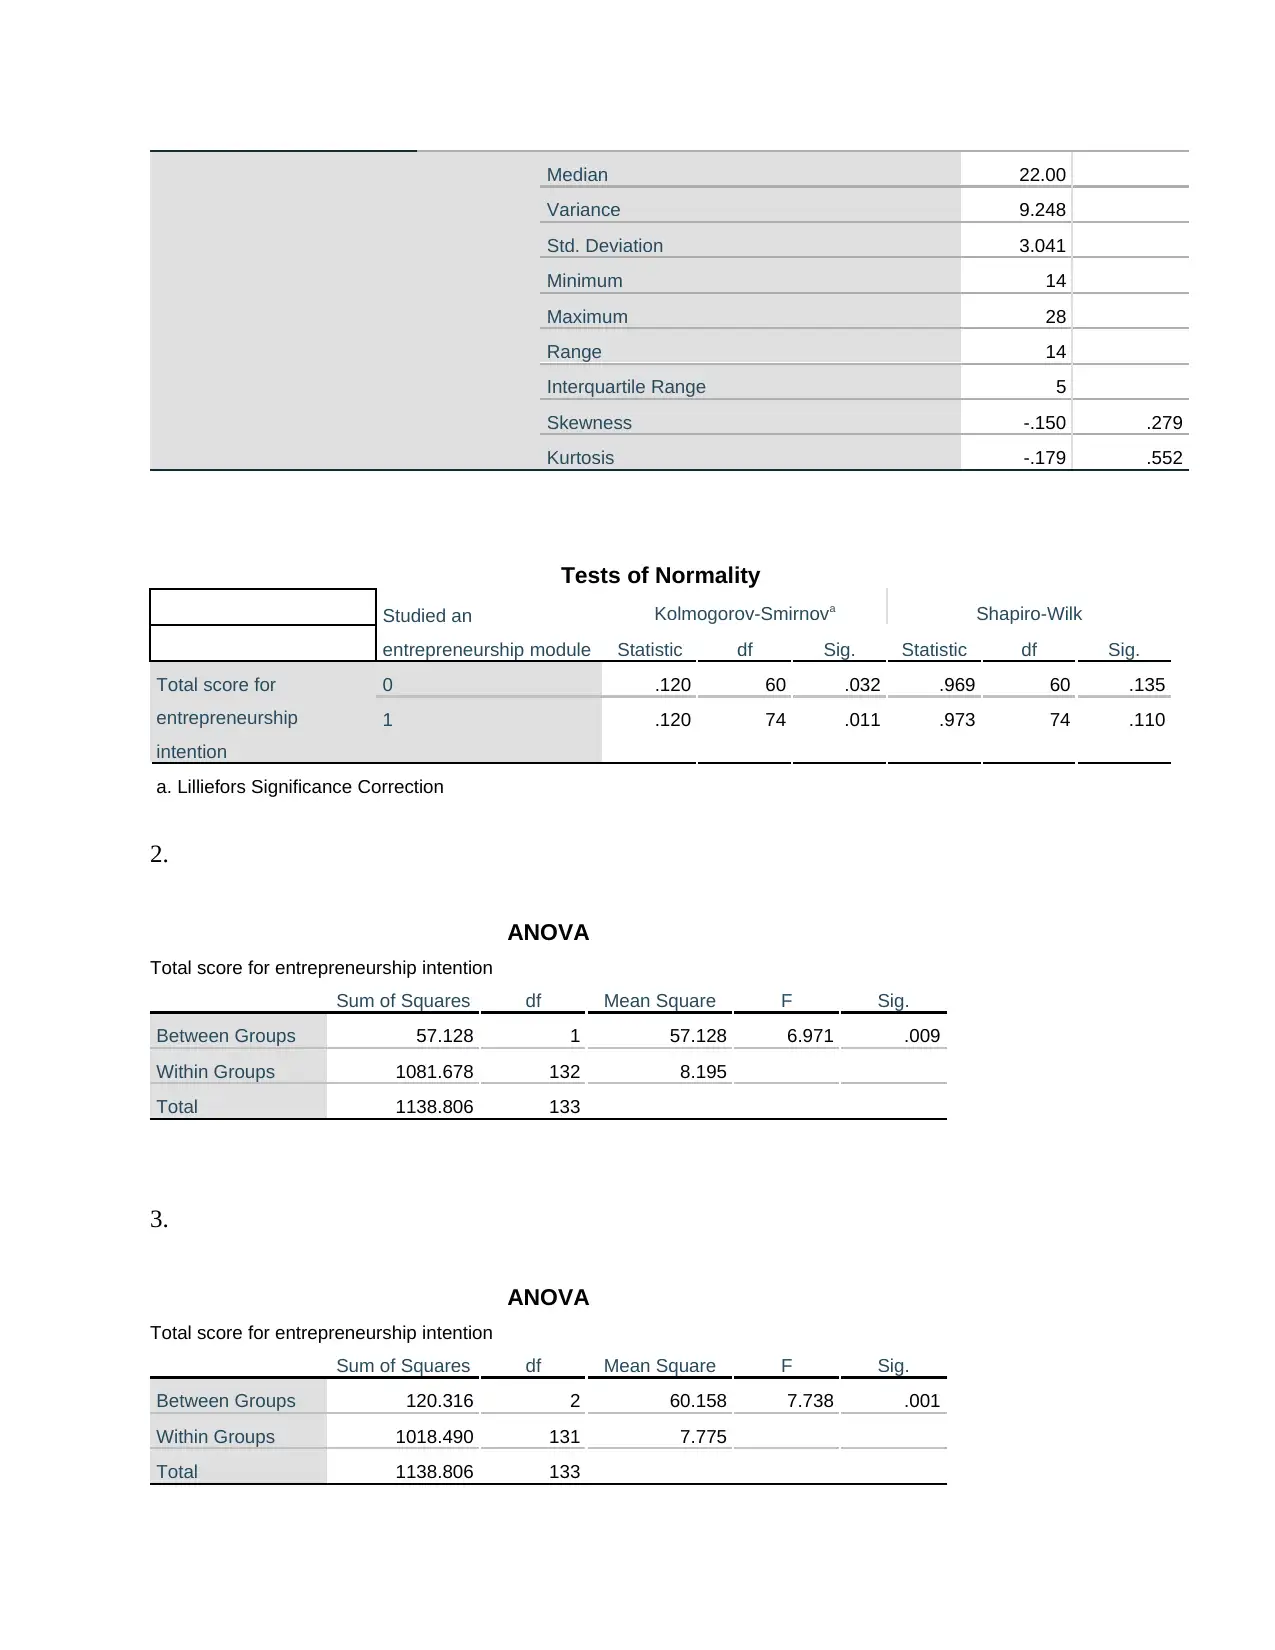
2.
By testing the average score for entrepreneurship intention, it has been determined that they are
significantly different because the significance value is less than 0.05 and accordingly, the
alternative hypothesis should be accepted.
3.
By testing that whether the university department having any effect on the average score for
entrepreneurship intention, the resulting significance value was found to be 0.001 being lower
than 0.05 and thus the alternate hypothesis must be accepted indicating that the university
department have significant effect on the average score for entrepreneurship intention.
4.
P value obtained while testing hypothesis indicates the probability of having such
observations within the data set indicating that the null hypothesis is true (Emmert-Streib and
Dehmer, 2019). It is used for deciding whether to accept or reject the null hypothesis. However,
the limitation of p value includes that it does not give any indication about whether the test
applied is appropriate or not and also not able to show the casualty with the set of data.
mobile technology while shopping at Amazon fresh. However, sample statistics would not be
useful in determining the acceptance or rejection of hypothesis and accordingly claiming that
some kind of fact is true because sample statistics is useful in determining the central tendency
only.
Case Study 2
1. From the descriptive statistics, it has been identified that out of 134 students, 74 stated that
they have receive module in entrepreneurship while 60 of these students haven’t receive any
module in entrepreneurship (Nazarovs and et.al., 2022). Also, through homogeneity test, it has
been determined that the p value comes out as greater than 0.05 leading to the acceptance of null
hypothesis and accordingly, it could be stated that there is no association between test score for
entrepreneurship. Further, the results obtained through Shapiro – Wilk’s normality test, it has
been revealed that the significance value is 0.135 and due to being more than 0.05, again the null
hypothesis must be accepted over alternative hypothesis.
2.
By testing the average score for entrepreneurship intention, it has been determined that they are
significantly different because the significance value is less than 0.05 and accordingly, the
alternative hypothesis should be accepted.
3.
By testing that whether the university department having any effect on the average score for
entrepreneurship intention, the resulting significance value was found to be 0.001 being lower
than 0.05 and thus the alternate hypothesis must be accepted indicating that the university
department have significant effect on the average score for entrepreneurship intention.
4.
P value obtained while testing hypothesis indicates the probability of having such
observations within the data set indicating that the null hypothesis is true (Emmert-Streib and
Dehmer, 2019). It is used for deciding whether to accept or reject the null hypothesis. However,
the limitation of p value includes that it does not give any indication about whether the test
applied is appropriate or not and also not able to show the casualty with the set of data.
⊘ This is a preview!⊘
Do you want full access?
Subscribe today to unlock all pages.
Trusted by 1+ million students worldwide
References
Nazarovs, J., and et.al., 2022. Understanding Uncertainty Maps in Vision With Statistical
Testing. In Proceedings of the IEEE/CVF Conference on Computer Vision and Pattern
Recognition (pp. 406-416).
Ding, F., Denain, J. S. and Steinhardt, J., 2021. Grounding Representation Similarity Through
Statistical Testing. Advances in Neural Information Processing Systems, 34, pp.1556-
1568.
Emmert-Streib, F. and Dehmer, M., 2019. Understanding statistical hypothesis testing: The logic
of statistical inference. Machine Learning and Knowledge Extraction, 1(3), pp.945-962.
Verma, J. P. and Abdel-Salam, A. S. G., 2019. Testing statistical assumptions in research. John
Wiley & Sons.
Paraphrase This Document
Need a fresh take? Get an instant paraphrase of this document with our AI Paraphraser
APPENDIX
Case Study – 1
1.
Consider shopping at Amazon Fresh
Frequency Percent Valid Percent
Cumulative
Percent
Valid No 32 36.8 36.8 36.8
Yes 55 63.2 63.2 100.0
Total 87 100.0 100.0
2.
One-Sample Statistics
N Mean Std. Deviation Std. Error Mean
Consider shopping at
Amazon Fresh
87 .63 .485 .052
One-Sample Test
Test Value = 0
t df Sig. (2-tailed) Mean Difference
95% Confidence Interval of the
Difference
Lower Upper
Consider shopping at
Amazon Fresh
12.158 86 .000 .632 .53 .74
3.
One-Sample Statistics
N Mean Std. Deviation Std. Error Mean
Consider shopping at
Amazon Fresh
87 .63 .485 .052
One-Sample Test
Test Value = 0
t df Sig. (2-tailed) Mean Difference
95% Confidence Interval of the
Difference
Lower Upper
Consider shopping at
Amazon Fresh
12.158 86 .000 .632 .53 .74
Ease and comfort with mobile technology * Consider shopping at
Amazon Fresh Crosstabulation
Count
Consider shopping at Amazon
Fresh
TotalNo Yes
Ease and comfort with mobile
technology
No 22 24 46
Yes 10 31 41
Total 32 55 87
Chi-Square Tests
Value df
Asymptotic
Significance (2-
sided)
Exact Sig. (2-
sided)
Exact Sig. (1-
sided)
Pearson Chi-Square 5.120a 1 .024
Continuity Correctionb 4.162 1 .041
Likelihood Ratio 5.218 1 .022
Fisher's Exact Test .028 .020
Linear-by-Linear Association 5.062 1 .024
N of Valid Cases 87
a. 0 cells (0.0%) have expected count less than 5. The minimum expected count is 15.08.
b. Computed only for a 2x2 table
Symmetric Measures
⊘ This is a preview!⊘
Do you want full access?
Subscribe today to unlock all pages.
Trusted by 1+ million students worldwide
Value
Approximate
Significance
Nominal by Nominal Phi .243 .024
Cramer's V .243 .024
N of Valid Cases 87
Case Study – 2
1.
Case Processing Summary
Studied an
entrepreneurship module
Cases
Valid Missing Total
N Percent N Percent N Percent
Total score for
entrepreneurship
intention
0 60 100.0% 0 0.0% 60 100.0%
1 74 100.0% 0 0.0% 74 100.0%
Descriptives
Studied an entrepreneurship module Statistic Std. Error
Total score for
entrepreneurship intention
0 Mean 20.92 .339
95% Confidence Interval for
Mean
Lower Bound 20.24
Upper Bound 21.59
5% Trimmed Mean 20.87
Median 21.00
Variance 6.891
Std. Deviation 2.625
Minimum 15
Maximum 28
Range 13
Interquartile Range 4
Skewness .146 .309
Kurtosis -.031 .608
1 Mean 22.23 .354
95% Confidence Interval for
Mean
Lower Bound 21.53
Upper Bound 22.93
5% Trimmed Mean 22.29
Paraphrase This Document
Need a fresh take? Get an instant paraphrase of this document with our AI Paraphraser
Median 22.00
Variance 9.248
Std. Deviation 3.041
Minimum 14
Maximum 28
Range 14
Interquartile Range 5
Skewness -.150 .279
Kurtosis -.179 .552
Tests of Normality
Studied an
entrepreneurship module
Kolmogorov-Smirnova Shapiro-Wilk
Statistic df Sig. Statistic df Sig.
Total score for
entrepreneurship
intention
0 .120 60 .032 .969 60 .135
1 .120 74 .011 .973 74 .110
a. Lilliefors Significance Correction
2.
ANOVA
Total score for entrepreneurship intention
Sum of Squares df Mean Square F Sig.
Between Groups 57.128 1 57.128 6.971 .009
Within Groups 1081.678 132 8.195
Total 1138.806 133
3.
ANOVA
Total score for entrepreneurship intention
Sum of Squares df Mean Square F Sig.
Between Groups 120.316 2 60.158 7.738 .001
Within Groups 1018.490 131 7.775
Total 1138.806 133

⊘ This is a preview!⊘
Do you want full access?
Subscribe today to unlock all pages.
Trusted by 1+ million students worldwide
1 out of 12
Related Documents


Your All-in-One AI-Powered Toolkit for Academic Success.
+13062052269
info@desklib.com
Available 24*7 on WhatsApp / Email
![[object Object]](/_next/static/media/star-bottom.7253800d.svg)
Unlock your academic potential
Copyright © 2020–2026 A2Z Services. All Rights Reserved. Developed and managed by ZUCOL.