Financial Analysis of SingTel: Performance and Decision Making Report
VerifiedAdded on 2023/04/22
|47
|10922
|275
Report
AI Summary
This report provides a comprehensive financial analysis of SingTel, a leading telecommunications group in Asia. It examines SingTel's financial performance through horizontal and vertical analysis, identifying key trends in profitability, including profit after tax, and revenue. The analysis includes a detailed evaluation of profitability ratios (net profit, return on assets and equity, operating ratio), dividend ratios (earnings per share, price/earnings ratio, dividend payout and yield), liquidity ratios (debt to equity, interest coverage, current, quick), and efficiency ratios (inventory, debtor's, and creditor's turnover, cash cycle). The report compares SingTel's performance with its competitor, Starhub, highlighting strategic partnerships and market positions. The report also analyzes economic conditions, share price movements, and non-financial ratio parameters, concluding with an assessment of SingTel's impact on its financial performance and brand reputation, and a review of its directors. The analysis provides insights into SingTel's financial health, strategic decisions, and market position within the telecommunications industry.
Running head: FINANCIAL DECISION MAKING OF SINGTEL
Financial Decision Making of SingTel
Name of the University:
Name of the Student:
Authors Note:
Financial Decision Making of SingTel
Name of the University:
Name of the Student:
Authors Note:
Paraphrase This Document
Need a fresh take? Get an instant paraphrase of this document with our AI Paraphraser
1FINANCIAL DECISION MAKING OF SINGTEL
Executive Summary
SingTel Group is positioned as the Asia’s leading communication group and is listed in
the Singapore Stock Exchange. The company offers a wide range of field, mobile, data, internet,
television along with the digital solutions. Moreover, the company also offers internet services
along with having operation and provision of telecommunication services and systems. It was
gathered that SingTel’s stock price is indicated to increase over years. Considering same,
SingTel must have the strategic vision to attain high market share and profit from introducing
and offering innovative telecom services to its consumers. Moreover, strategic financial goals of
the company must also focus on developing strategic partnerships with other telecommunication
companies in ensuring market expansion, business growth and increased profit margin. The
company must also invest in the digital business and services for attaining advantages of industry
changes and for leveraging on consumer knowledge as well as intelligent networks and to attain
high mobile data growth in all its business segments. SingTel can attain huge brand preference in
the telecom market through maintaining its commitment to consumers and making their lives
better with its services, technology and content along with offering experiences those are
effortless.
2FINANCIAL DECISION MAKING OF SINGTEL
Table of Contents
Section A.........................................................................................................................................3
Introduction of SingTel................................................................................................................3
Horizontal and Vertical Analysis.................................................................................................3
Profit Identification......................................................................................................................4
Analysis of Economic Condition.................................................................................................5
Profitability Ratio Analysis.........................................................................................................5
Dividend Ratio Analysis..............................................................................................................6
Liquidity Ratio Analysis..............................................................................................................7
Efficiency Ratio Analysis............................................................................................................8
Risk and Return Analysis............................................................................................................9
Share Price Analysis of SingTel................................................................................................10
Analysis of Non-financial Ratio Parameters.............................................................................11
Section B........................................................................................................................................13
Impact Analysis of SingTel’s Financial Performance...............................................................13
Critics on Impact on Brand and Reputation..............................................................................13
Directors and Non-Executive Directors of SingTel...................................................................13
Conclusion.................................................................................................................................14
References......................................................................................................................................16
⊘ This is a preview!⊘
Do you want full access?
Subscribe today to unlock all pages.
Trusted by 1+ million students worldwide
3FINANCIAL DECISION MAKING OF SINGTEL
Appendices......................................................................................................................................0
Section A
Introduction of SingTel
SingTel Group is positioned as the Asia’s leading communication group and is listed in
the Singapore Stock Exchange. The company offers a wide range of field, mobile, data, internet,
television along with the digital solutions. Moreover, the company also offers internet services
along with having operation and provision of telecommunication services and systems.
Headquartered in Singapore, SingTel has more than 140 years of operating experience and also
have a subsidiary in Australia that is an integrated telecommunications. SingTel is one of the
renowned listed Singapore companies and listed in the Singapore Exchange through market
capitalization (Singtel.com 2019). The group has a vast network of offices all over the Asia
Pacific, Europe and USA. The yearly turnover of the company in the year 2018 $ 17,532 is
observed in comparison to year 2017 that was $ 16,711. The number of employees recorded for
the company in the year 2017 was recorded to be 25,000. The objective of the report is to
analyze the performance of SingTel in comparison to its competitors within the
telecommunication industry so that suitable recommendations can be provided to the
organization in maintaining its sustainable financial performance and bad reputation.
Horizontal and Vertical Analysis
From conducting horizontal analysis it is signified that there has been positive changes in
the amounts of profit after tax the in the year 2018 in comparison to previous year by 41.75%.
On the other hand, profit for the year of Starhub has decreased in the year 2018 in comparison to
Paraphrase This Document
Need a fresh take? Get an instant paraphrase of this document with our AI Paraphraser
4FINANCIAL DECISION MAKING OF SINGTEL
previous four years by 26.65% (Ir.starhub.com 2019). In addition, the net assets of SingTel have
increased in the year 2018 by 5.10% in comparison to Starhub, where it is observed that the total
assets of the company have decreased in 2018 in comparison to previous four years by 0.02%.
SingTel has attained competitive position in the telecom industry with high market shares
through launching innovative offerings that has drastically increased its profit after tax over
years where Starhub is dealing with fierce competition in delivering consumer values with low
subscription fees that is affecting its profit position (Baños-Caballero, García-Teruel and
Martínez-Solano 2014).
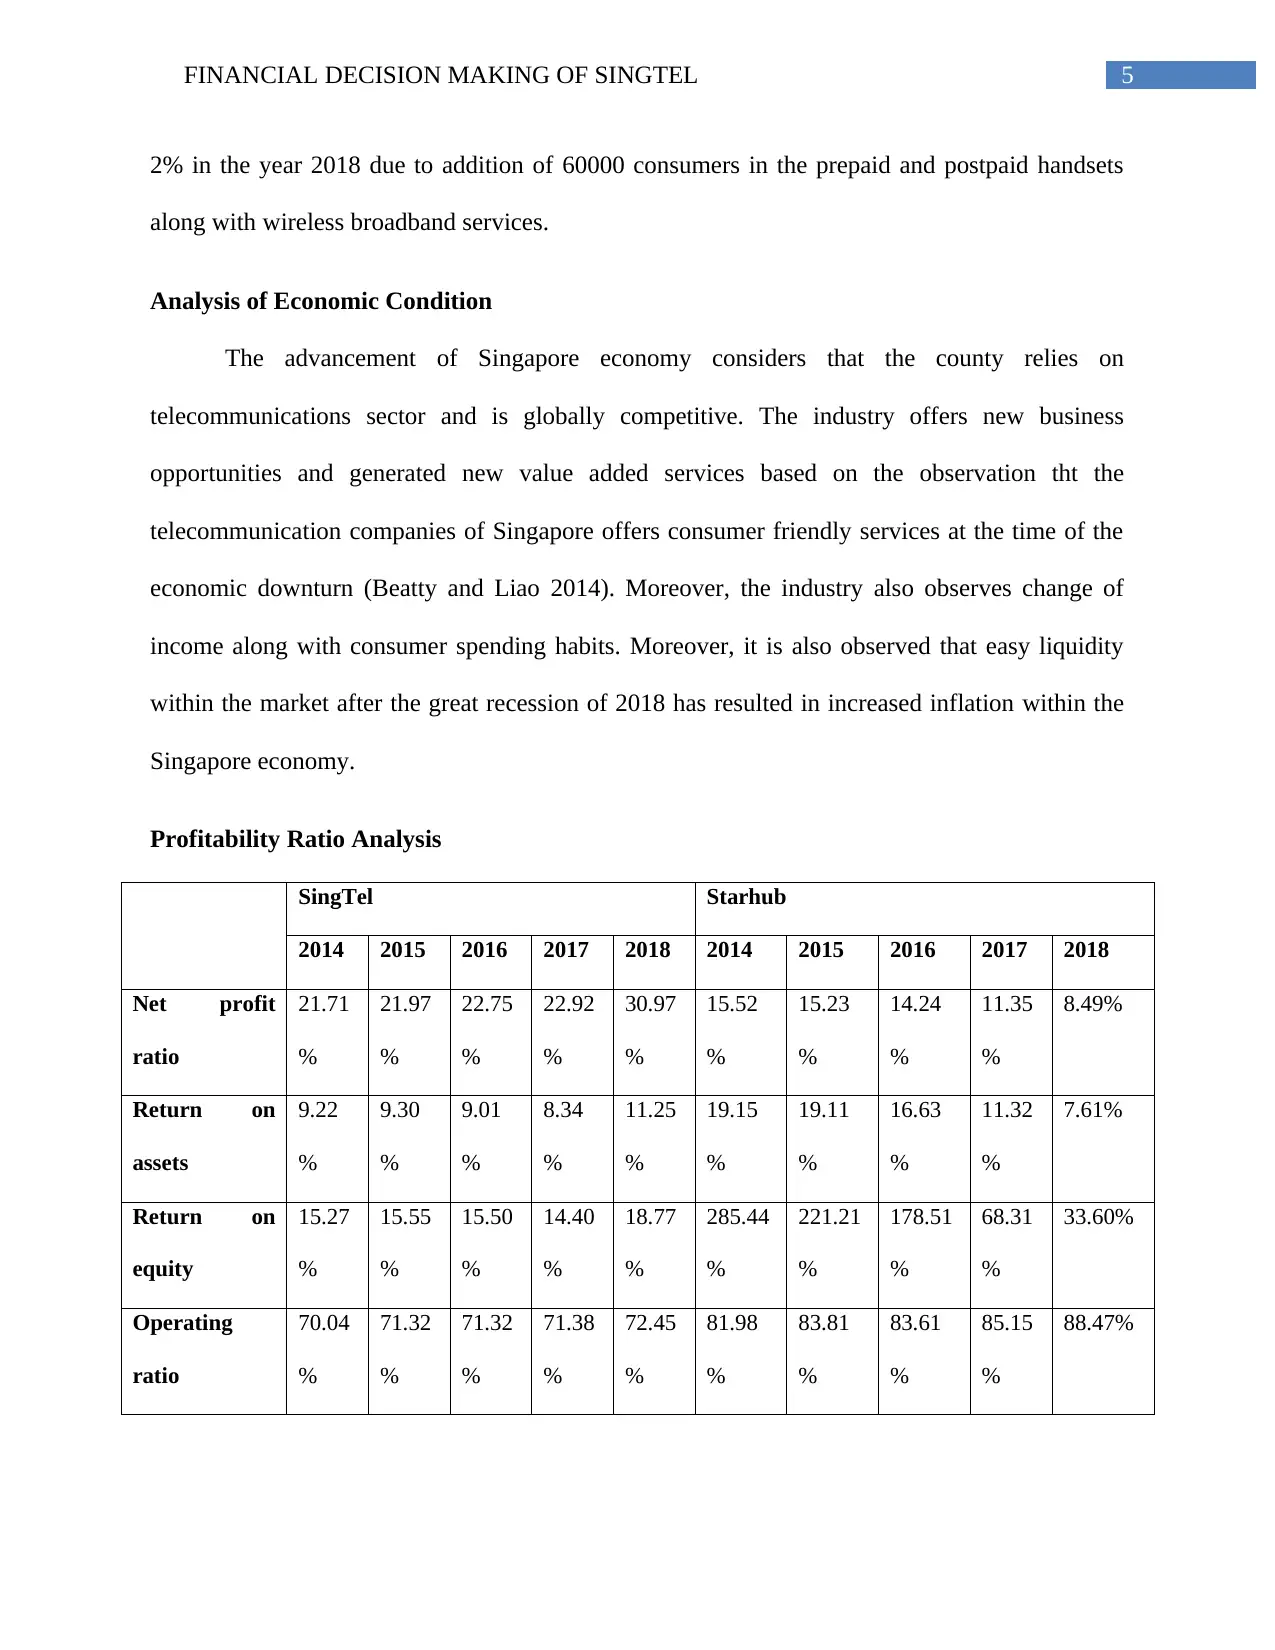
From carrying out vertical analysis it is gathered that the profit after tax of SingTel has
increased in 2018 in comparison to past four years by 30.97%, whereas, profit for the year for
Starhub has observed a nominal increase in profit for the year by 8.49%. Moreover, total assets
of SingTel and Starhub observed increase in 2018 by 100% in contrast to past four years.
Strategic partnership with Airtel has resulted in increasing share market position of SingTel
along with making positive contributions to its profitability position. On the other hand, Starhub
is developing its competitive advantages in improving consumer care and simplifying offerings
for increasing its profitable position (Barth 2015).
Profit Identification
SingTel has observed considerable improvement in its profitable business position in the
telecom industry through attaining revenue increase of 5% as strong consumer growth along with
its higher equipment sales. Such improving position of the company’s profits over the years from
2017 to 2018 has been identified as its EBITDA increased by 3% that has been strong by 7%
excluding the NBN migration revenues. The mobile service profit of SingTel has increased by
previous four years by 26.65% (Ir.starhub.com 2019). In addition, the net assets of SingTel have
increased in the year 2018 by 5.10% in comparison to Starhub, where it is observed that the total
assets of the company have decreased in 2018 in comparison to previous four years by 0.02%.
SingTel has attained competitive position in the telecom industry with high market shares
through launching innovative offerings that has drastically increased its profit after tax over
years where Starhub is dealing with fierce competition in delivering consumer values with low
subscription fees that is affecting its profit position (Baños-Caballero, García-Teruel and
Martínez-Solano 2014).
From carrying out vertical analysis it is gathered that the profit after tax of SingTel has
increased in 2018 in comparison to past four years by 30.97%, whereas, profit for the year for
Starhub has observed a nominal increase in profit for the year by 8.49%. Moreover, total assets
of SingTel and Starhub observed increase in 2018 by 100% in contrast to past four years.
Strategic partnership with Airtel has resulted in increasing share market position of SingTel
along with making positive contributions to its profitability position. On the other hand, Starhub
is developing its competitive advantages in improving consumer care and simplifying offerings
for increasing its profitable position (Barth 2015).
Profit Identification
SingTel has observed considerable improvement in its profitable business position in the
telecom industry through attaining revenue increase of 5% as strong consumer growth along with
its higher equipment sales. Such improving position of the company’s profits over the years from
2017 to 2018 has been identified as its EBITDA increased by 3% that has been strong by 7%
excluding the NBN migration revenues. The mobile service profit of SingTel has increased by
5FINANCIAL DECISION MAKING OF SINGTEL
2% in the year 2018 due to addition of 60000 consumers in the prepaid and postpaid handsets
along with wireless broadband services.
Analysis of Economic Condition
The advancement of Singapore economy considers that the county relies on
telecommunications sector and is globally competitive. The industry offers new business
opportunities and generated new value added services based on the observation tht the
telecommunication companies of Singapore offers consumer friendly services at the time of the
economic downturn (Beatty and Liao 2014). Moreover, the industry also observes change of
income along with consumer spending habits. Moreover, it is also observed that easy liquidity
within the market after the great recession of 2018 has resulted in increased inflation within the
Singapore economy.
Profitability Ratio Analysis
SingTel Starhub
2014 2015 2016 2017 2018 2014 2015 2016 2017 2018
Net profit
ratio
21.71
%
21.97
%
22.75
%
22.92
%
30.97
%
15.52
%
15.23
%
14.24
%
11.35
%
8.49%
Return on
assets
9.22
%
9.30
%
9.01
%
8.34
%
11.25
%
19.15
%
19.11
%
16.63
%
11.32
%
7.61%
Return on
equity
15.27
%
15.55
%
15.50
%
14.40
%
18.77
%
285.44
%
221.21
%
178.51
%
68.31
%
33.60%
Operating
ratio
70.04
%
71.32
%
71.32
%
71.38
%
72.45
%
81.98
%
83.81
%
83.61
%
85.15
%
88.47%
⊘ This is a preview!⊘
Do you want full access?
Subscribe today to unlock all pages.
Trusted by 1+ million students worldwide
6FINANCIAL DECISION MAKING OF SINGTEL
The net profit ratio of SingTel is observed to indicate an increasing trend over the years
from 2014 to 2018 in comparison to its competitor Starhub that is indicating a decreasing trend
in its ratio over the five years. This signifies that SingTel is attaining high market share and
profit from introducing and offering innovative telecom services to its consumers, where Starhub
is lacking to maintain its competitive edge and is struggling to modify its consumer care and
product simplification process (Bekaert and Hodrick 2017). The return on assets of SingTel is
observed to indicate an increasing trend over the years from 2014 to 2018 in comparison to its
competitor Starhub that is indicating a decreasing trend in its ratio over the five years. This
signifies that SingTel is able to convert or sell its existing assets to earn revenue that is not
evident in case of Starhub. The return on equity of SingTel is observed to indicate an increasing
trend over the years from 2014 to 2018 in comparison to its competitor Starhub that is indicating
a decreasing trend in its ratio over the five years. This indicates that SingTel is generating
increased profits from its shareholders investments within the organization in comparison to
Starhub (Finkler, Smith and Calabrese 2018). The operating ratio of SingTel and Starhub
signifies an increasing trend over the years from 2014 to 2018. This indicates that both the
companies are able to control their operating expenses in ensuring high net sales (Callen 2015).
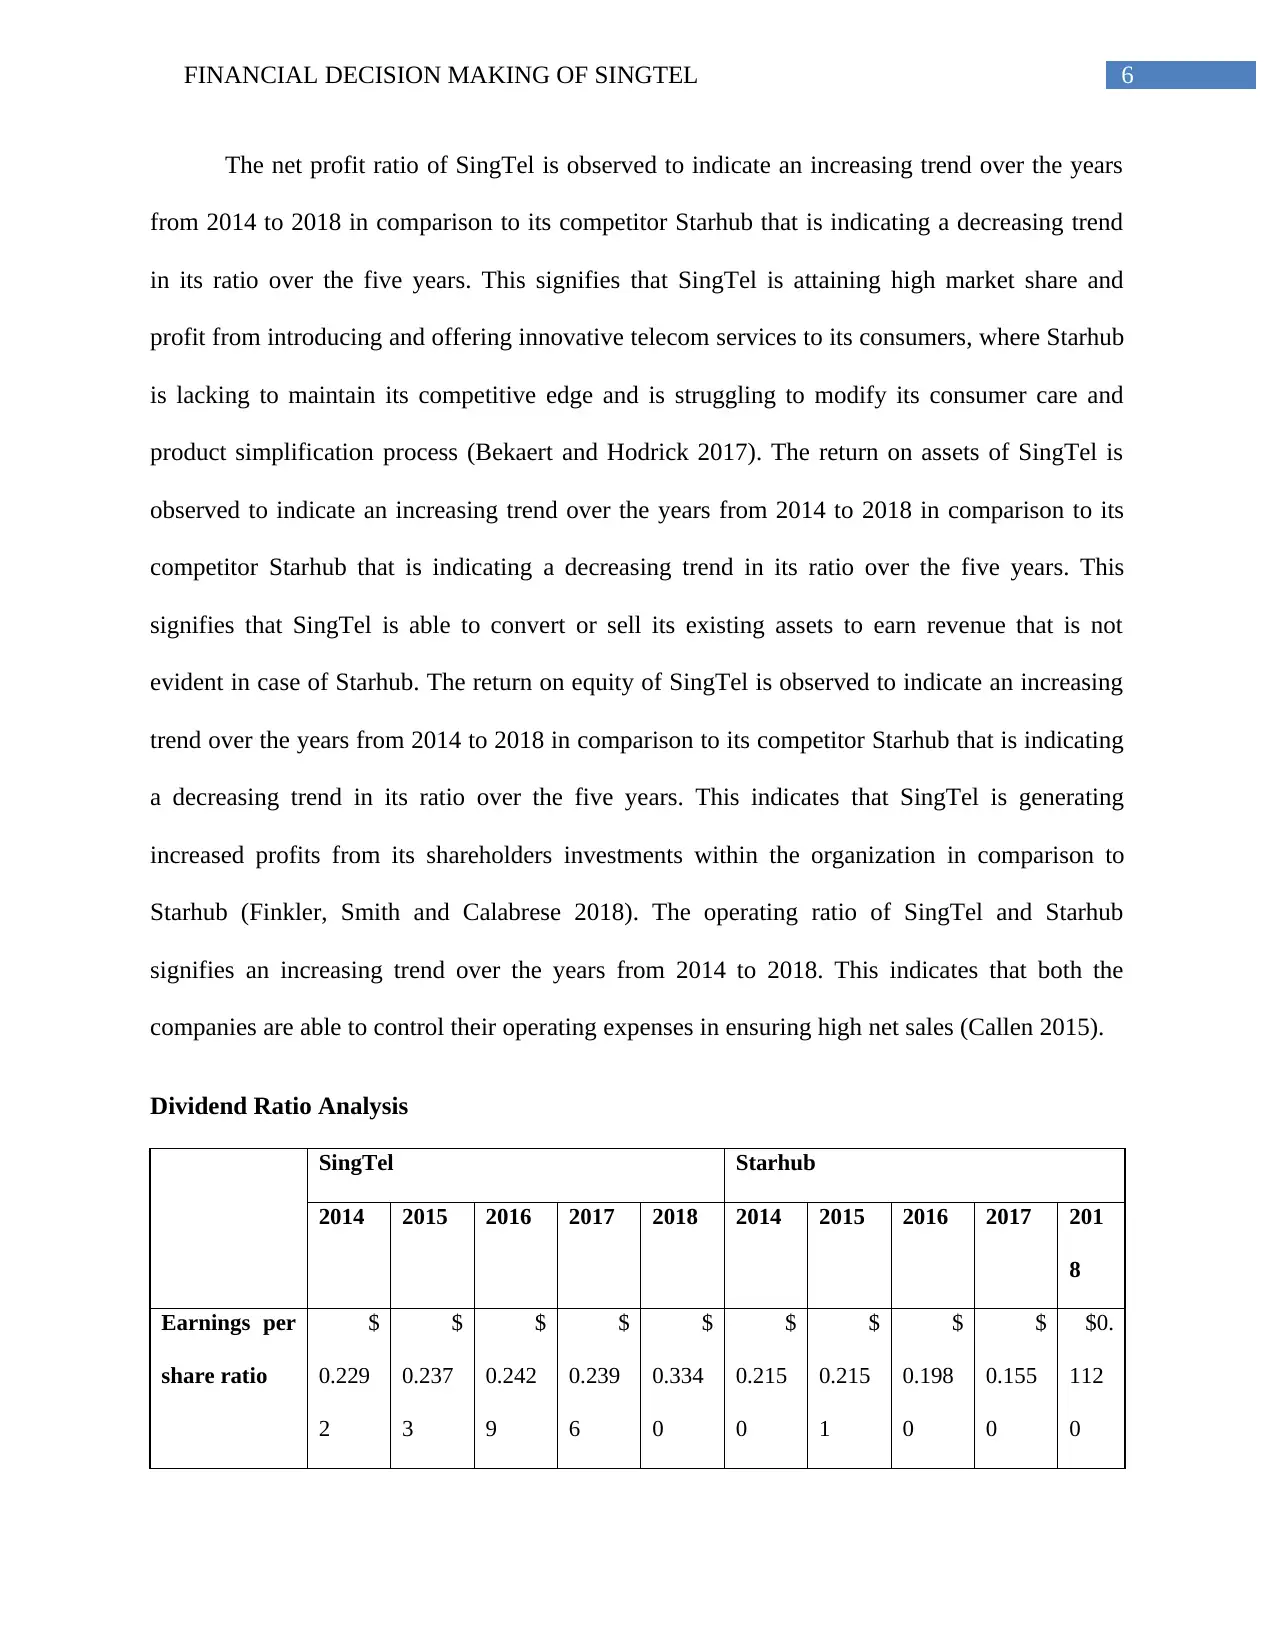
Dividend Ratio Analysis
SingTel Starhub
2014 2015 2016 2017 2018 2014 2015 2016 2017 201
8
Earnings per
share ratio
$
0.229
2
$
0.237
3
$
0.242
9
$
0.239
6
$
0.334
0
$
0.215
0
$
0.215
1
$
0.198
0
$
0.155
0
$0.
112
0
The net profit ratio of SingTel is observed to indicate an increasing trend over the years
from 2014 to 2018 in comparison to its competitor Starhub that is indicating a decreasing trend
in its ratio over the five years. This signifies that SingTel is attaining high market share and
profit from introducing and offering innovative telecom services to its consumers, where Starhub
is lacking to maintain its competitive edge and is struggling to modify its consumer care and
product simplification process (Bekaert and Hodrick 2017). The return on assets of SingTel is
observed to indicate an increasing trend over the years from 2014 to 2018 in comparison to its
competitor Starhub that is indicating a decreasing trend in its ratio over the five years. This
signifies that SingTel is able to convert or sell its existing assets to earn revenue that is not
evident in case of Starhub. The return on equity of SingTel is observed to indicate an increasing
trend over the years from 2014 to 2018 in comparison to its competitor Starhub that is indicating
a decreasing trend in its ratio over the five years. This indicates that SingTel is generating
increased profits from its shareholders investments within the organization in comparison to
Starhub (Finkler, Smith and Calabrese 2018). The operating ratio of SingTel and Starhub
signifies an increasing trend over the years from 2014 to 2018. This indicates that both the
companies are able to control their operating expenses in ensuring high net sales (Callen 2015).
Dividend Ratio Analysis
SingTel Starhub
2014 2015 2016 2017 2018 2014 2015 2016 2017 201
8
Earnings per
share ratio
$
0.229
2
$
0.237
3
$
0.242
9
$
0.239
6
$
0.334
0
$
0.215
0
$
0.215
1
$
0.198
0
$
0.155
0
$0.
112
0
Paraphrase This Document
Need a fresh take? Get an instant paraphrase of this document with our AI Paraphraser
7FINANCIAL DECISION MAKING OF SINGTEL
Price/
earnings
ratio
1.70 1.55 1.50 1.49 0.88 1.95 1.72 1.42 1.87 1.61
Dividend
payout ratio
73.30
%
73.75
%
72.04
%
73.04
%
52.39
%
93.01
%
23.25
%
25.25
%
32.25
%
35.7
1%
Dividend
yield ratio
43.08
%
47.55
%
47.95
%
49.02
%
59.73
%
47.62
%
13.51
%
17.79
%
17.24
%
22.2
2%
The earnings per share of SingTel is observed to indicate an increasing trend over the
years from 2014 to 2018 in comparison to its competitor Starhub that is indicating a decreasing
trend in its ratio over the five years. This indicates SingTel is able to attain high net income from
each share of its common stock that is not evident in case of Starhub (Hoyle, Schaefer and
Doupnik 2015). The price earnings ratio of SingTel is observed to indicate an increasing trend
over the years from 2014 to 2018 in comparison to its competitor Starhub that is indicating a
decreasing trend in its ratio over the five years. This signifies SingTel’s positive future
performance where investors are willing to pay more for its share, which is not observed in case
of Starhub (Gupta 2016). The dividend payout ratio of Starhub is observed to indicate an
increasing trend over the years from 2014 to 2018 in comparison to SingTel that is indicating a
decreasing ratio in the year 2018. The dividend yield ratio of SingTel is observed to indicate an
increasing trend over the years from 2014 to 2018 in comparison to its competitor Starhub that is
indicating a decreasing trend till 2017 and has increased in 2018.
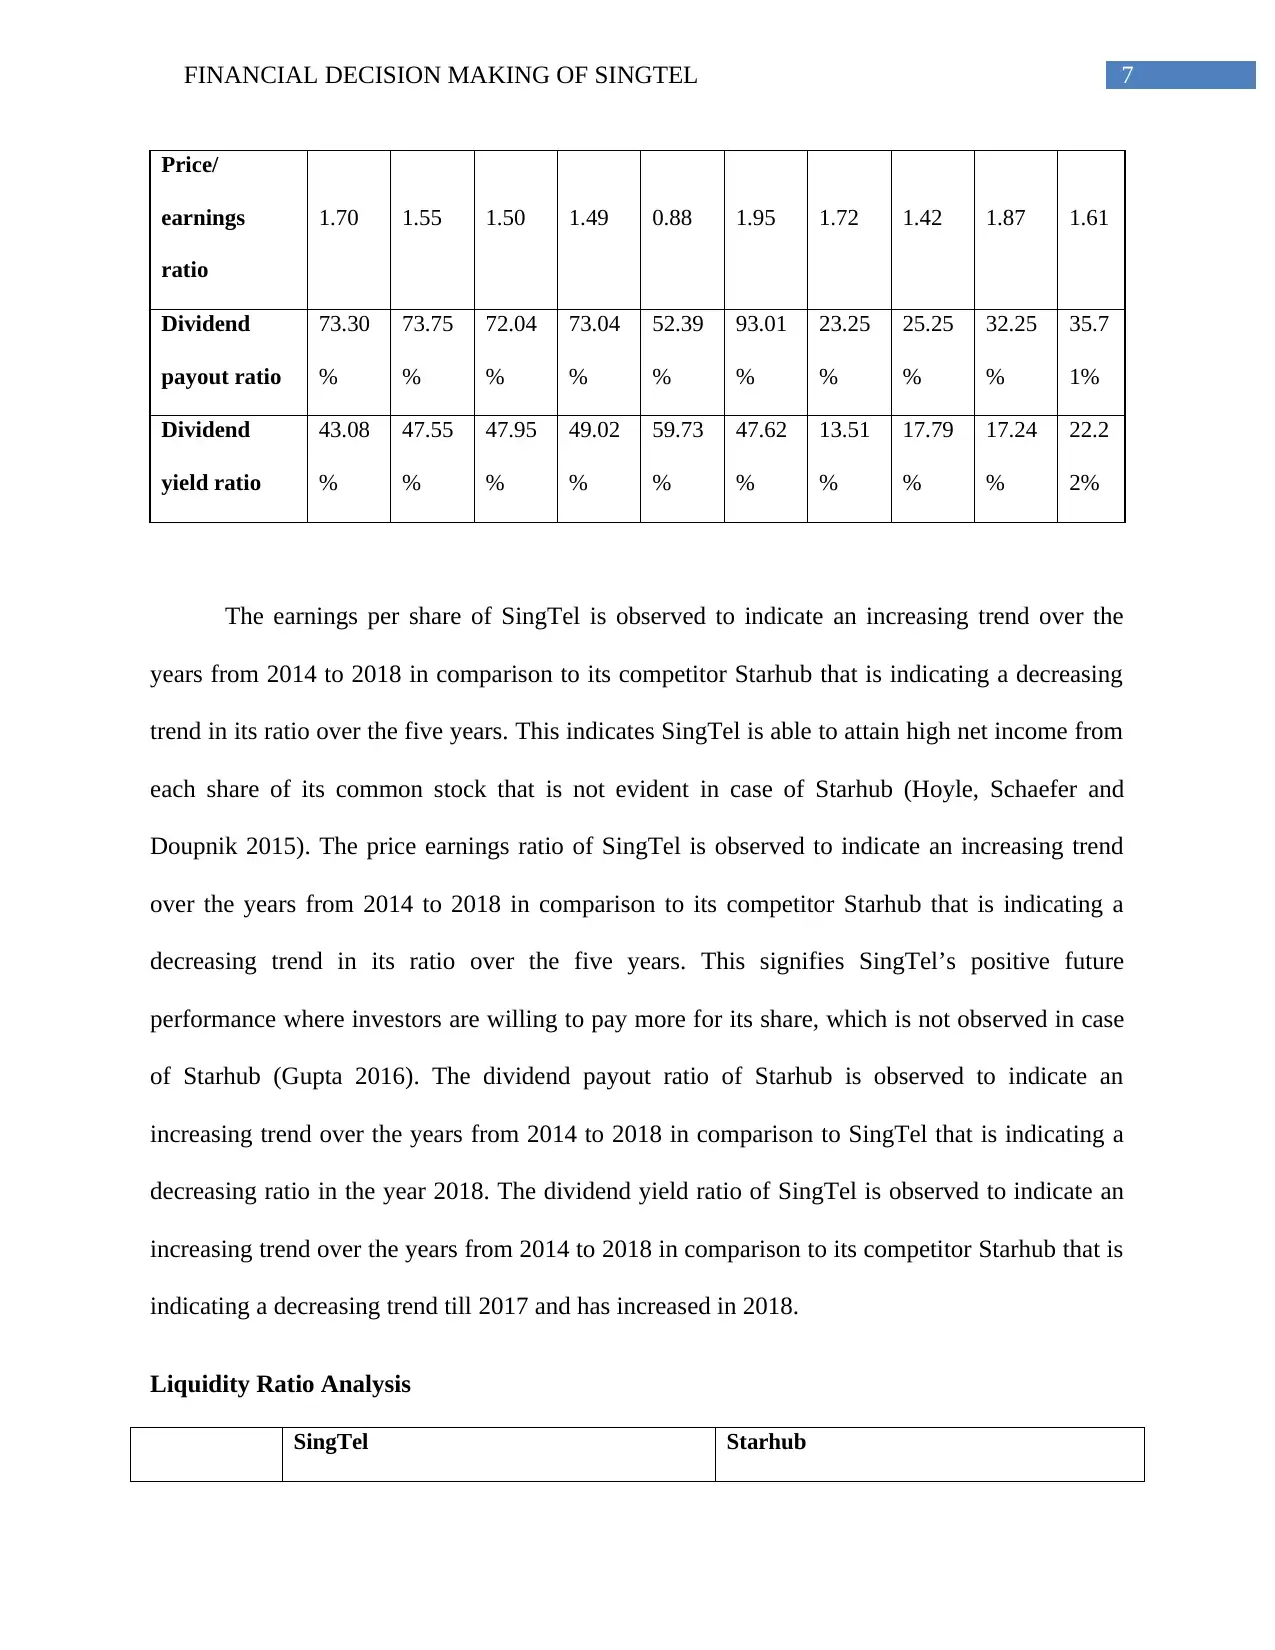
Liquidity Ratio Analysis
SingTel Starhub
Price/
earnings
ratio
1.70 1.55 1.50 1.49 0.88 1.95 1.72 1.42 1.87 1.61
Dividend
payout ratio
73.30
%
73.75
%
72.04
%
73.04
%
52.39
%
93.01
%
23.25
%
25.25
%
32.25
%
35.7
1%
Dividend
yield ratio
43.08
%
47.55
%
47.95
%
49.02
%
59.73
%
47.62
%
13.51
%
17.79
%
17.24
%
22.2
2%
The earnings per share of SingTel is observed to indicate an increasing trend over the
years from 2014 to 2018 in comparison to its competitor Starhub that is indicating a decreasing
trend in its ratio over the five years. This indicates SingTel is able to attain high net income from
each share of its common stock that is not evident in case of Starhub (Hoyle, Schaefer and
Doupnik 2015). The price earnings ratio of SingTel is observed to indicate an increasing trend
over the years from 2014 to 2018 in comparison to its competitor Starhub that is indicating a
decreasing trend in its ratio over the five years. This signifies SingTel’s positive future
performance where investors are willing to pay more for its share, which is not observed in case
of Starhub (Gupta 2016). The dividend payout ratio of Starhub is observed to indicate an
increasing trend over the years from 2014 to 2018 in comparison to SingTel that is indicating a
decreasing ratio in the year 2018. The dividend yield ratio of SingTel is observed to indicate an
increasing trend over the years from 2014 to 2018 in comparison to its competitor Starhub that is
indicating a decreasing trend till 2017 and has increased in 2018.
Liquidity Ratio Analysis
SingTel Starhub
8FINANCIAL DECISION MAKING OF SINGTEL
2014 2015 2016 2017 2018 2014 2015 2016 2017 2018
Debt to
equity ratio 0.65 0.70 0.74 0.71 0.63 12.34 9.18 10.27 3.35
3.
48
Interest
coverage
ratio
14.81 15.13 13.48 12.76 16.60 21.09 24.79 16.23 12.12
9.
06
Current
ratio 0.80 0.83 0.79 0.64 0.72 0.56 0.59 0.87 1.02
1.
07
Quick ratio
0.77 0.78 0.74 0.63 0.72 0.53 0.53 0.81 0.95
0.
98
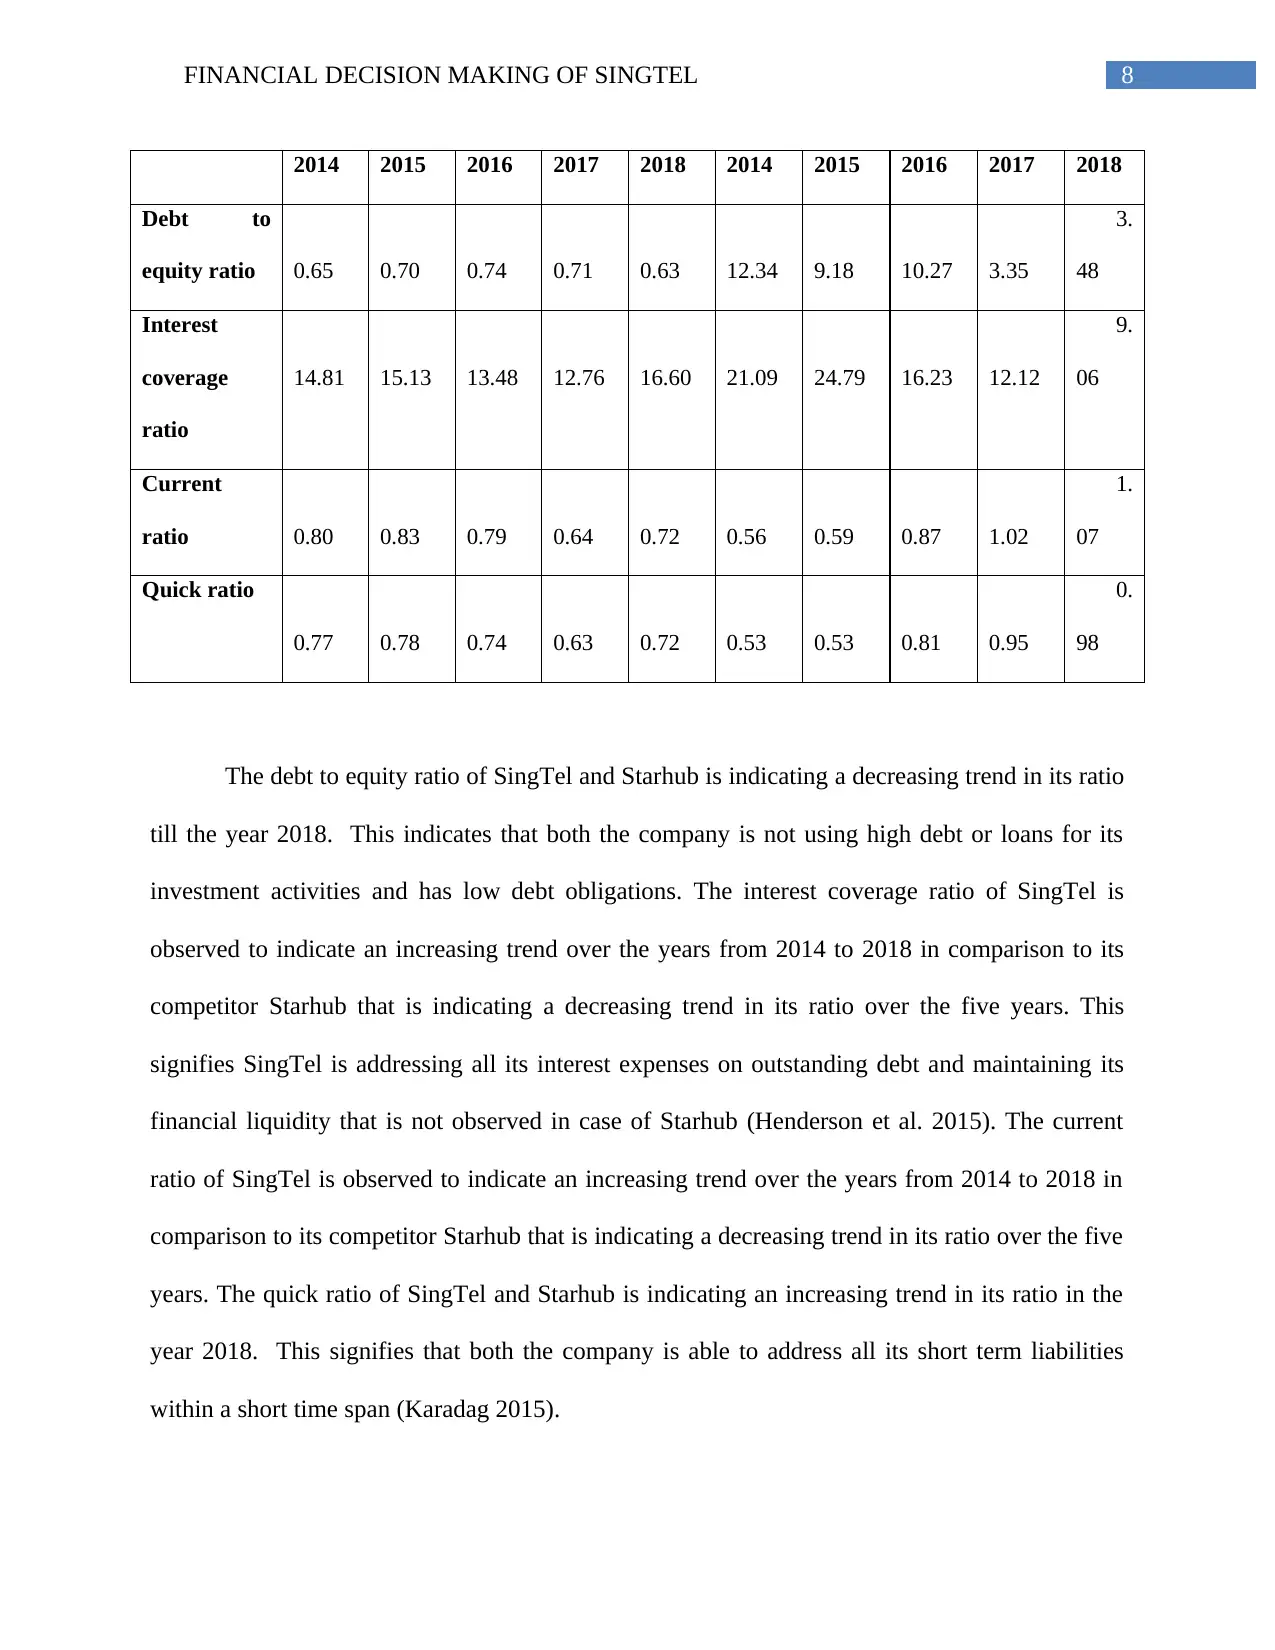
The debt to equity ratio of SingTel and Starhub is indicating a decreasing trend in its ratio
till the year 2018. This indicates that both the company is not using high debt or loans for its
investment activities and has low debt obligations. The interest coverage ratio of SingTel is
observed to indicate an increasing trend over the years from 2014 to 2018 in comparison to its
competitor Starhub that is indicating a decreasing trend in its ratio over the five years. This
signifies SingTel is addressing all its interest expenses on outstanding debt and maintaining its
financial liquidity that is not observed in case of Starhub (Henderson et al. 2015). The current
ratio of SingTel is observed to indicate an increasing trend over the years from 2014 to 2018 in
comparison to its competitor Starhub that is indicating a decreasing trend in its ratio over the five
years. The quick ratio of SingTel and Starhub is indicating an increasing trend in its ratio in the
year 2018. This signifies that both the company is able to address all its short term liabilities
within a short time span (Karadag 2015).
2014 2015 2016 2017 2018 2014 2015 2016 2017 2018
Debt to
equity ratio 0.65 0.70 0.74 0.71 0.63 12.34 9.18 10.27 3.35
3.
48
Interest
coverage
ratio
14.81 15.13 13.48 12.76 16.60 21.09 24.79 16.23 12.12
9.
06
Current
ratio 0.80 0.83 0.79 0.64 0.72 0.56 0.59 0.87 1.02
1.
07
Quick ratio
0.77 0.78 0.74 0.63 0.72 0.53 0.53 0.81 0.95
0.
98
The debt to equity ratio of SingTel and Starhub is indicating a decreasing trend in its ratio
till the year 2018. This indicates that both the company is not using high debt or loans for its
investment activities and has low debt obligations. The interest coverage ratio of SingTel is
observed to indicate an increasing trend over the years from 2014 to 2018 in comparison to its
competitor Starhub that is indicating a decreasing trend in its ratio over the five years. This
signifies SingTel is addressing all its interest expenses on outstanding debt and maintaining its
financial liquidity that is not observed in case of Starhub (Henderson et al. 2015). The current
ratio of SingTel is observed to indicate an increasing trend over the years from 2014 to 2018 in
comparison to its competitor Starhub that is indicating a decreasing trend in its ratio over the five
years. The quick ratio of SingTel and Starhub is indicating an increasing trend in its ratio in the
year 2018. This signifies that both the company is able to address all its short term liabilities
within a short time span (Karadag 2015).
⊘ This is a preview!⊘
Do you want full access?
Subscribe today to unlock all pages.
Trusted by 1+ million students worldwide
9FINANCIAL DECISION MAKING OF SINGTEL
Efficiency Ratio Analysis
SingTel Starhub
2014 2015 2016 2017 2018 2014 2015 2016 2017 2018
Inventory
turnover (in
days)
4.15 4.87 6.56 4.66 1.36 6.54 7.22 7.91 9.20
11.
37
Debtor's
turnover (in
days)
78.38 78.85 88.79
1
01.46
1
03.68 24.30 23.52 24.79 18.48
11.
37
Creditor's
turnover (in
days)
86.85 87.47 97.40
1
03.93
1
05.72
1
18.46
1
10.73
1
06.24
1
00.91
92.
68
Cash cycle (in
days) (4.32) (3.76) (2.06) 2.20 (0.69)
(
87.61)
(
79.99)
(
73.54)
(
73.23)
(69.
95)
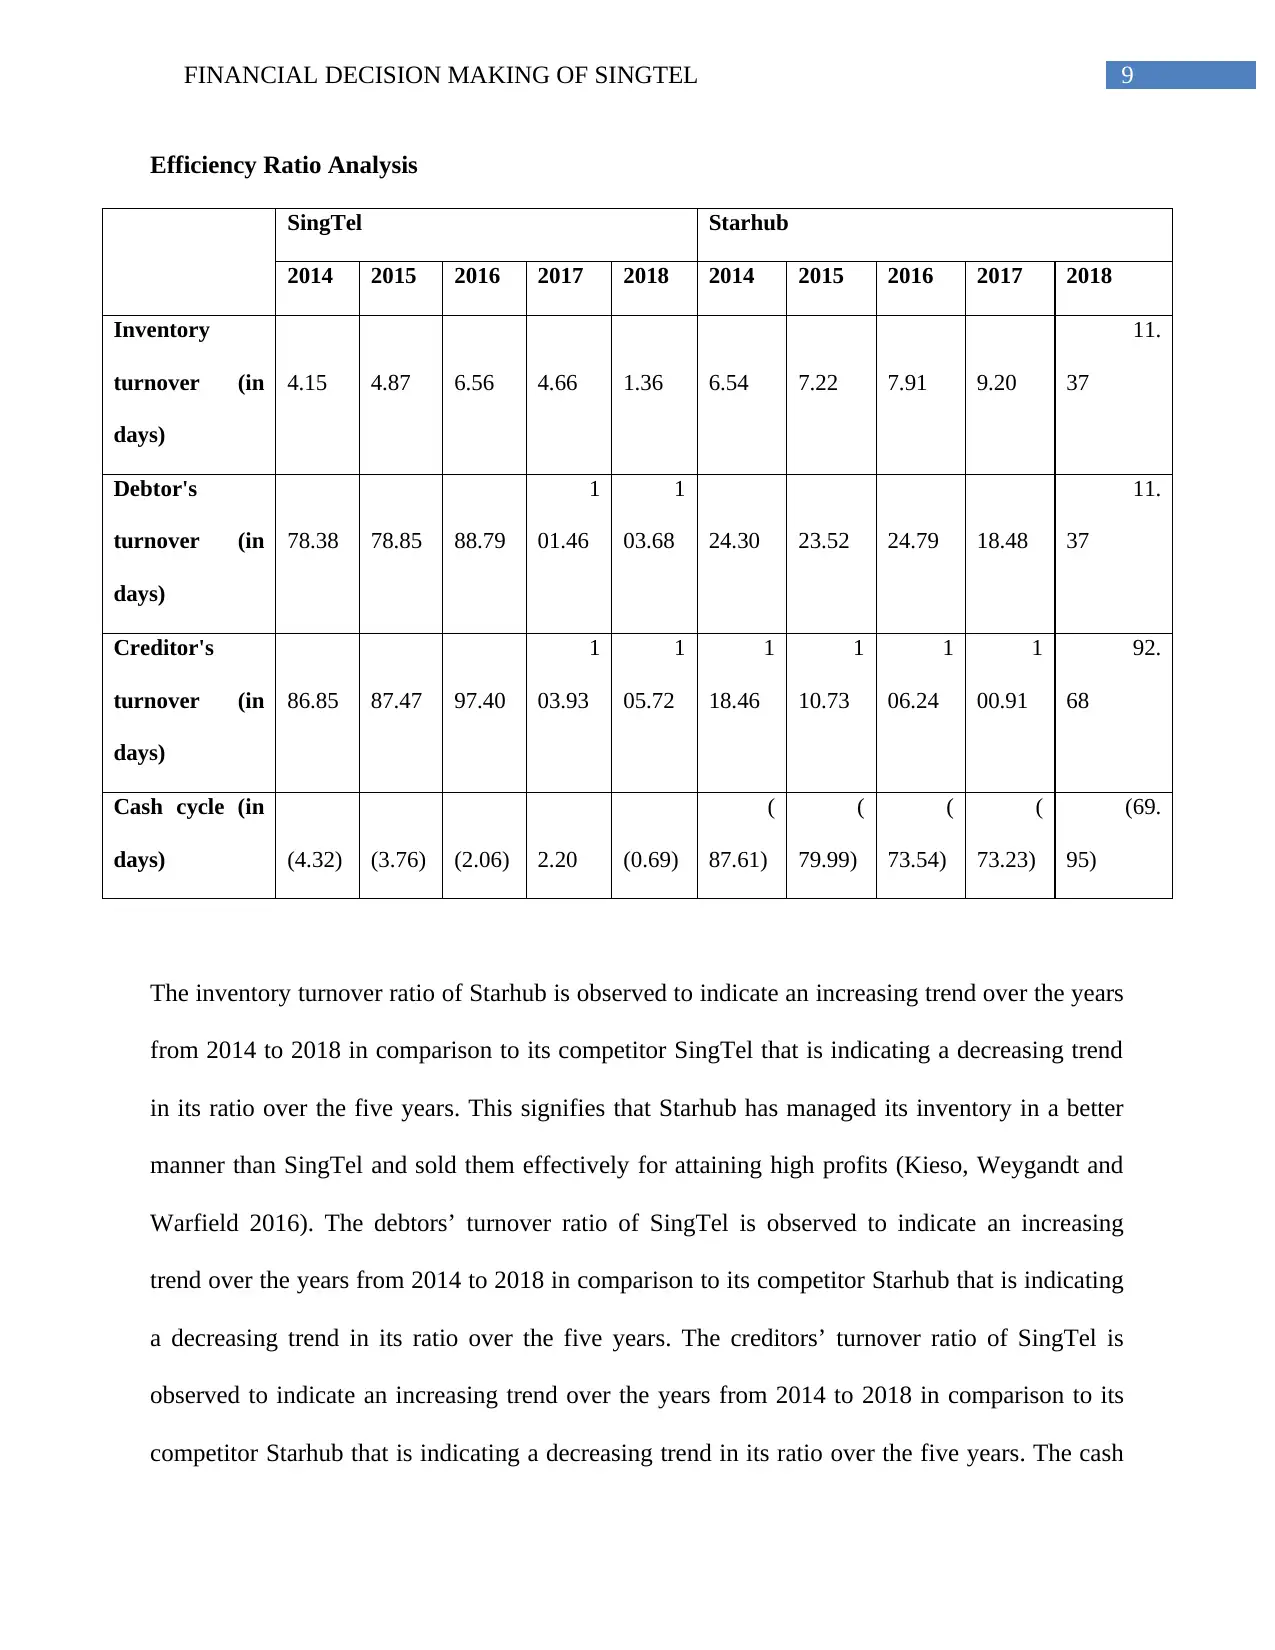
The inventory turnover ratio of Starhub is observed to indicate an increasing trend over the years
from 2014 to 2018 in comparison to its competitor SingTel that is indicating a decreasing trend
in its ratio over the five years. This signifies that Starhub has managed its inventory in a better
manner than SingTel and sold them effectively for attaining high profits (Kieso, Weygandt and
Warfield 2016). The debtors’ turnover ratio of SingTel is observed to indicate an increasing
trend over the years from 2014 to 2018 in comparison to its competitor Starhub that is indicating
a decreasing trend in its ratio over the five years. The creditors’ turnover ratio of SingTel is
observed to indicate an increasing trend over the years from 2014 to 2018 in comparison to its
competitor Starhub that is indicating a decreasing trend in its ratio over the five years. The cash
Efficiency Ratio Analysis
SingTel Starhub
2014 2015 2016 2017 2018 2014 2015 2016 2017 2018
Inventory
turnover (in
days)
4.15 4.87 6.56 4.66 1.36 6.54 7.22 7.91 9.20
11.
37
Debtor's
turnover (in
days)
78.38 78.85 88.79
1
01.46
1
03.68 24.30 23.52 24.79 18.48
11.
37
Creditor's
turnover (in
days)
86.85 87.47 97.40
1
03.93
1
05.72
1
18.46
1
10.73
1
06.24
1
00.91
92.
68
Cash cycle (in
days) (4.32) (3.76) (2.06) 2.20 (0.69)
(
87.61)
(
79.99)
(
73.54)
(
73.23)
(69.
95)
The inventory turnover ratio of Starhub is observed to indicate an increasing trend over the years
from 2014 to 2018 in comparison to its competitor SingTel that is indicating a decreasing trend
in its ratio over the five years. This signifies that Starhub has managed its inventory in a better
manner than SingTel and sold them effectively for attaining high profits (Kieso, Weygandt and
Warfield 2016). The debtors’ turnover ratio of SingTel is observed to indicate an increasing
trend over the years from 2014 to 2018 in comparison to its competitor Starhub that is indicating
a decreasing trend in its ratio over the five years. The creditors’ turnover ratio of SingTel is
observed to indicate an increasing trend over the years from 2014 to 2018 in comparison to its
competitor Starhub that is indicating a decreasing trend in its ratio over the five years. The cash
Paraphrase This Document
Need a fresh take? Get an instant paraphrase of this document with our AI Paraphraser
10FINANCIAL DECISION MAKING OF SINGTEL
cycle of SingTel is observed to indicate a decreasing trend over the years from 2014 to 2018 in
comparison to its competitor Starhub that is indicating a decreasing trend in its ratio over the five
years. This indicates SingTel is less amount of time in selling its resources to attain cash or
revenues, whereas, Starhub is struggling to ensure the same.
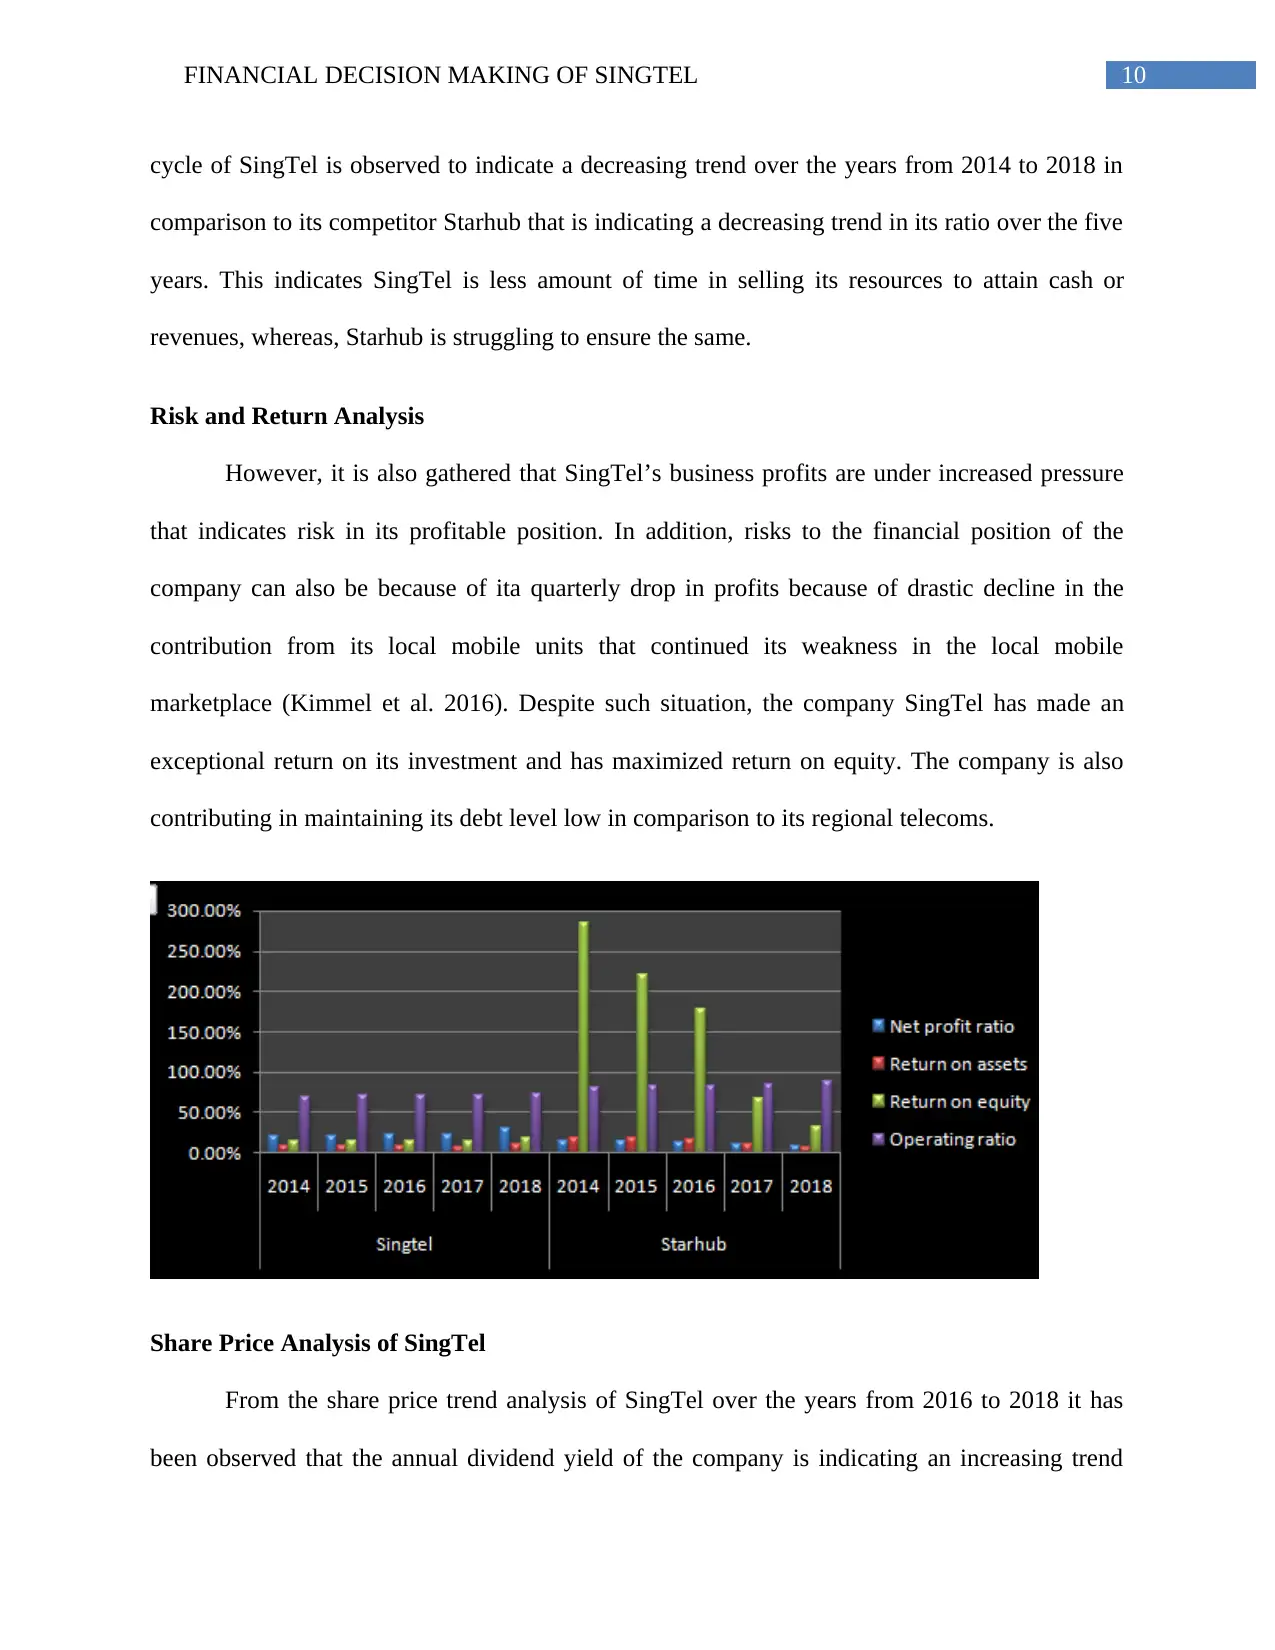
Risk and Return Analysis
However, it is also gathered that SingTel’s business profits are under increased pressure
that indicates risk in its profitable position. In addition, risks to the financial position of the
company can also be because of ita quarterly drop in profits because of drastic decline in the
contribution from its local mobile units that continued its weakness in the local mobile
marketplace (Kimmel et al. 2016). Despite such situation, the company SingTel has made an
exceptional return on its investment and has maximized return on equity. The company is also
contributing in maintaining its debt level low in comparison to its regional telecoms.
Share Price Analysis of SingTel
From the share price trend analysis of SingTel over the years from 2016 to 2018 it has
been observed that the annual dividend yield of the company is indicating an increasing trend
cycle of SingTel is observed to indicate a decreasing trend over the years from 2014 to 2018 in
comparison to its competitor Starhub that is indicating a decreasing trend in its ratio over the five
years. This indicates SingTel is less amount of time in selling its resources to attain cash or
revenues, whereas, Starhub is struggling to ensure the same.
Risk and Return Analysis
However, it is also gathered that SingTel’s business profits are under increased pressure
that indicates risk in its profitable position. In addition, risks to the financial position of the
company can also be because of ita quarterly drop in profits because of drastic decline in the
contribution from its local mobile units that continued its weakness in the local mobile
marketplace (Kimmel et al. 2016). Despite such situation, the company SingTel has made an
exceptional return on its investment and has maximized return on equity. The company is also
contributing in maintaining its debt level low in comparison to its regional telecoms.
Share Price Analysis of SingTel
From the share price trend analysis of SingTel over the years from 2016 to 2018 it has
been observed that the annual dividend yield of the company is indicating an increasing trend
11FINANCIAL DECISION MAKING OF SINGTEL
that is around 5.8%. However, a high dividend yield might not be a good indication as it can also
be because of an increase sell-off and increasing share prices (Nobes 2014). The share prices of
the compny are observed to be outranking as based on its portfolio-weight. Additionally Phillip
SING Income ETF that focuses on 30 high quality income stocks has SingTel as it largest
portfolio holdings of 10.2%. The stock price graph of SingTel indicated in the figure below
indicates a strong chart due to a high level time frame. Such timeframe was considered to be
suitable for the long term investors as it excludes the entire short term volatility as well as noise
signal. After dealing with two years decline in earnings, SingTel’s stock price is indicated to
increase that has resulted in a DPS of 17.5 cents (5.7%) yield. With regard to valuation, SingTel
is trading at 32% holding company discount that indicates high financial performance of the
company.
⊘ This is a preview!⊘
Do you want full access?
Subscribe today to unlock all pages.
Trusted by 1+ million students worldwide
1 out of 47
Related Documents


Your All-in-One AI-Powered Toolkit for Academic Success.
+13062052269
info@desklib.com
Available 24*7 on WhatsApp / Email
![[object Object]](/_next/static/media/star-bottom.7253800d.svg)
Unlock your academic potential
Copyright © 2020–2026 A2Z Services. All Rights Reserved. Developed and managed by ZUCOL.