SIT718 - Data Analysis: Aggregation Functions and R Programming

Verified

Added on  2023/01/23

|5
|647
|58
Homework Assignment
AI Summary
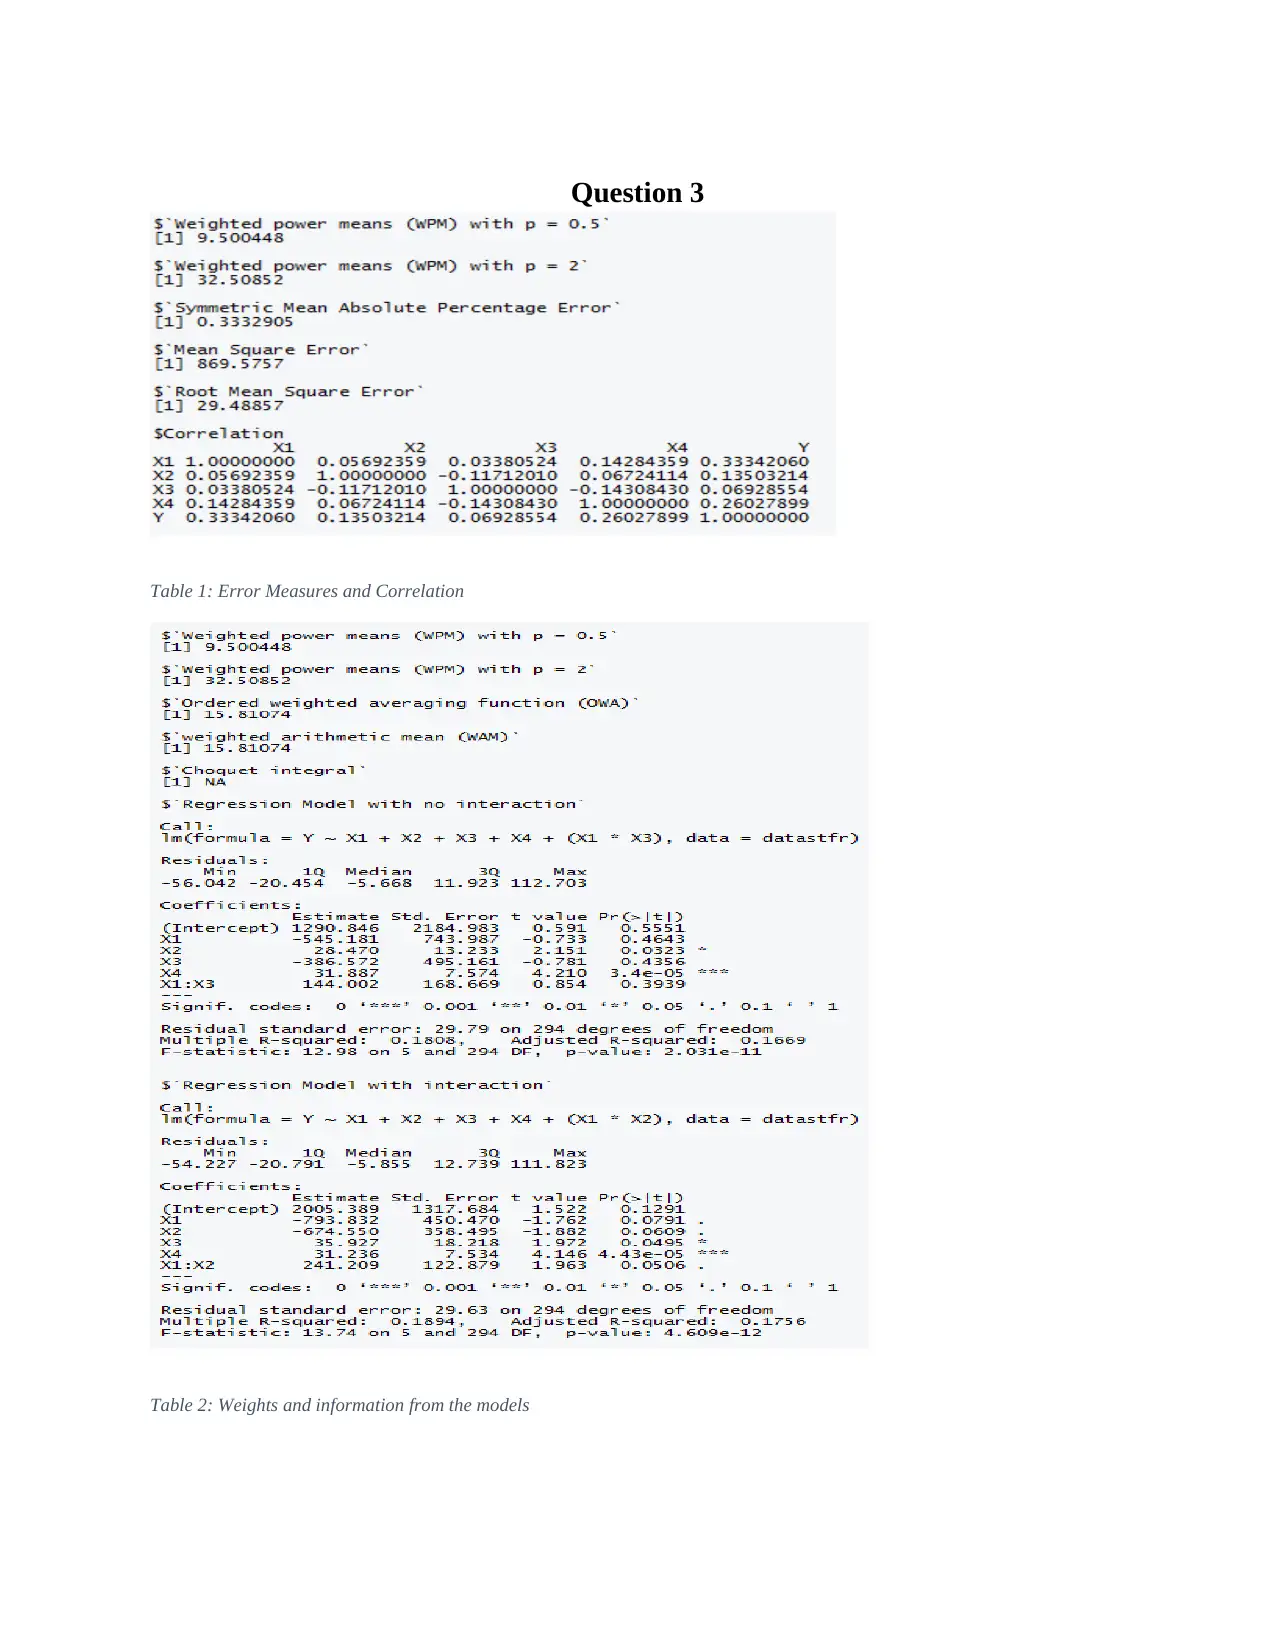
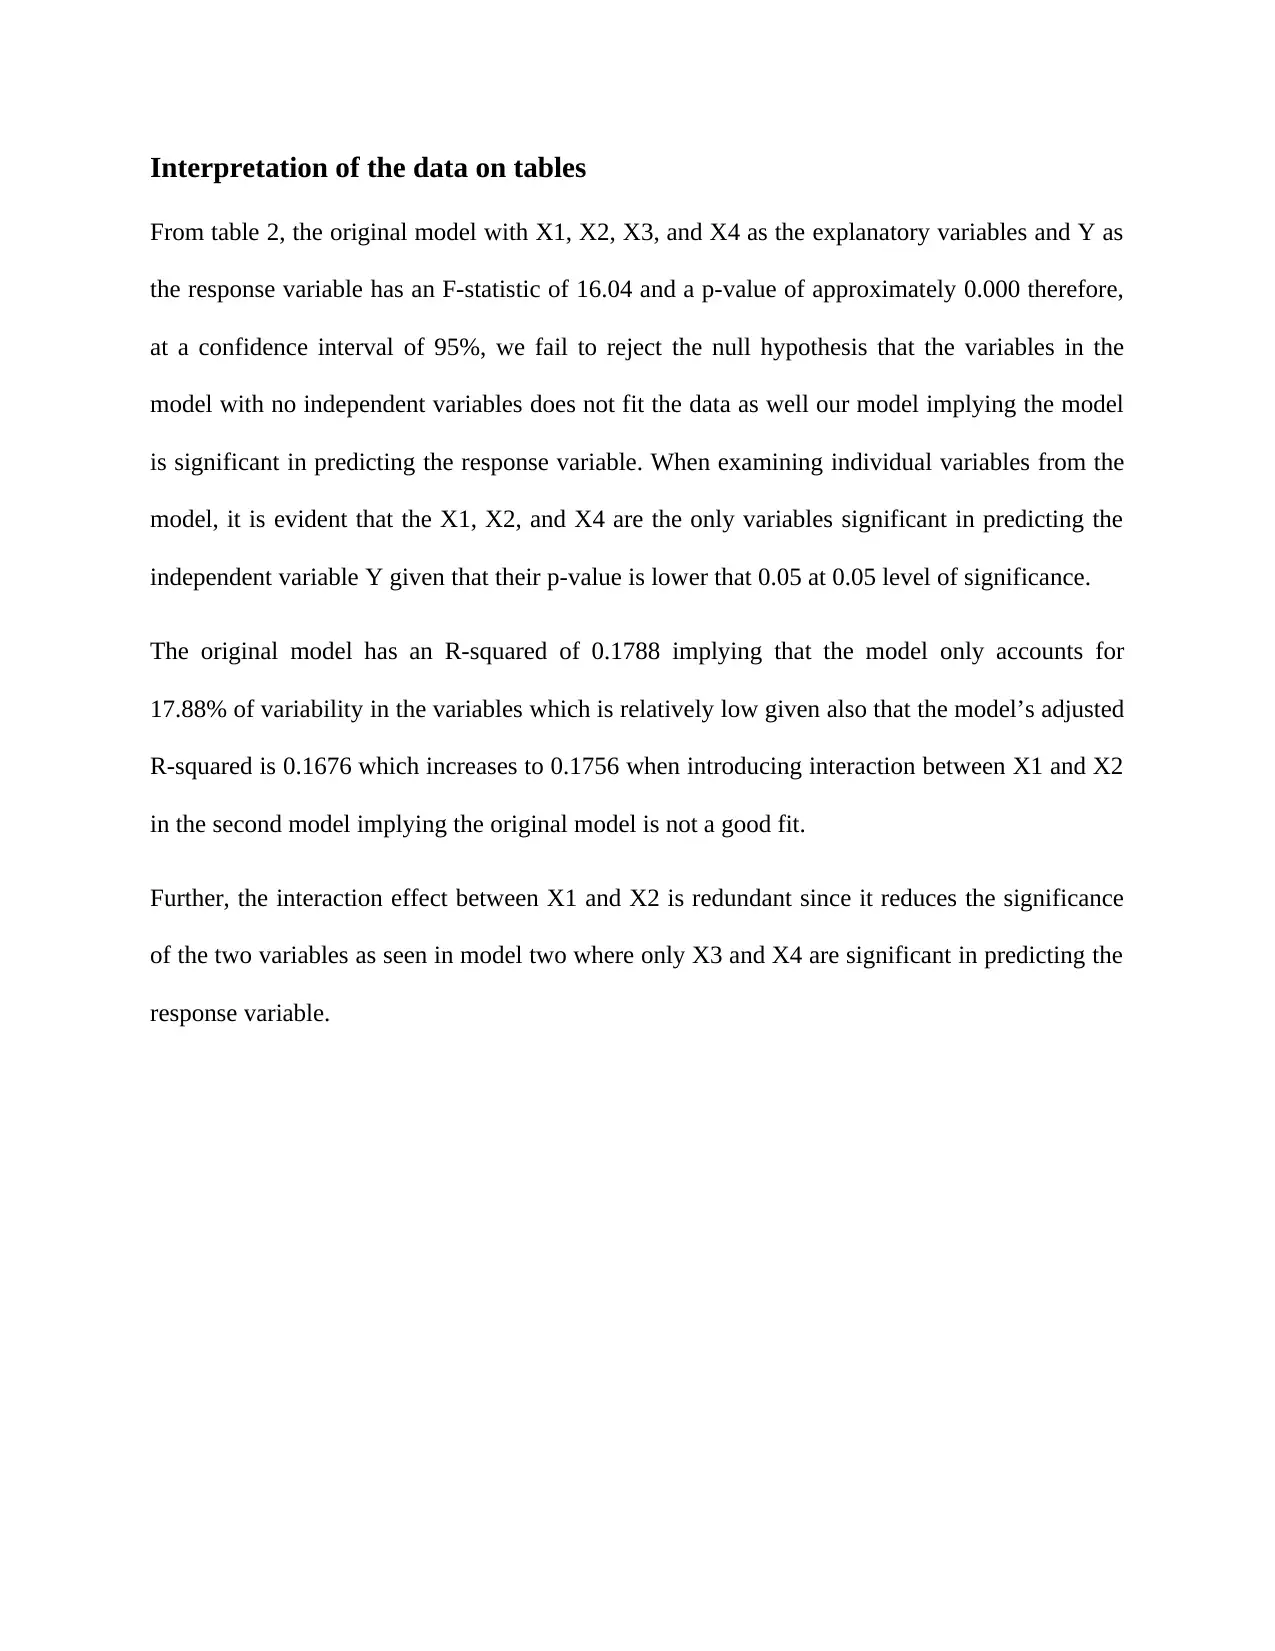
This assignment solution for SIT718, a Real World Analytics course, addresses problem-solving using aggregation functions for data analysis. The solution includes an interpretation of data presented in tables, focusing on error measures, correlation, and model weights. It also provides R code, including data transformation, model building (linear regression), and the examination of model summaries. The analysis involves the use of various aggregation functions like Weighted Power Means, SMAPE, MSE, RMSE, and correlation calculations. The interpretation section analyzes the significance of variables, R-squared values, and the impact of interaction effects within the models. The solution also incorporates the use of the Choquet integral and other statistical functions to summarize and analyze the dataset, providing a comprehensive approach to the assignment's requirements. The assignment aims to test students' understanding of aggregation functions and their application in data summarization and prediction, along with their ability to use R programming for real-world analytics.
Document Page
Question 3
Table 1: Error Measures and Correlation
Table 2: Weights and information from the models
tabler-icon-diamond-filled.svg

Paraphrase This Document

Need a fresh take? Get an instant paraphrase of this document with our AI Paraphraser
Document Page
Interpretation of the data on tables
From table 2, the original model with X1, X2, X3, and X4 as the explanatory variables and Y as
the response variable has an F-statistic of 16.04 and a p-value of approximately 0.000 therefore,
at a confidence interval of 95%, we fail to reject the null hypothesis that the variables in the
model with no independent variables does not fit the data as well our model implying the model
is significant in predicting the response variable. When examining individual variables from the
model, it is evident that the X1, X2, and X4 are the only variables significant in predicting the
independent variable Y given that their p-value is lower that 0.05 at 0.05 level of significance.
The original model has an R-squared of 0.1788 implying that the model only accounts for
17.88% of variability in the variables which is relatively low given also that the model’s adjusted
R-squared is 0.1676 which increases to 0.1756 when introducing interaction between X1 and X2
in the second model implying the original model is not a good fit.
Further, the interaction effect between X1 and X2 is redundant since it reduces the significance
of the two variables as seen in model two where only X3 and X4 are significant in predicting the
response variable.
Document Page
Appendix
R-code
source("AggWaFit718.R")
data1<-source("agresolution.R")
datast <- as.matrix(read.table("d_transformed.txt "))
#Converting the matrix to a dataframe so as to use it for model developing
datastfr <- as.data.frame(datast)
#Renaming the variables for easy identification
names(datastfr)[5] <- "Y"
names(datastfr)[1] <- "X1"
names(datastfr)[2] <- "X2"
names(datastfr)[3] <- "X3"
names(datastfr)[4] <- "X4"
#Examining correlation
correla <- cor(datastfr, use = "complete.obs")
round(correla, 3)
choquet(datast,2)
#Building the regression model
Document Page
regmod1<-lm(Y~ X1+X2+X3+X4, data = datastfr)
#Examining the model
summary(regmod1)
regmod2<-lm(Y~ X1+X2+X3+X4+(X1*X2), data = datastfr)
summary(regmod)
library(DescTools)
summtable1<-
list("Weighted power means (WPM) with p = 0.5"=PM(datast,1/length(datast),0.5),
"Weighted power means (WPM) with p = 2"=PM(datast,1/length(datast),2),
"Symmetric Mean Absolute Percentage Error"=SMAPE(regmod,digits=2),
"Mean Square Error"=MSE(regmod,digits=2),
"Root Mean Square Error"=RMSE(regmod),
"Correlation" =cor(datastfr, use = "complete.obs"))
summtable1
summtable2<-
list("Weighted power means (WPM) with p = 0.5"=PM(datast,1/length(datast),0.5),
"Weighted power means (WPM) with p = 2"=PM(datast,1/length(datast),2),
"Ordered weighted averaging function (OWA)"=OWA(datast),
tabler-icon-diamond-filled.svg

Paraphrase This Document

Need a fresh take? Get an instant paraphrase of this document with our AI Paraphraser
Document Page
"weighted arithmetic mean (WAM)"=weighted.mean(datast),
"Choquet integral"=choquet(datast,2),
"Regression Model with no interaction"=summary(regmod),
"Regression Model with interaction"=summary(regmod2))
summtable2
chevron_up_icon
1 out of 5
circle_padding
hide_on_mobile
zoom_out_icon