Statistics 11 - Six Sigma Assignment Solution, Analysis, and Report
VerifiedAdded on 2022/10/12
|11
|2066
|132
Homework Assignment
AI Summary
This document presents a comprehensive solution to a Statistics 11 Six Sigma assignment. The assignment includes multiple-choice questions covering core Six Sigma concepts such as DMAIC, statistical methods, ANOVA, and confidence intervals. It also features detailed solutions to several statistical problems, including formulating a Taguchi loss function, drafting a fractional factorial plan, performing hypothesis testing on pH measurements, analyzing tensile strength and hardness data using regression analysis, and constructing a control chart. The document concludes with an open-answer problem addressing the application of Six Sigma in a professional context, outlining a proposed implementation strategy for a statistician role within a company, and providing relevant references. The solution demonstrates a strong understanding of statistical principles and their application in process improvement and quality control.

Statistics 1
Six Sigma
By [Name of Student]
[Institutional Affiliation]
[Professor’s Name]
[Date of Submission]
Six Sigma
By [Name of Student]
[Institutional Affiliation]
[Professor’s Name]
[Date of Submission]
Paraphrase This Document
Need a fresh take? Get an instant paraphrase of this document with our AI Paraphraser
Statistics 2
1. DMAIC is:
A. A tool
2. Statistics in Six Sigma is used to:
B. make quantitative analyses and base decisions on facts
3. If X is a random variable distributed according to a model that is normal
with μ and SD σ, the probability to observe values of X outside the interval [μ-
σ; μ+2σ] is:
A. 0.005
4. To apply the Analysis of variance (ANOVA), we have to:
A. check the assumptions for the application of the model
5. A confidence interval is:
C. an interval which may contain the population mean with a given
confidence
6. Six Sigma projects deal only with Normal data?
B. Yes, because also attribute data can be transformed into Normal
data
7. The scatter plot:
C. helps finding outliers in a dataset
8. In a Gage R&R study we would like to discover:
C. possible causes of poor reproducibility and repeatability
9. Variation Mode and Effect Analysis does not:
Statistics 3
A. help solving variation-related problems
10. The top-event in fault-tree analysis
C. Is necessarily followed by an OR gate
11. Designing a “Robust” product or process means:
C. making it insensitive to the action of noise factors
12. A control chart should not be utilized:
D. When we do not have specification limits
13. Hypothesis test is used to do all of these EXCEPT:
A. To make a statement that is best supported by the evidence of sample
data.
14. Upper and lower control limits are:
D. Based on common causes of random variation in the process
15. Outliers:
A. are special causes of variation
Problem 1.
Formulate the loss function according to Taguchi, in the case in which the system is
optimized if the response is the maximum possible (HB = higher is better). Formulate
the probabilistic "forecast" of this function by indicating the strategy to be pursued to
reduce the expected value.
Solution
⊘ This is a preview!⊘
Do you want full access?
Subscribe today to unlock all pages.
Trusted by 1+ million students worldwide
Statistics 4
In a aggressive market surroundings, continual pleasant improvements and fee
reductions are vital for enterprise survival. An vital measurement of the great of a
synthetic product is the full loss generated through that product to society. Change
the pre-production experimental process from various one thing at a time to varying
many elements simultaneously (SDE), in order that nice can be constructed into the
product and the method.
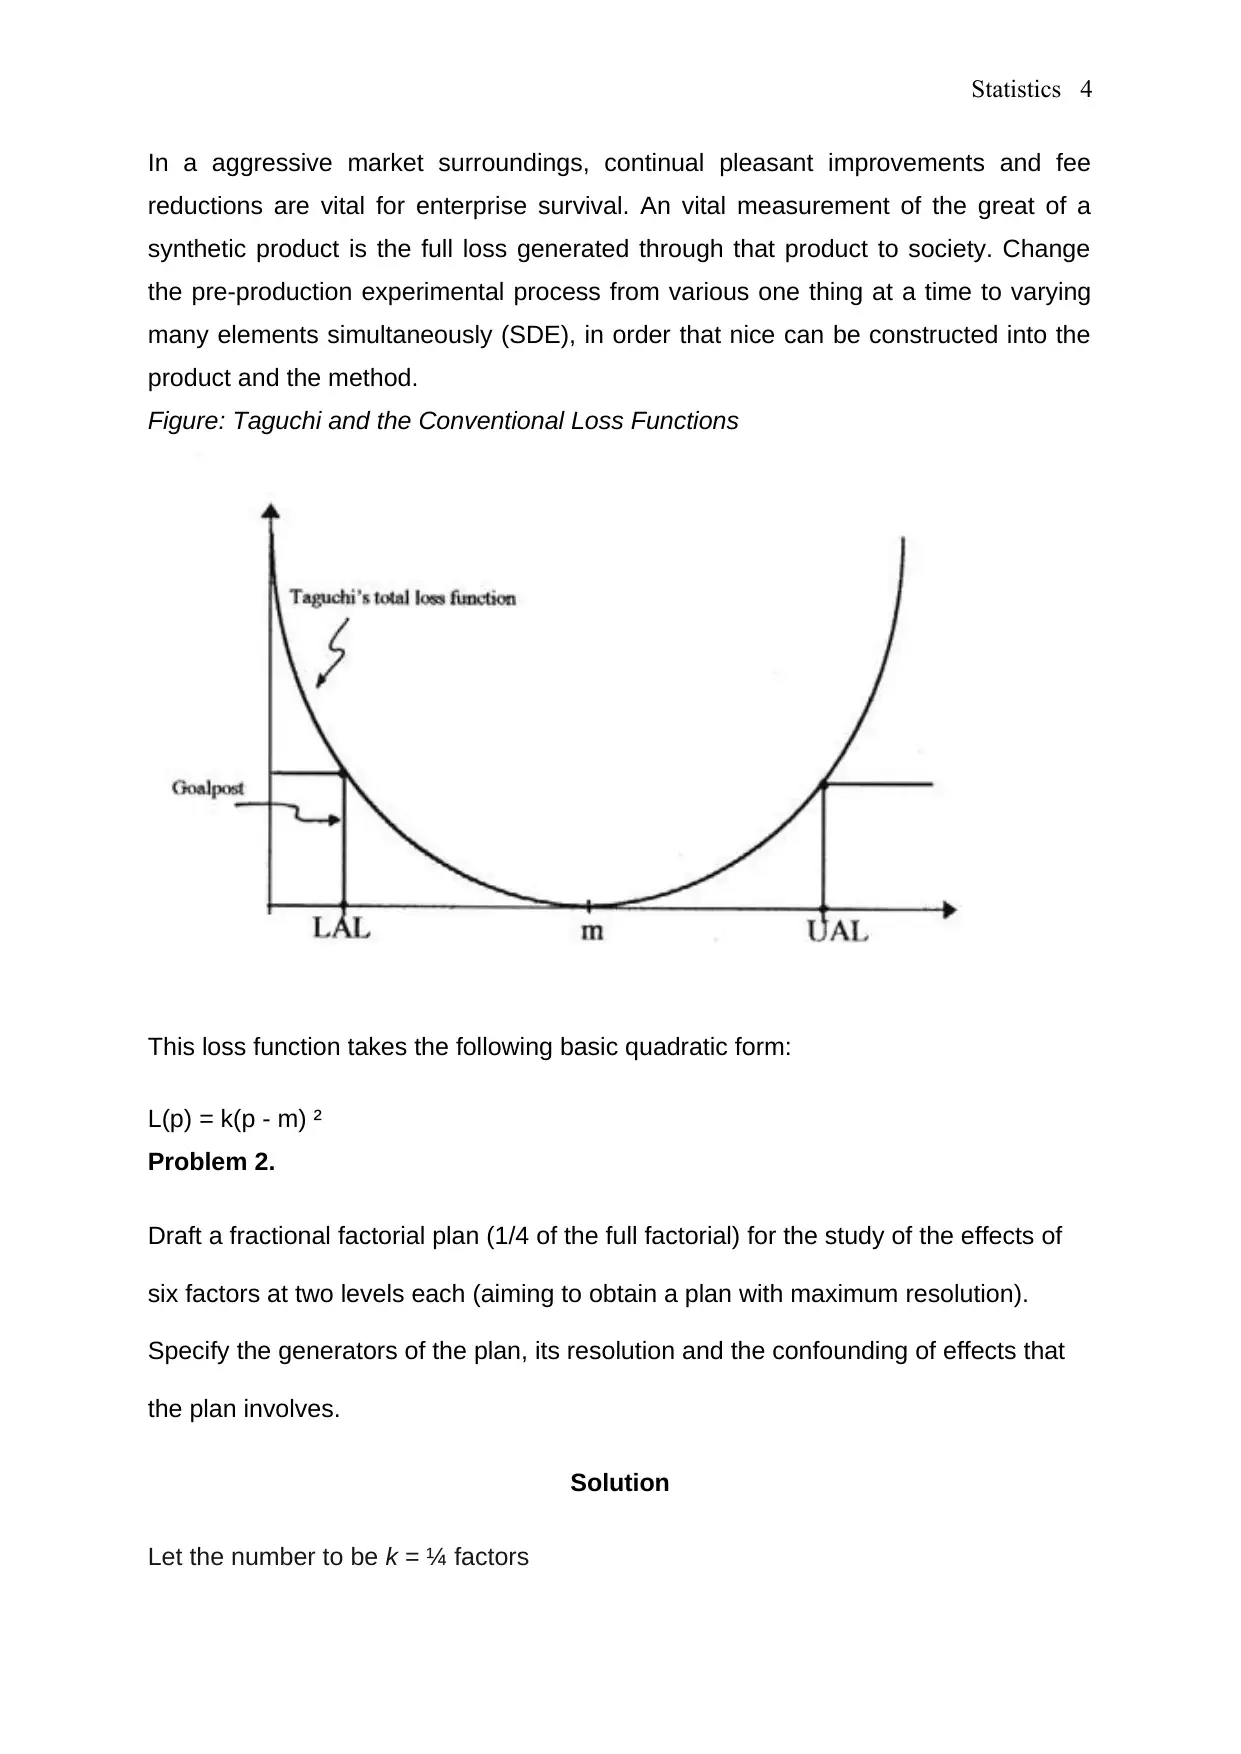
Figure: Taguchi and the Conventional Loss Functions
This loss function takes the following basic quadratic form:
L(p) = k(p - m) ²
Problem 2.
Draft a fractional factorial plan (1/4 of the full factorial) for the study of the effects of
six factors at two levels each (aiming to obtain a plan with maximum resolution).
Specify the generators of the plan, its resolution and the confounding of effects that
the plan involves.
Solution
Let the number to be k = ¼ factors
In a aggressive market surroundings, continual pleasant improvements and fee
reductions are vital for enterprise survival. An vital measurement of the great of a
synthetic product is the full loss generated through that product to society. Change
the pre-production experimental process from various one thing at a time to varying
many elements simultaneously (SDE), in order that nice can be constructed into the
product and the method.
Figure: Taguchi and the Conventional Loss Functions
This loss function takes the following basic quadratic form:
L(p) = k(p - m) ²
Problem 2.
Draft a fractional factorial plan (1/4 of the full factorial) for the study of the effects of
six factors at two levels each (aiming to obtain a plan with maximum resolution).
Specify the generators of the plan, its resolution and the confounding of effects that
the plan involves.
Solution
Let the number to be k = ¼ factors
Paraphrase This Document
Need a fresh take? Get an instant paraphrase of this document with our AI Paraphraser
Statistics 5
the fraction index: p = 1 which is the number of runs (level
combinations):
selecting a 3 factors (e.g. A, B, C) to form a quarter full factorial
design
Alias) D with a high order interaction of A, B and C
Problem 3.
In a chemical procedure, it is fundamentally important that the pH of one of the
reagents is exactly 8.20. We know that the instrument used to measure the pH
provides values with Gaussian distribution with an average equal to the true value of
the measurand and standard deviation 0.02 (the measuring instrument is obviously
not exact).
Assuming that 10 independent measurements gave the following values:
8.18 8.18 8.18 8.22 8.19
8.20 8.19 8.17 8.17 8.19
What conclusions can be drawn, with significance level equal to 0.99?
Solution
Given the following;
pH of one of the reagent = 8.20
n = 10 measurements
Standard deviation δ = 0.02
The hypotheses to be tested can be formulated as follows
Statistics 6
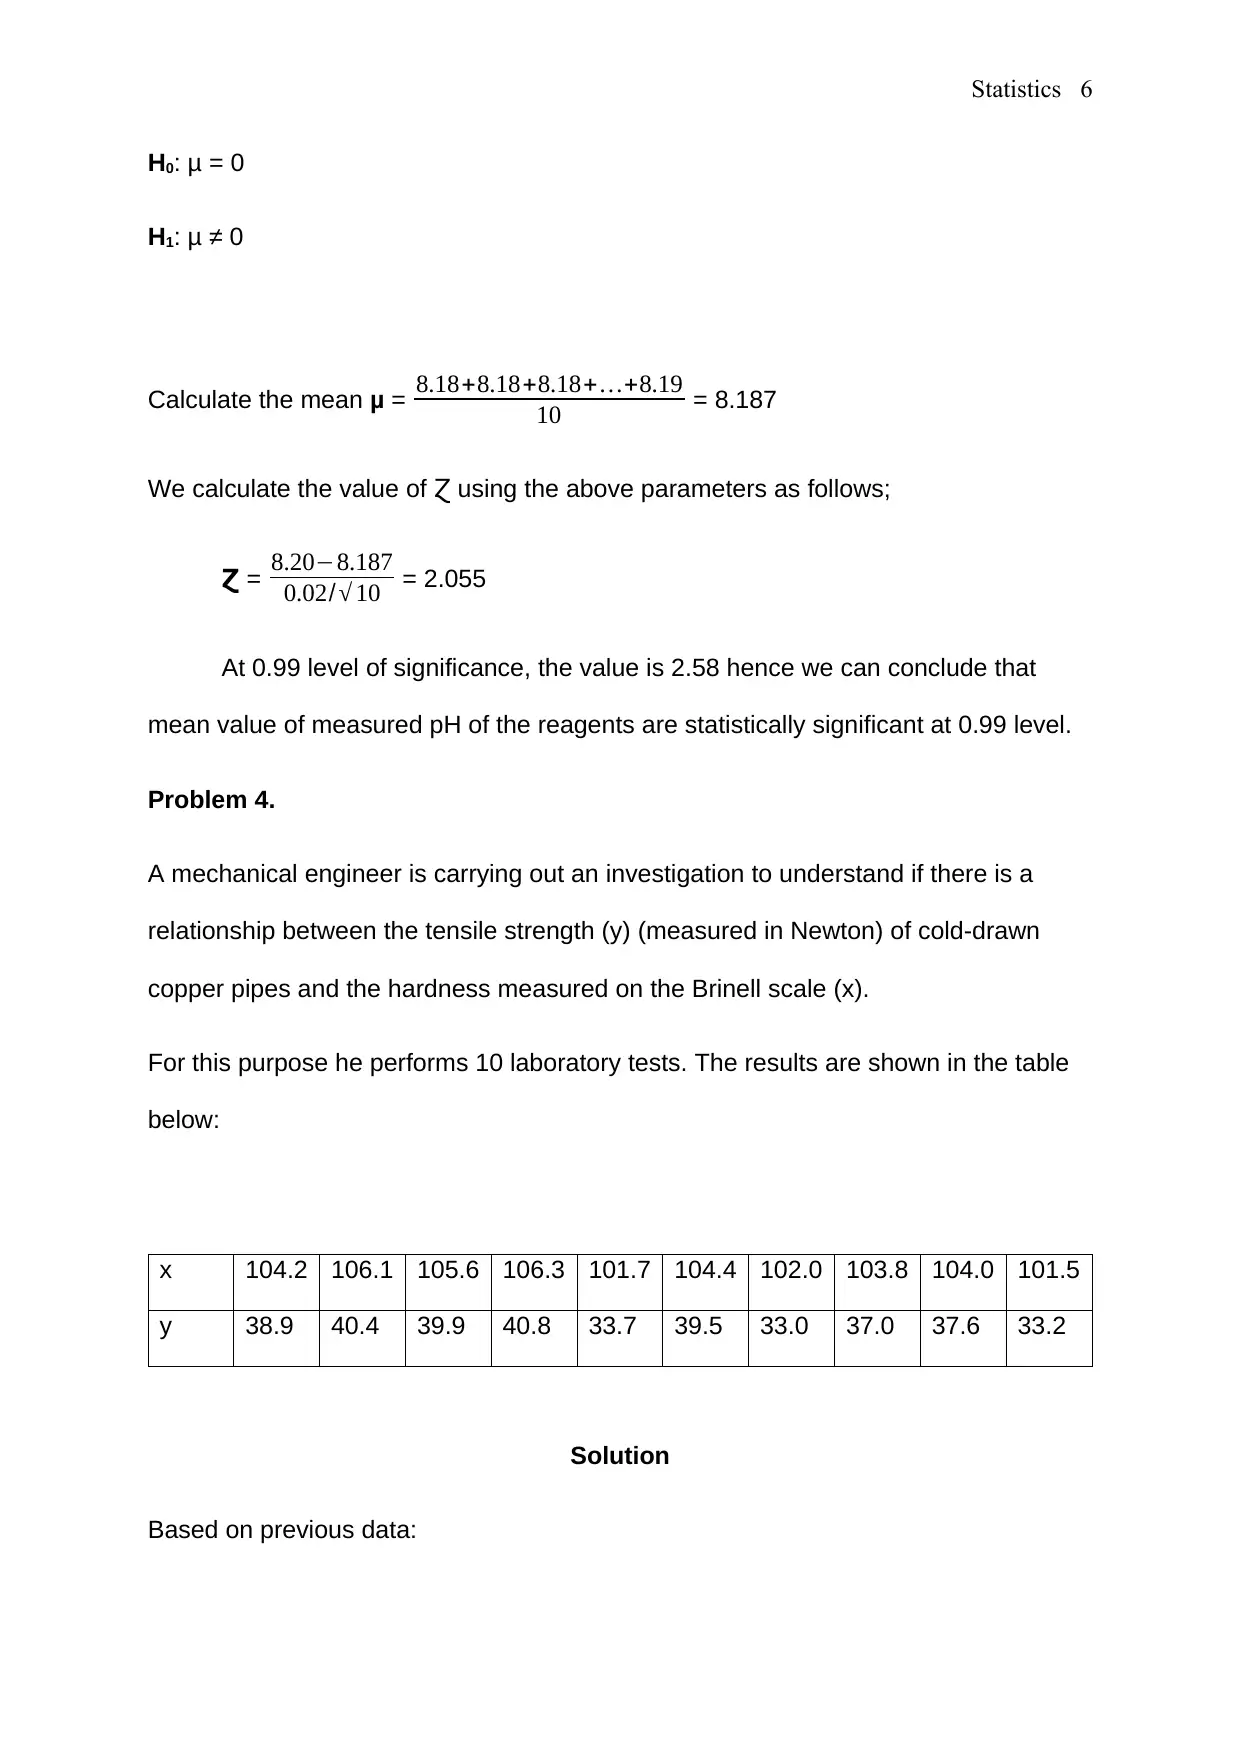
H0: μ = 0
H1: μ ≠ 0
Calculate the mean μ = 8.18+8.18+8.18+ …+8.19
10 = 8.187
We calculate the value of using the above parameters as follows;Ɀ
Ɀ = 8.20−8.187
0.02/ √ 10 = 2.055
At 0.99 level of significance, the value is 2.58 hence we can conclude that
mean value of measured pH of the reagents are statistically significant at 0.99 level.
Problem 4.
A mechanical engineer is carrying out an investigation to understand if there is a
relationship between the tensile strength (y) (measured in Newton) of cold-drawn
copper pipes and the hardness measured on the Brinell scale (x).
For this purpose he performs 10 laboratory tests. The results are shown in the table
below:
x 104.2 106.1 105.6 106.3 101.7 104.4 102.0 103.8 104.0 101.5
y 38.9 40.4 39.9 40.8 33.7 39.5 33.0 37.0 37.6 33.2
Solution
Based on previous data:
⊘ This is a preview!⊘
Do you want full access?
Subscribe today to unlock all pages.
Trusted by 1+ million students worldwide
Statistics 7
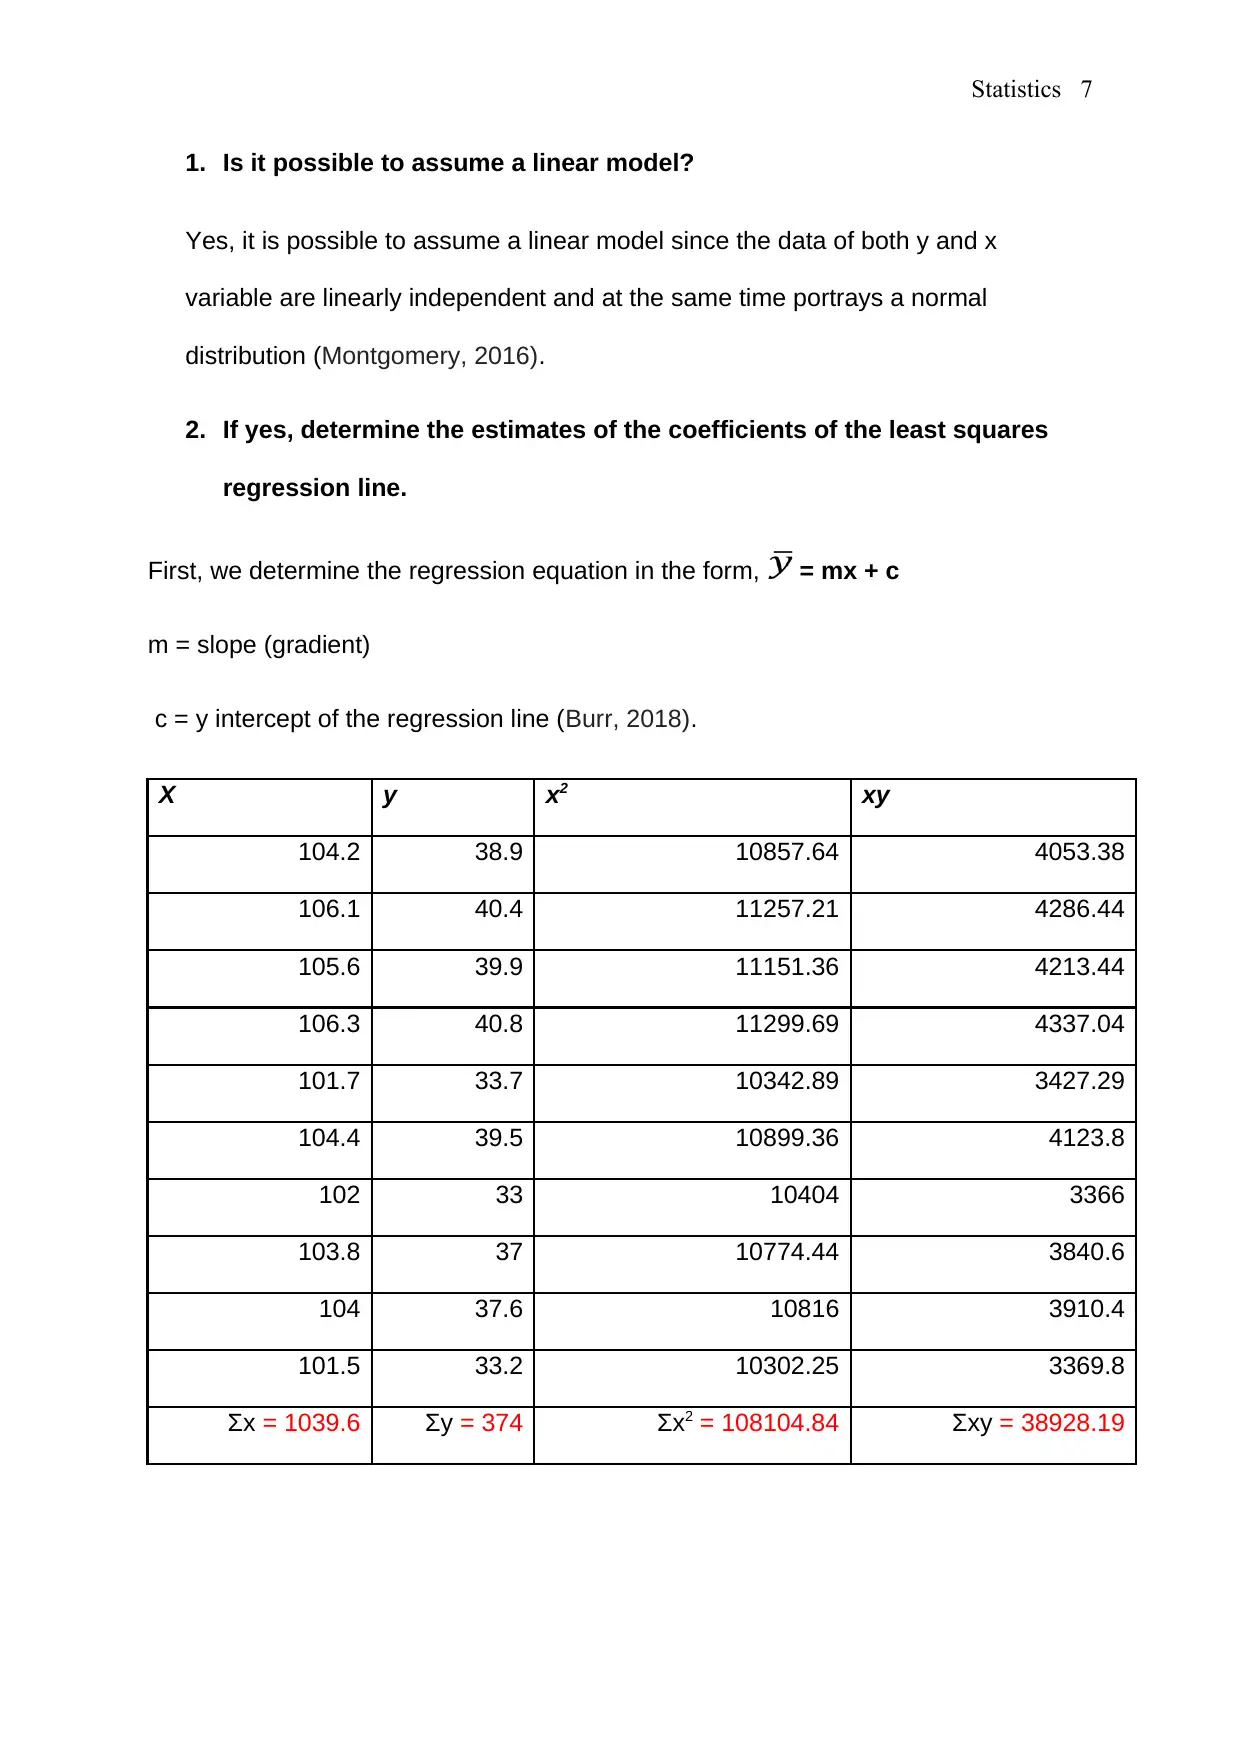
1. Is it possible to assume a linear model?
Yes, it is possible to assume a linear model since the data of both y and x
variable are linearly independent and at the same time portrays a normal
distribution (Montgomery, 2016).
2. If yes, determine the estimates of the coefficients of the least squares
regression line.
First, we determine the regression equation in the form, = mx + c
m = slope (gradient)
c = y intercept of the regression line (Burr, 2018).
X y x2 xy
104.2 38.9 10857.64 4053.38
106.1 40.4 11257.21 4286.44
105.6 39.9 11151.36 4213.44
106.3 40.8 11299.69 4337.04
101.7 33.7 10342.89 3427.29
104.4 39.5 10899.36 4123.8
102 33 10404 3366
103.8 37 10774.44 3840.6
104 37.6 10816 3910.4
101.5 33.2 10302.25 3369.8
Ʃx = 1039.6 Ʃy = 374 Ʃx2 = 108104.84 Ʃxy = 38928.19
Paraphrase This Document
Need a fresh take? Get an instant paraphrase of this document with our AI Paraphraser
Statistics 8
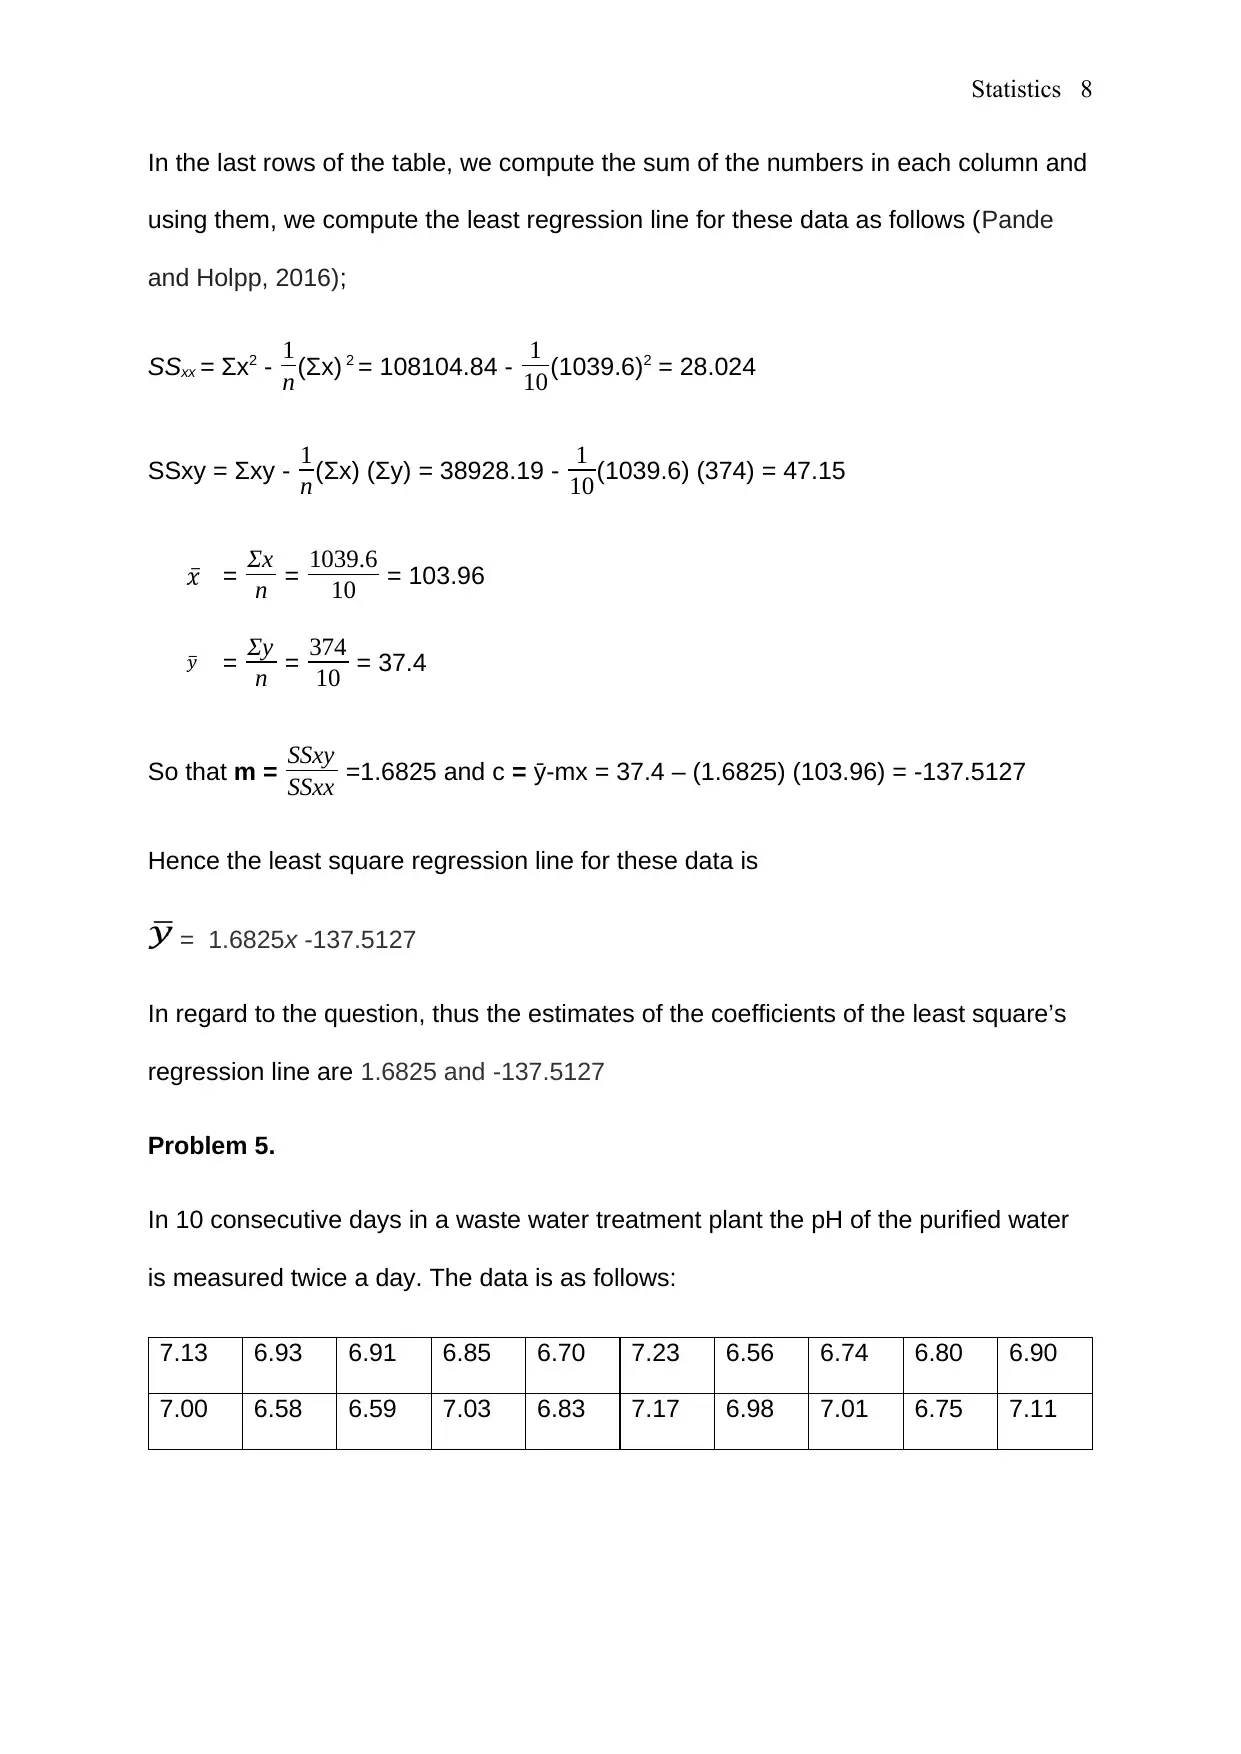
In the last rows of the table, we compute the sum of the numbers in each column and
using them, we compute the least regression line for these data as follows (Pande
and Holpp, 2016);
SSxx = Ʃx2 - 1
n (Ʃx) 2 = 108104.84 - 1
10(1039.6)2 = 28.024
SSxy = Ʃxy - 1
n (Ʃx) (Ʃy) = 38928.19 - 1
10(1039.6) (374) = 47.15
= Ʃx
n = 1039.6
10 = 103.96
= Ʃy
n = 374
10 = 37.4
So that m = SSxy
SSxx =1.6825 and c = ӯ-mx = 37.4 – (1.6825) (103.96) = -137.5127
Hence the least square regression line for these data is
= 1.6825x -137.5127
In regard to the question, thus the estimates of the coefficients of the least square’s
regression line are 1.6825 and -137.5127
Problem 5.
In 10 consecutive days in a waste water treatment plant the pH of the purified water
is measured twice a day. The data is as follows:
7.13 6.93 6.91 6.85 6.70 7.23 6.56 6.74 6.80 6.90
7.00 6.58 6.59 7.03 6.83 7.17 6.98 7.01 6.75 7.11
Statistics 9
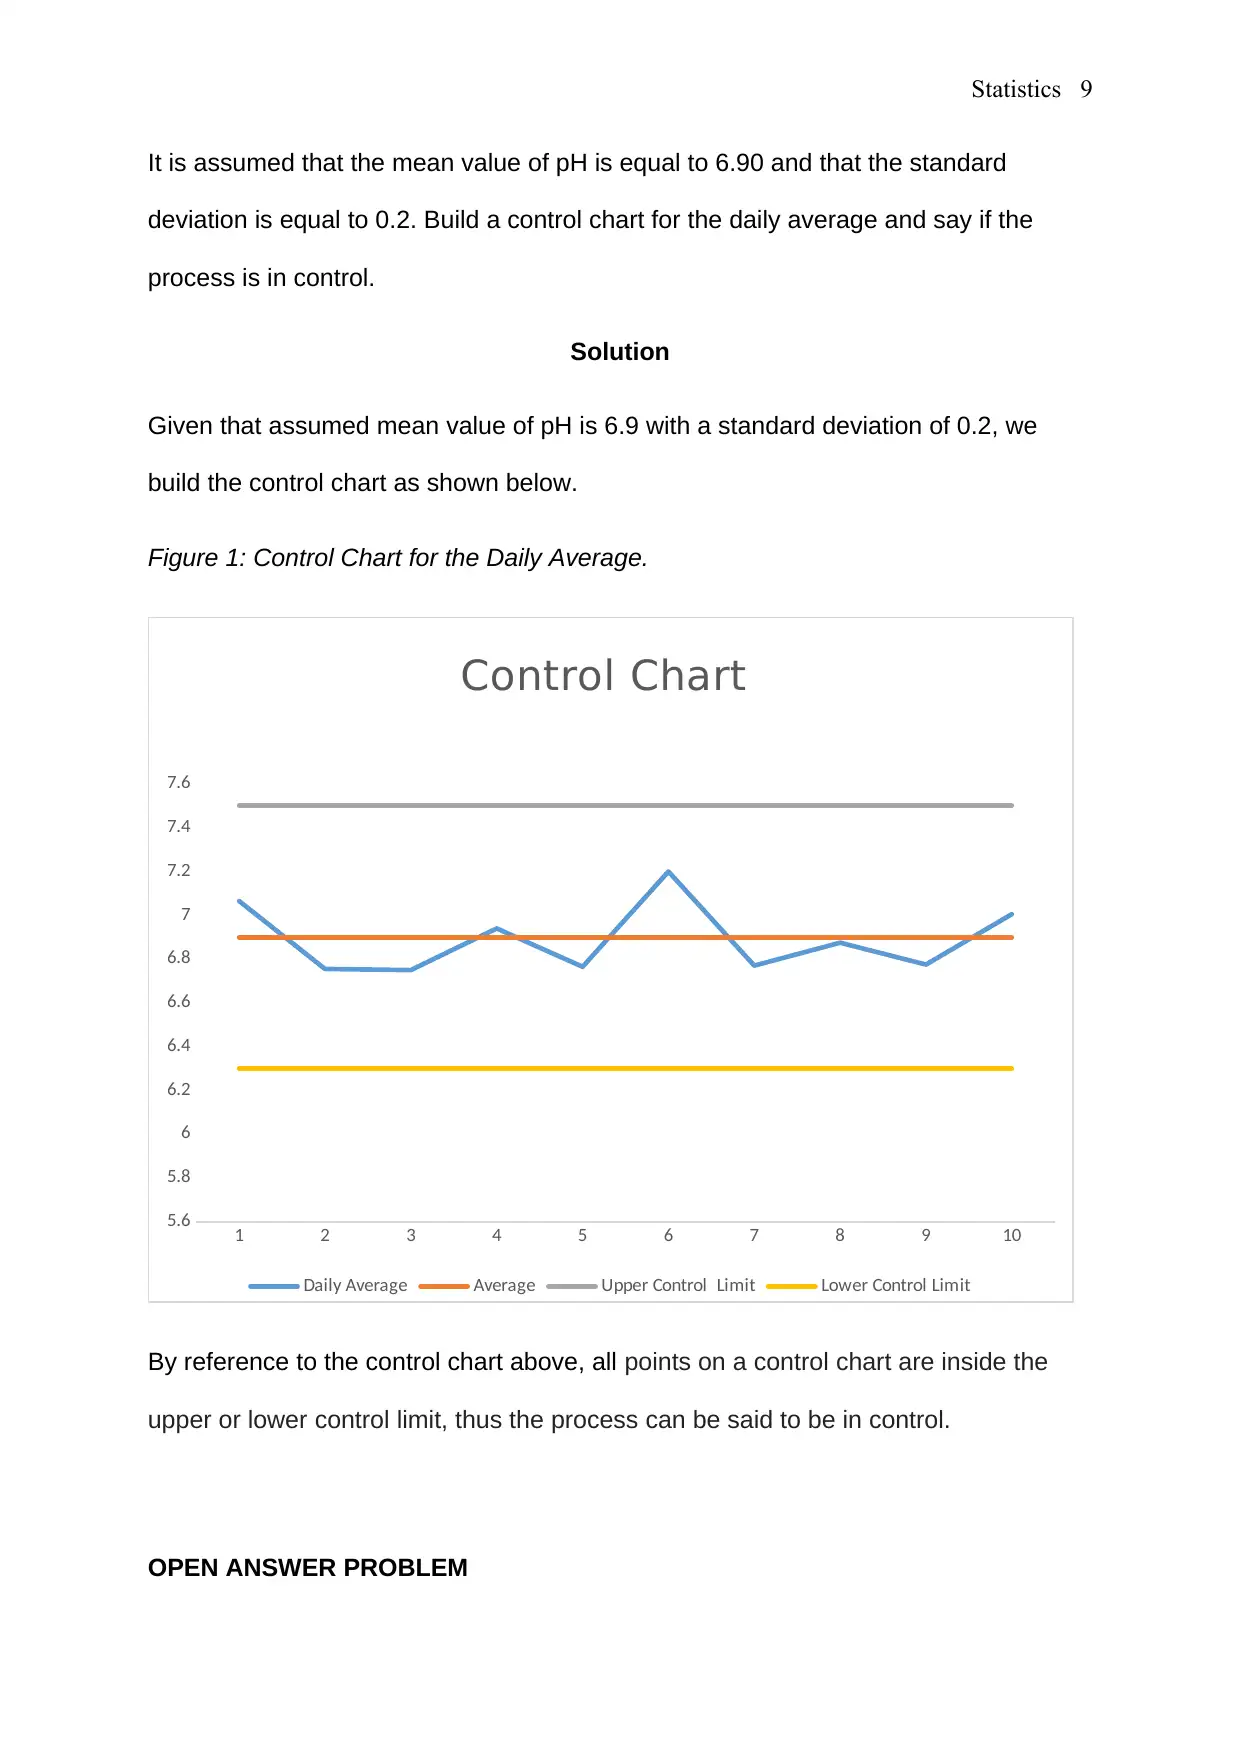
It is assumed that the mean value of pH is equal to 6.90 and that the standard
deviation is equal to 0.2. Build a control chart for the daily average and say if the
process is in control.
Solution
Given that assumed mean value of pH is 6.9 with a standard deviation of 0.2, we
build the control chart as shown below.
Figure 1: Control Chart for the Daily Average.
1 2 3 4 5 6 7 8 9 10
5.6
5.8
6
6.2
6.4
6.6
6.8
7
7.2
7.4
7.6
Control Chart
Daily Average Average Upper Control Limit Lower Control Limit
By reference to the control chart above, all points on a control chart are inside the
upper or lower control limit, thus the process can be said to be in control.
OPEN ANSWER PROBLEM
⊘ This is a preview!⊘
Do you want full access?
Subscribe today to unlock all pages.
Trusted by 1+ million students worldwide

Statistics 10
In regard to my application for the position of a statistician as declared by your
company, I would wish to add the following in regard to the position and job
description. Since your company is a reputable one and which is a well-established
and recognized internationally, it does not however apply the Six Sigma in its
operation. I therefore take this opportunity to apply a competent implementer of the
six sigma having done so in more than five reputable companies in the past.
Application of six sigma in any business oriented entity is important as far as decision
making and process controls are concerned. Just to mention one, six sigma seeks to
improve the quality of the output of any given running process by identifying and
removing the causes of defects and minimizing variability in manufacturing and the
overall business process.
In the first month, I would start by defining the system of the organization,
listen to the voice of the customers and their irreducible minimums based on their
requirements, the goals of the company to be specific. In the first month in the
company, I would measure very important characteristics of the existing processes
and assemble appropriate data that would help me calculate the ‘as-is’ Process
Capability. I would then analyse the data to investigate and verify cause and effect
relationships. I would then determine what the associations are all about and attempt
to ensure that all the factors have been considered.
In about three months of my recruitment, I will be in a position to improve and
optimize the current processes within the company in reference to the data analysis
using various practises such as design and analysis of experiments, mistake proofing
and the standard work to make a good state in the future. I would also, set up pilot
runs to establish the capability of various processes within this company.
In six-month, time of my recruitment, I would be in position to help the
management and other stakeholders by using the six sigma techniques to predict
and control the future state process to ensure that any deviation and variation. At
this, I will be in a position to implement any other relevant control systems such as
statistical process control, population boards, and visual workplaces and
progressively/continuously monitor the processes within the organization. At this
point, the company will realize the right decisions as a result of the techniques I will
implement within the organization.
At the end of one year, I would be in a position to evaluate whether there is an
improvement within various processes, whether the defects have been lowered as a
results of the implementation of the six sigma, whether the variability of the process
have been lowered, whether customers’ satisfaction have been increased and finally
if much profits have been realized as results of the changes brought about by the
implementation of the six sigma. I therefore, take this prime opportunity to present my
application. I look forward to your positive response and I look forward to join the
company as soon as possible. Thank you.
References
Paraphrase This Document
Need a fresh take? Get an instant paraphrase of this document with our AI Paraphraser
Statistics 11
Montgomery, D.C., (2016). Statistical quality control (Vol. 7). New York: Wiley.
Woodall, W.H., (2015). The statistical design of quality control charts. Journal of the
Royal Statistical Society: Series D (The Statistician), 34(2), pp.155-160.
Burr, I.W., (2018). Statistical quality control methods. Routledge.
Pande, P.S. and Holpp, L., (2016). What is six sigma?. McGraw-Hill Professional.
Pyzdek, T., (2013). The six sigma. McGrow-Hill, New York.
Linderman, K., Schroeder, R.G., Zaheer, S. and Choo, A.S., 2013. Six Sigma: a goal‐
theoretic perspective. Journal of Operations management, 21(2), pp.193-203.
1 out of 11


Your All-in-One AI-Powered Toolkit for Academic Success.
+13062052269
info@desklib.com
Available 24*7 on WhatsApp / Email
![[object Object]](/_next/static/media/star-bottom.7253800d.svg)
Unlock your academic potential
Copyright © 2020–2026 A2Z Services. All Rights Reserved. Developed and managed by ZUCOL.