Analysis of Skin Care Product Expenditure: A Research Method Report

Verified

Added on  2020/04/21

|19
|2334
|360
Report
AI Summary
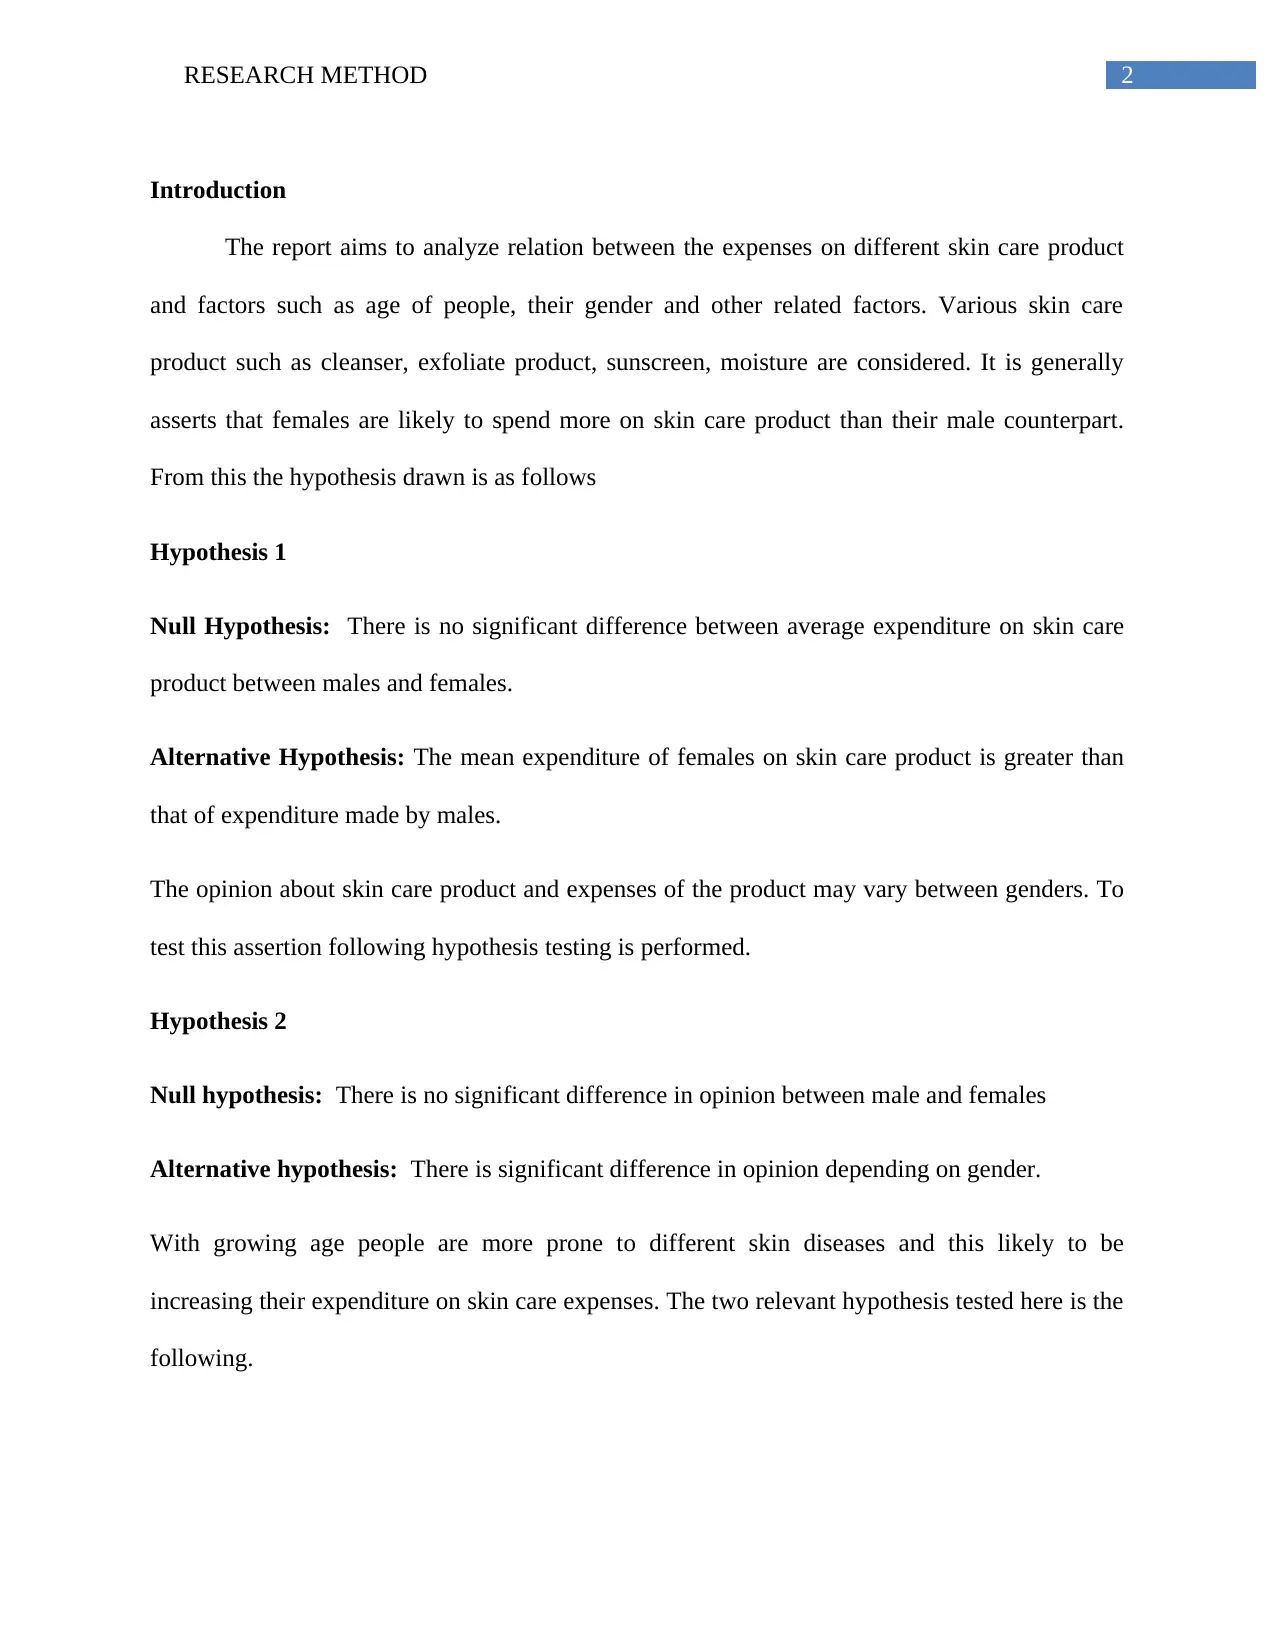
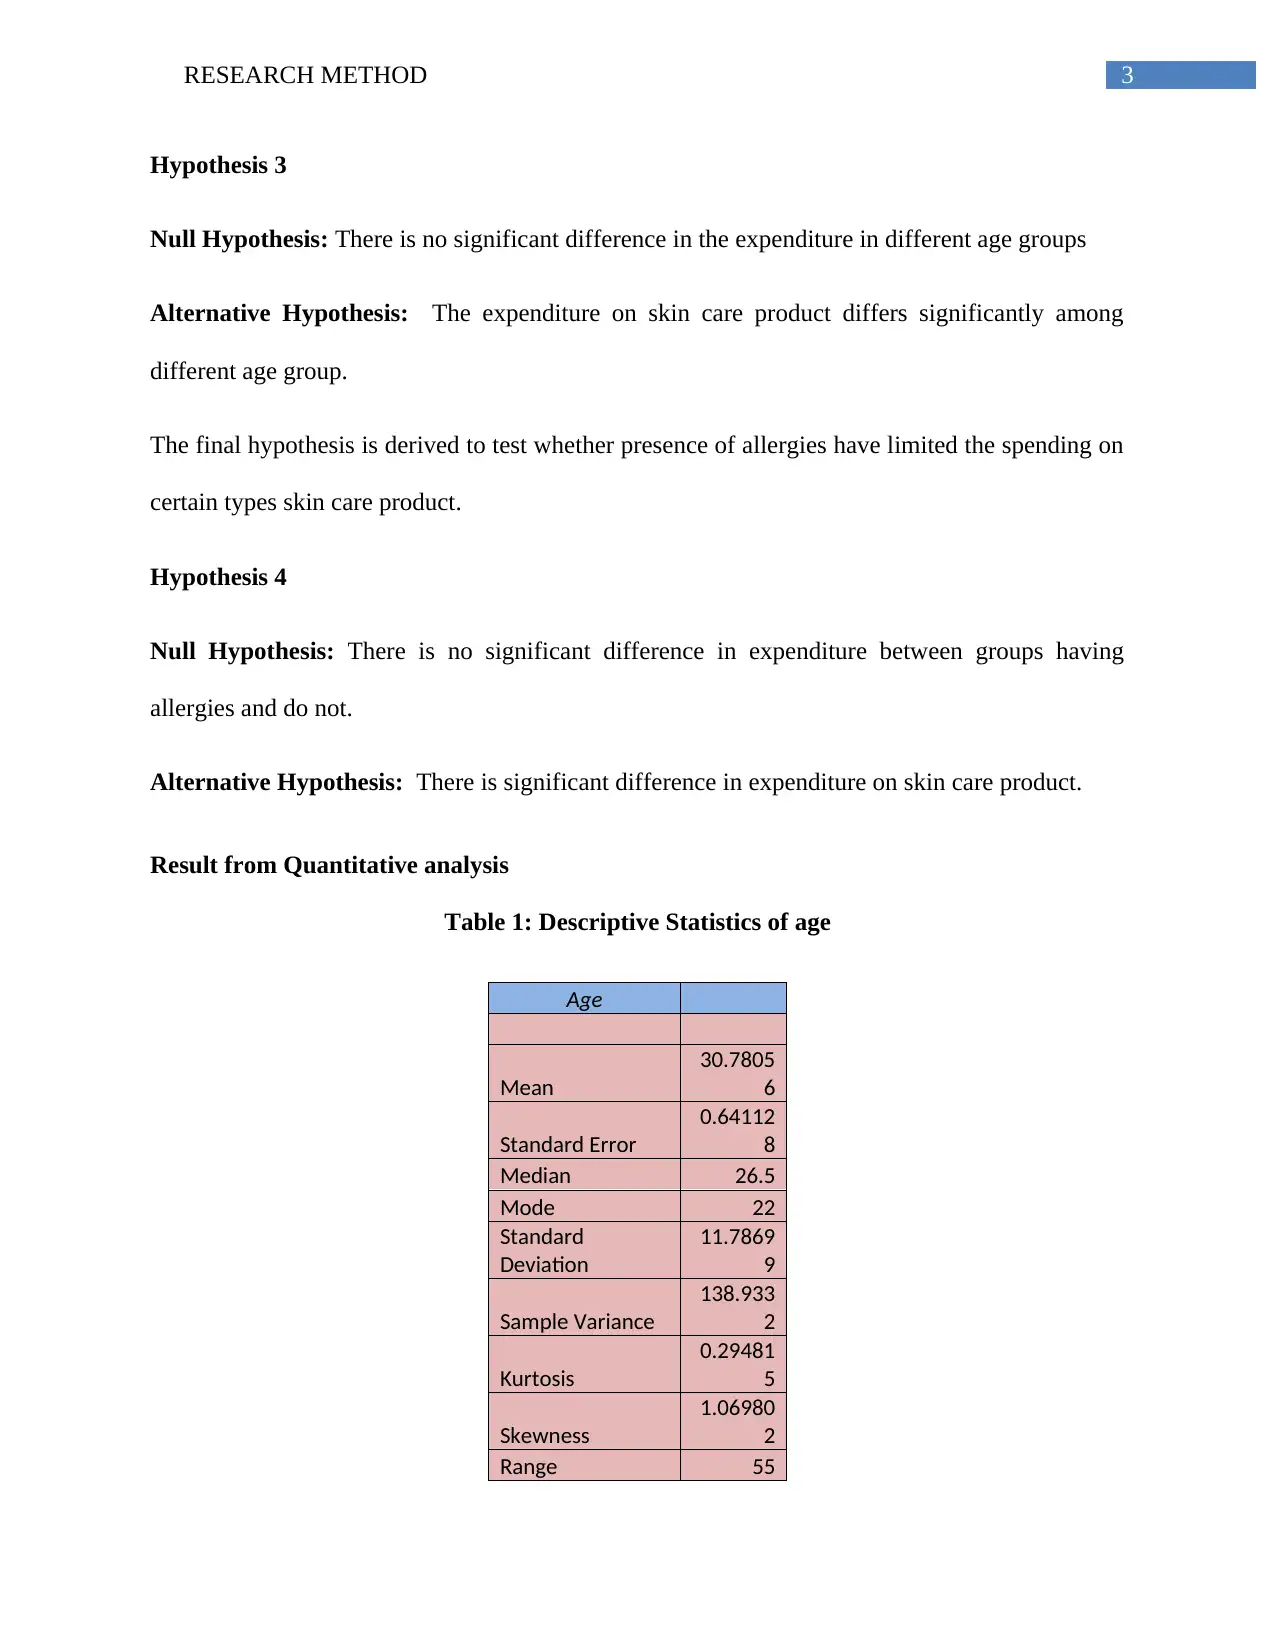
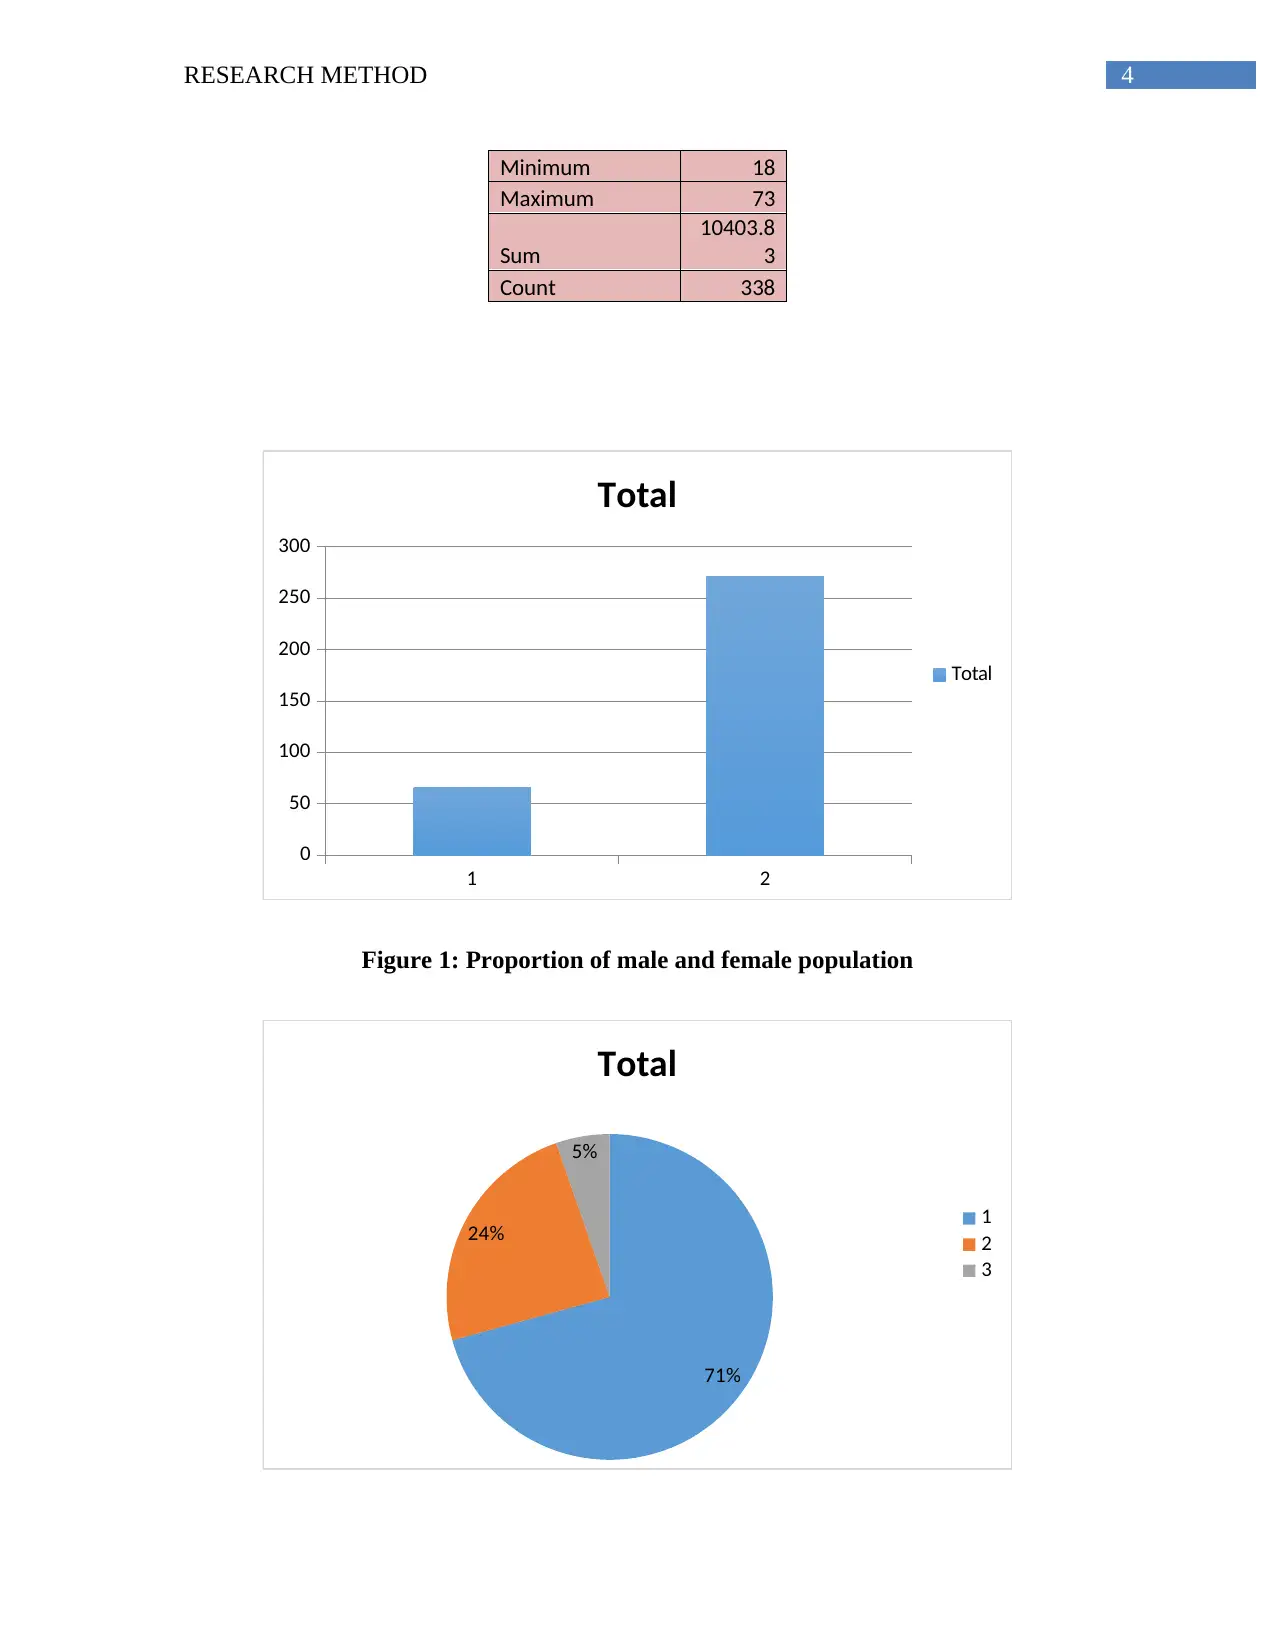
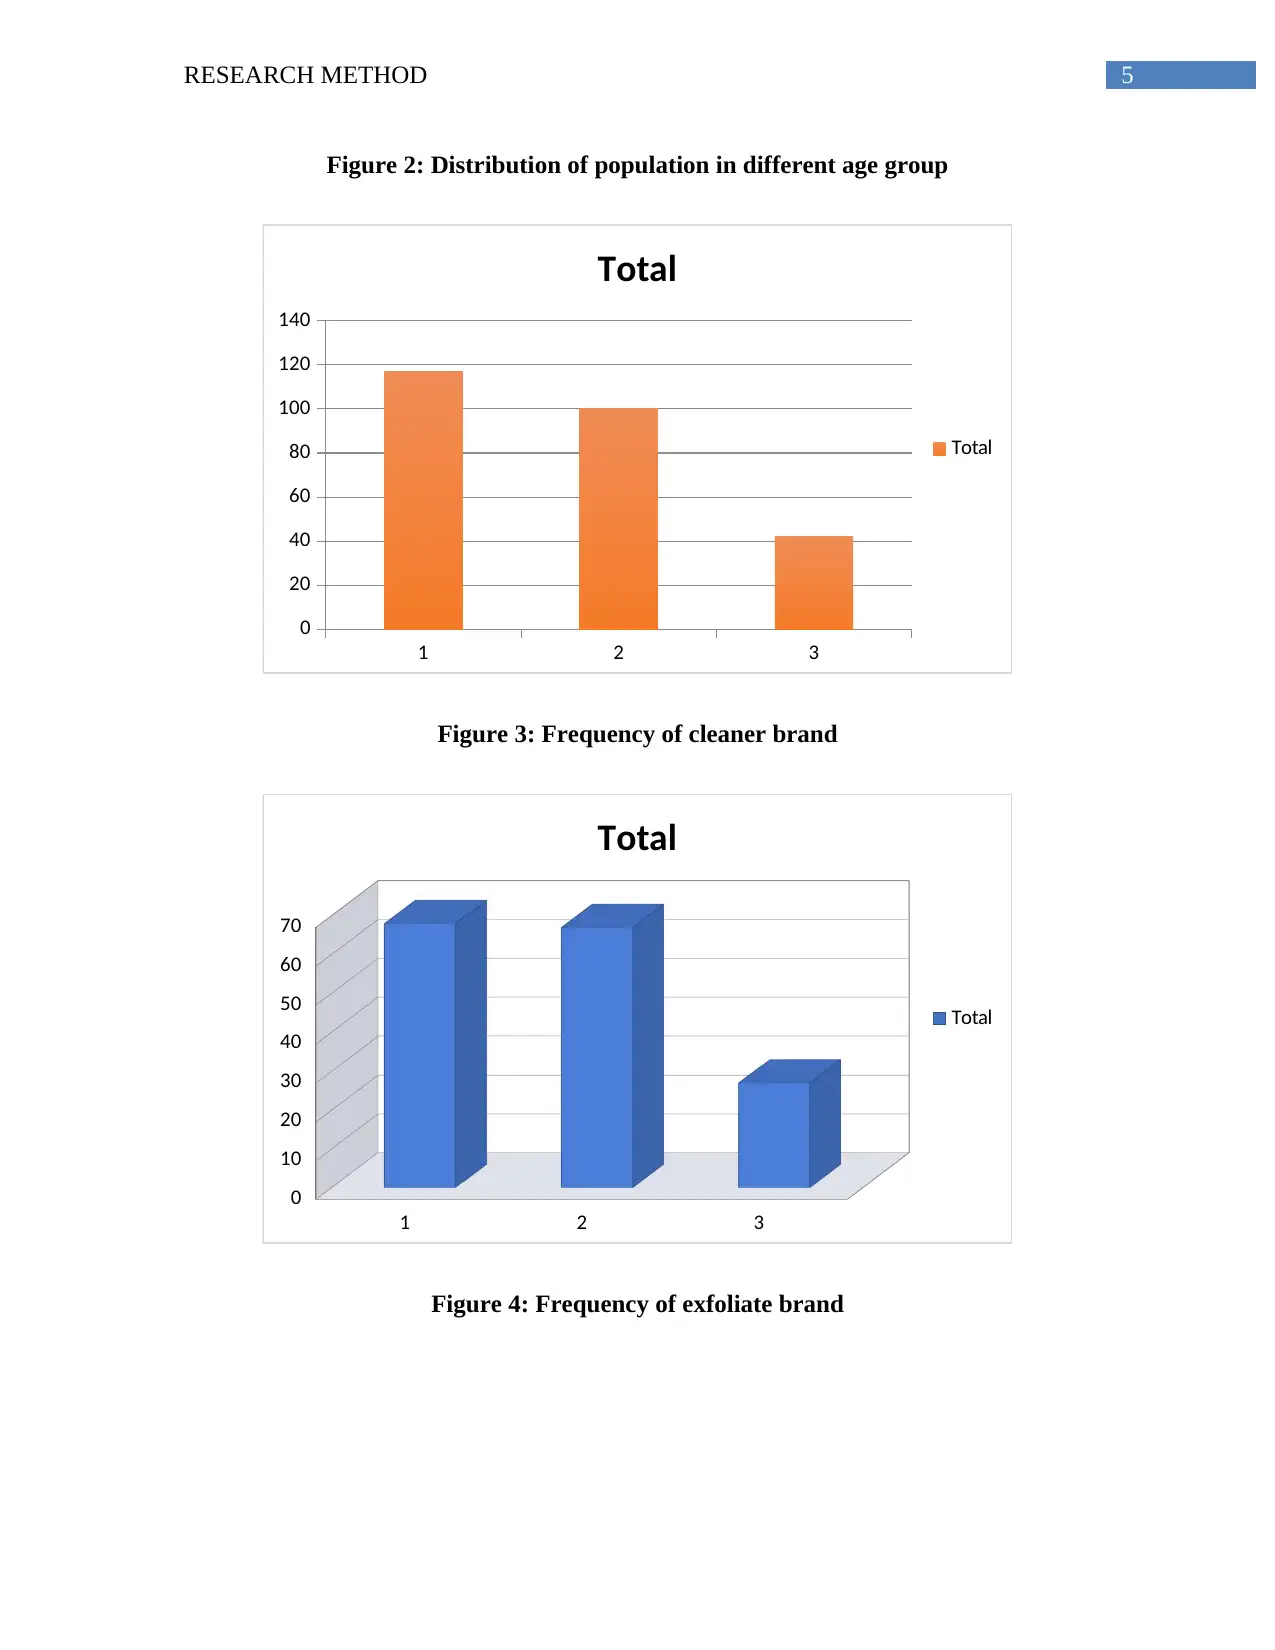
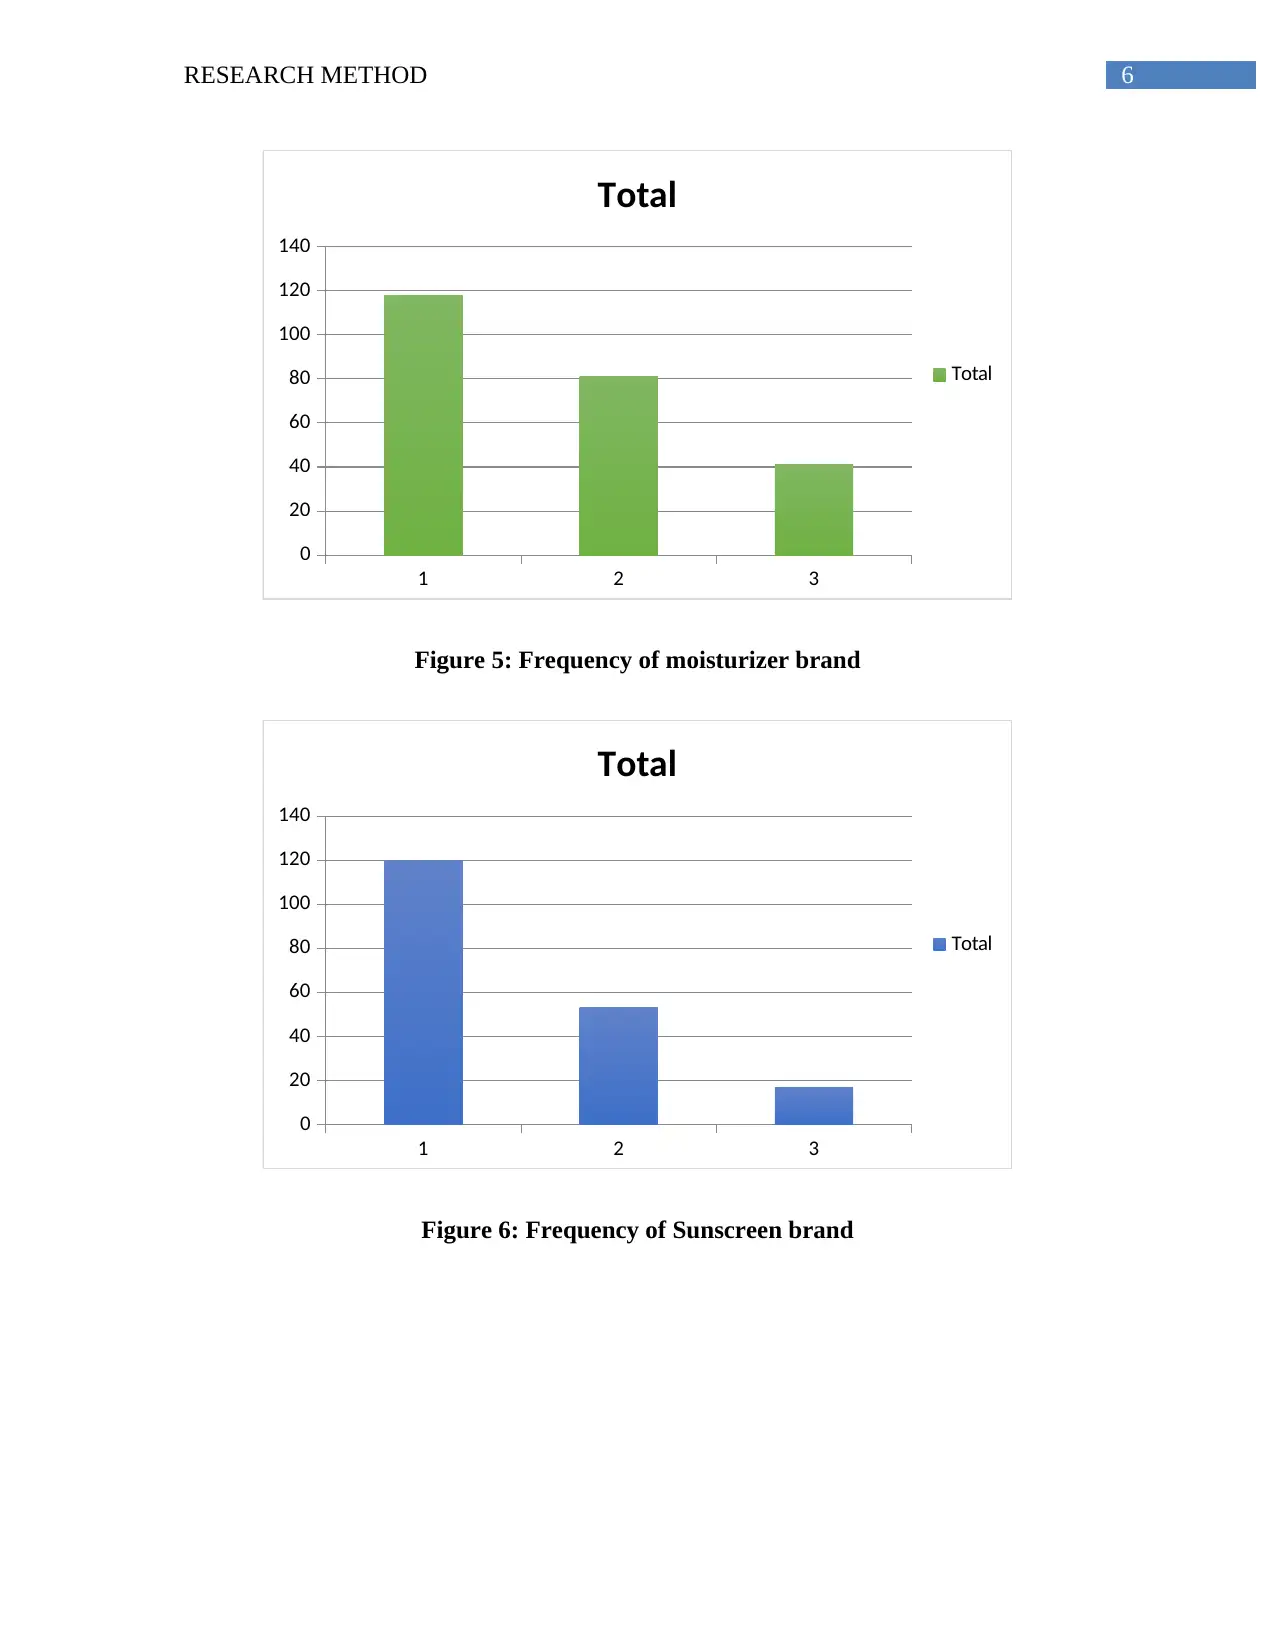
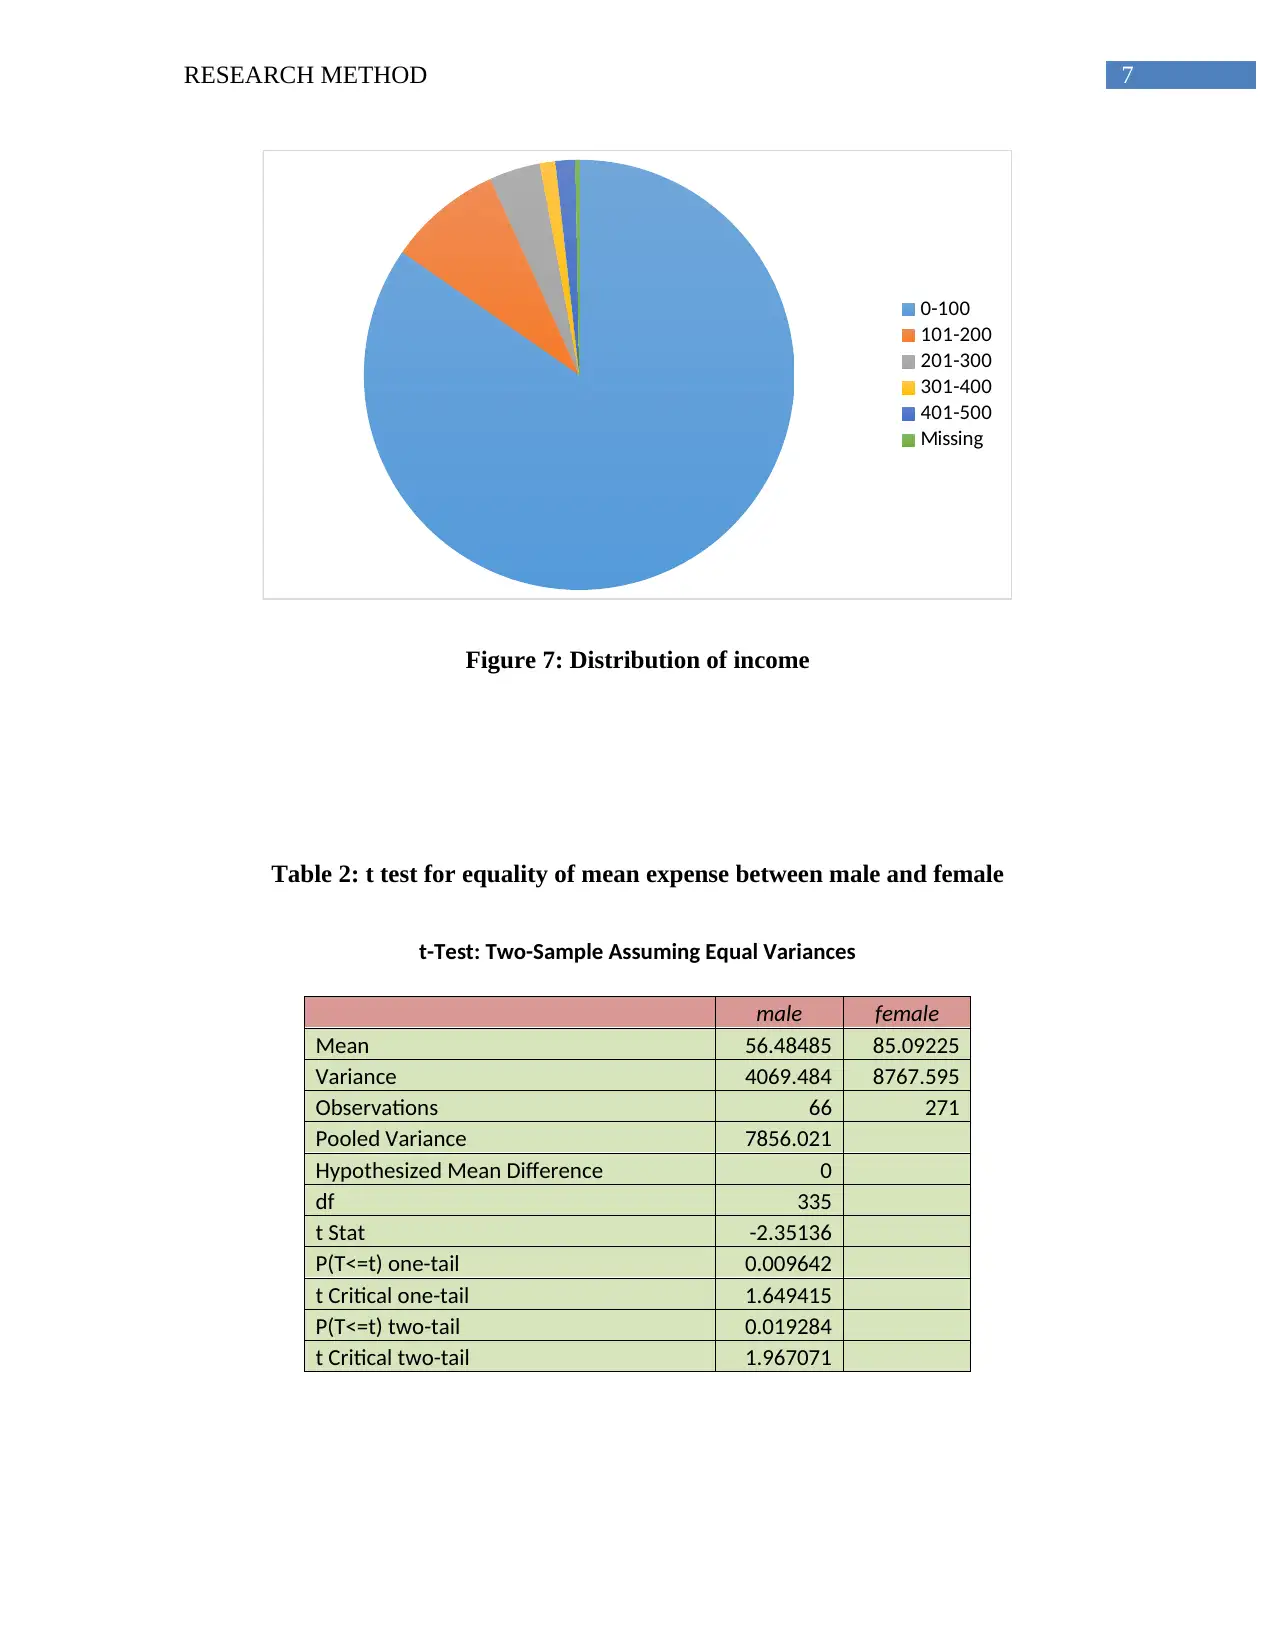
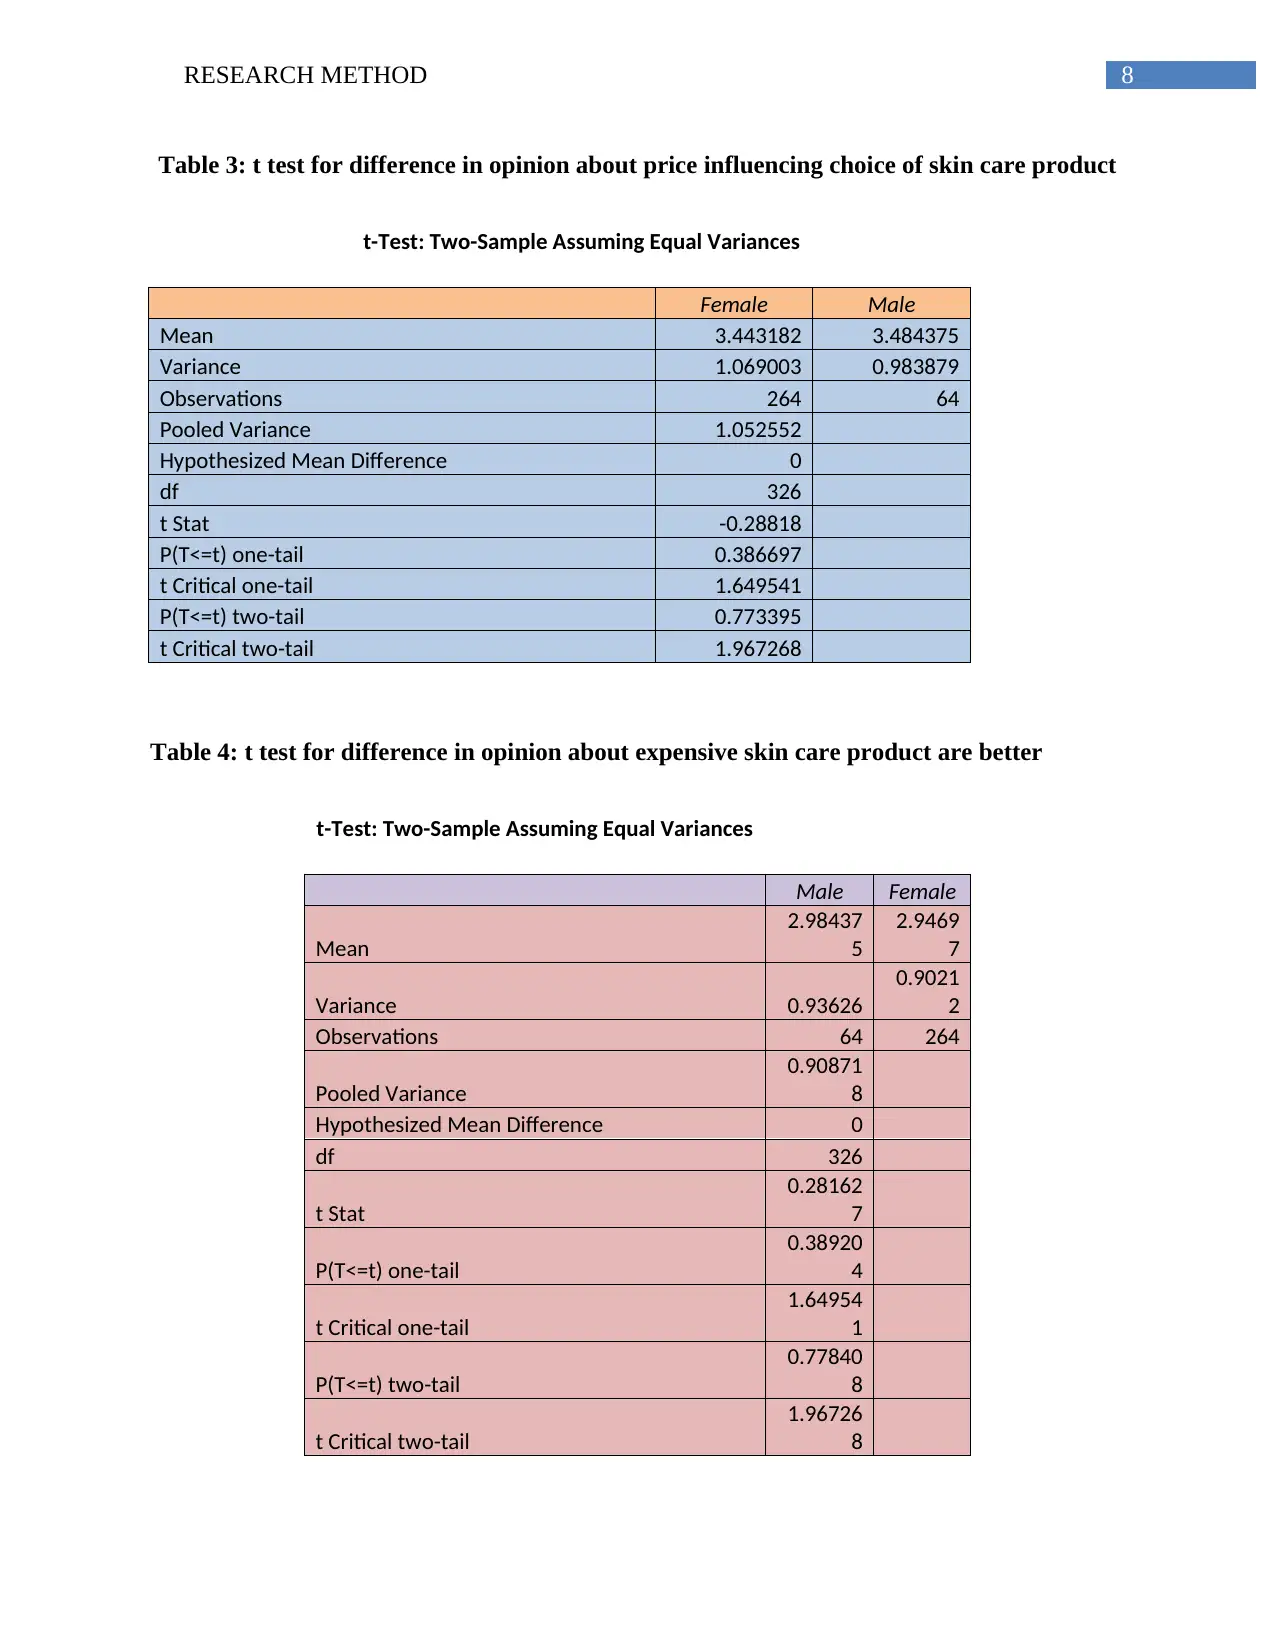
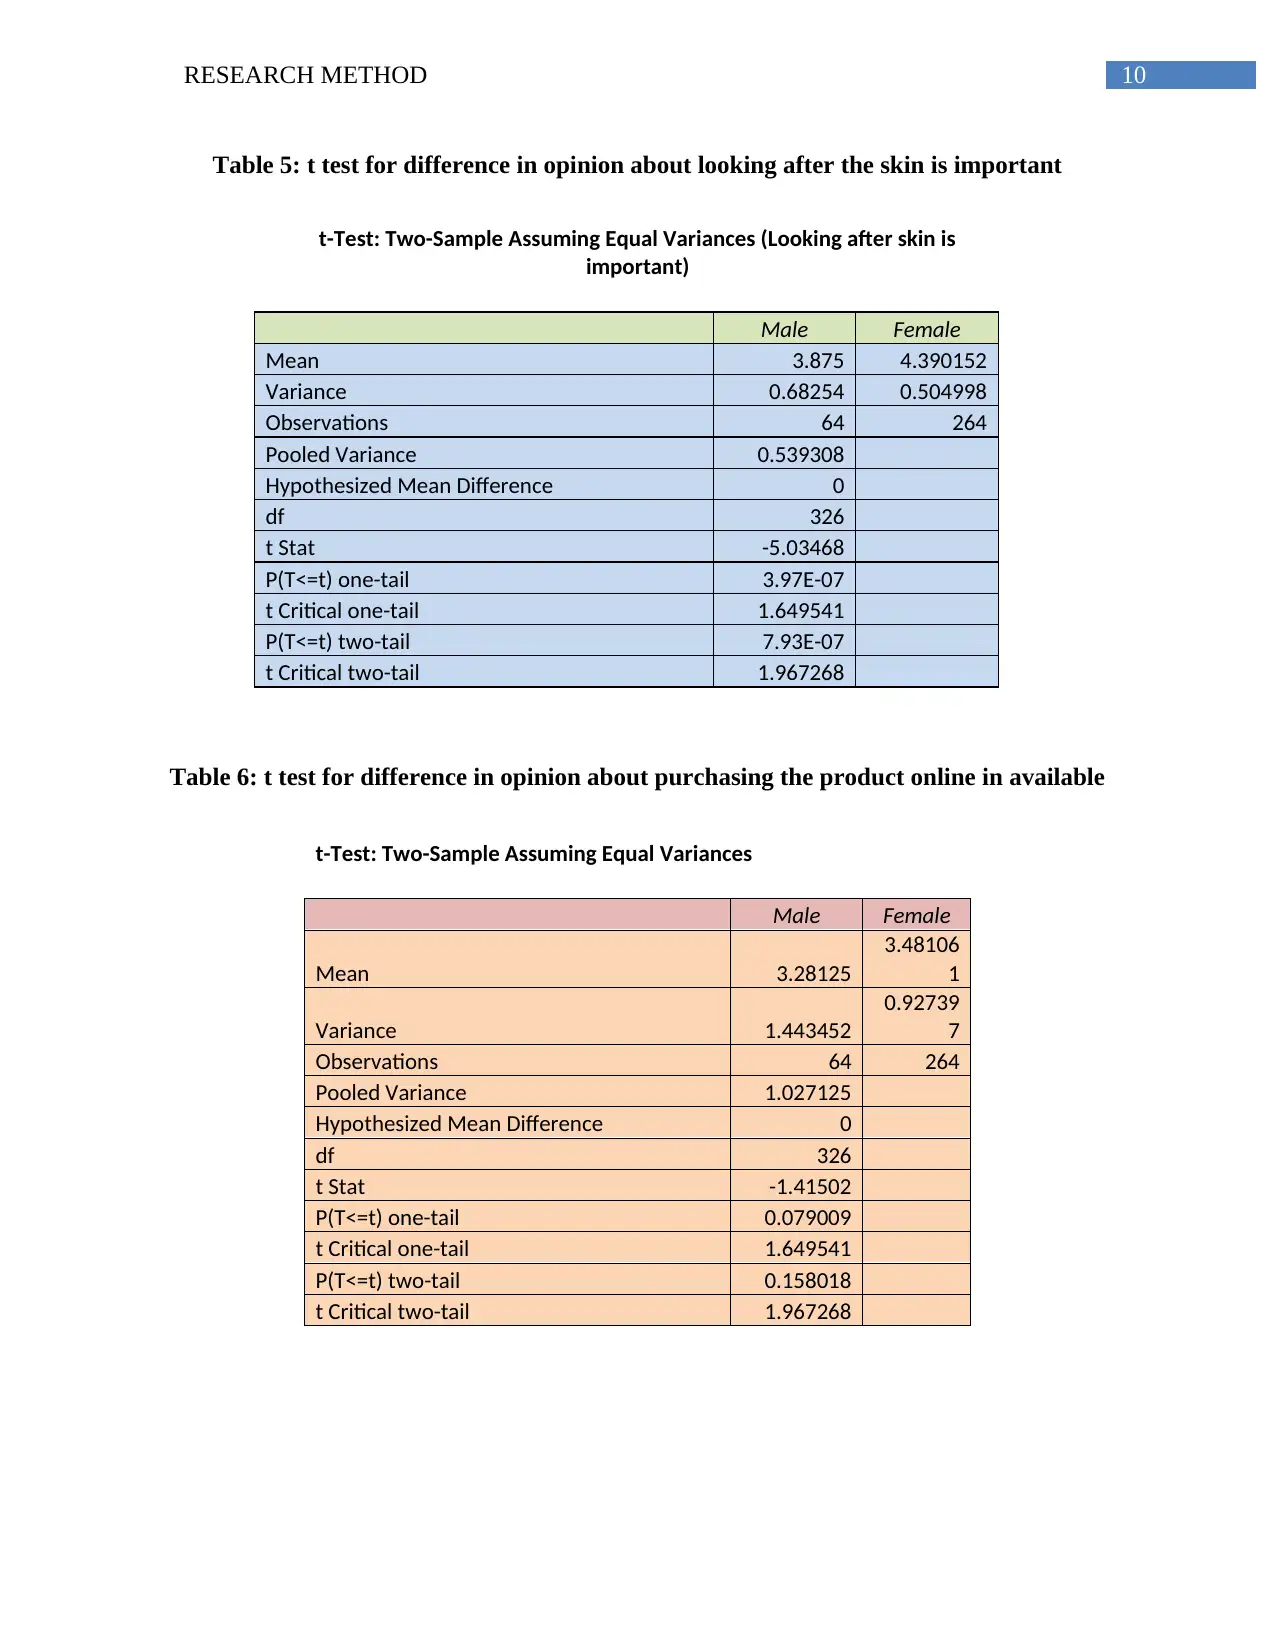
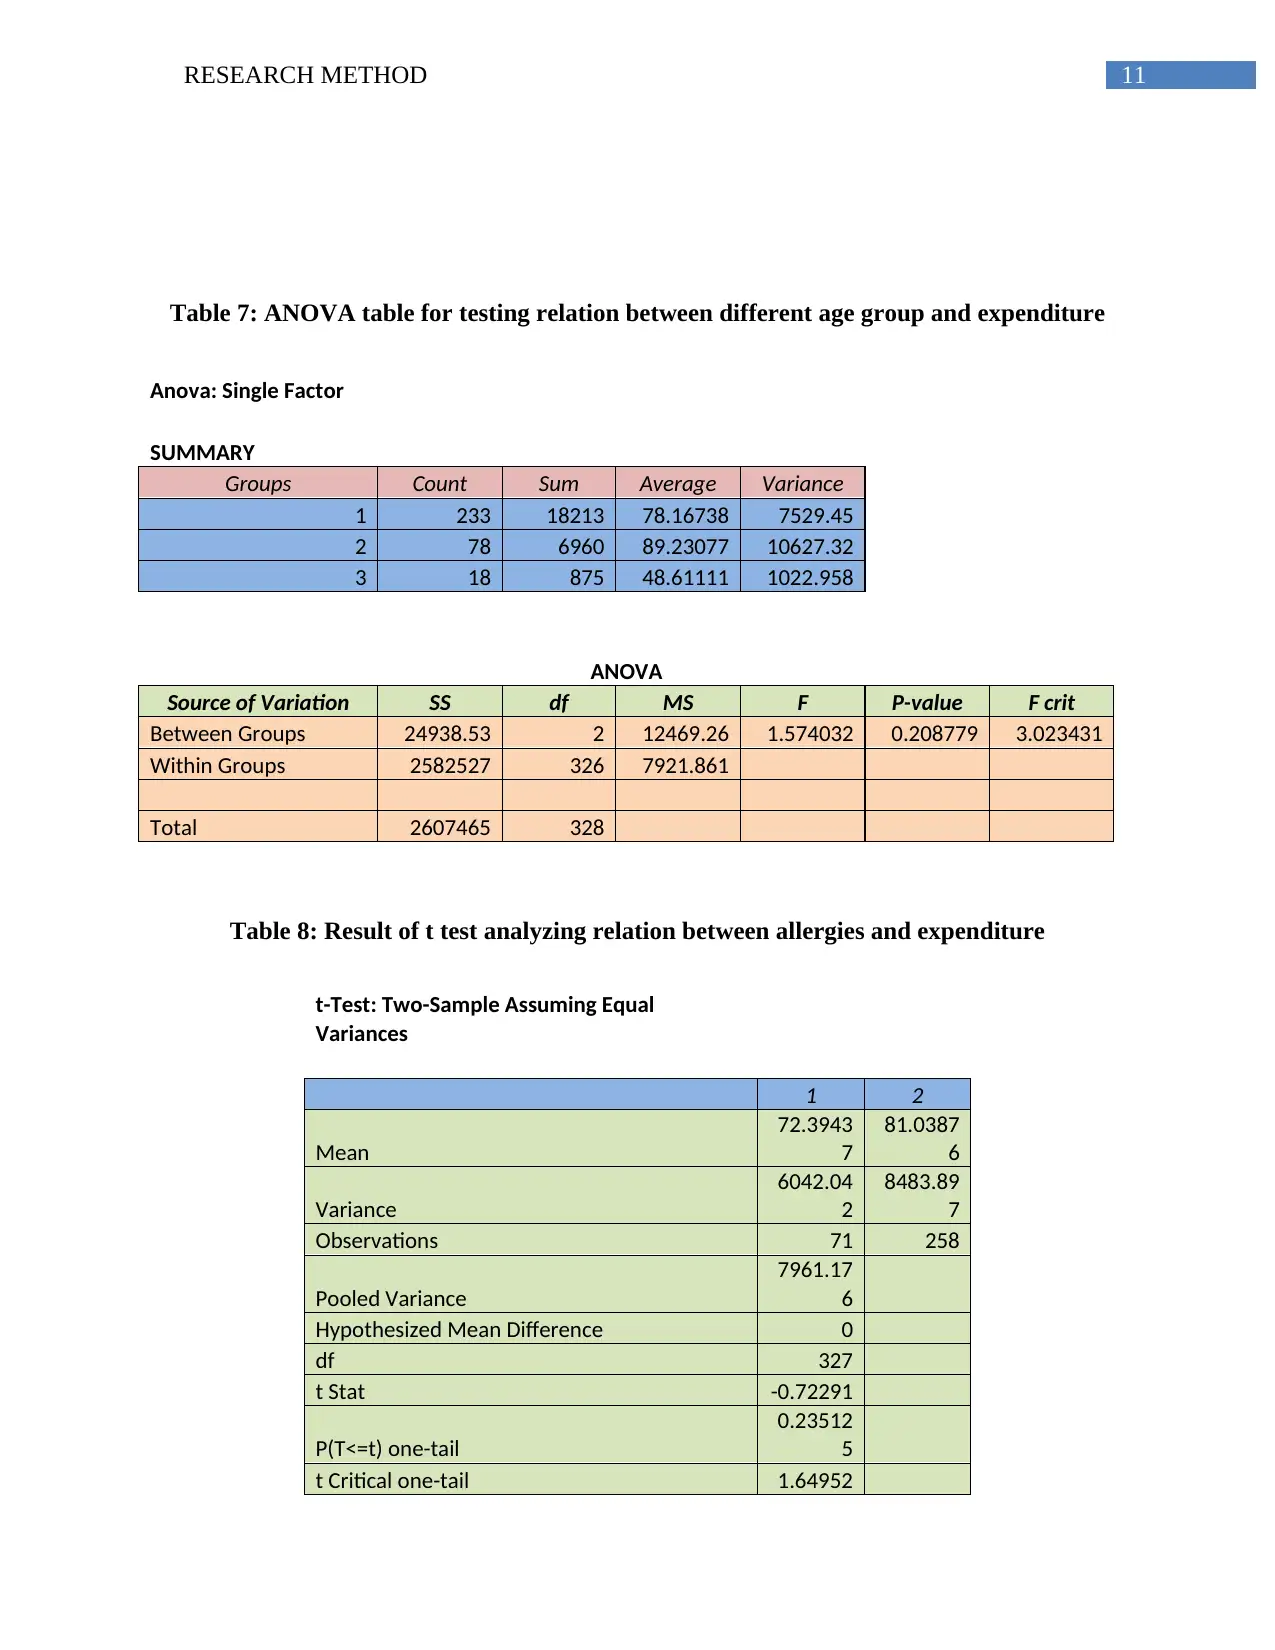
This report presents a comprehensive analysis of the factors influencing expenditure on skin care products. The research investigates the relationship between spending habits and variables such as gender, age, and the presence of allergies. Employing both quantitative and qualitative methodologies, the study utilizes t-tests and ANOVA to analyze data collected from a sample of 339 individuals, exploring the impact of various skincare product brands (cleansers, exfoliates, moisturizers, and sunscreens) and their associated costs. The quantitative analysis includes descriptive statistics, t-tests comparing spending and opinions across genders and age groups, and an ANOVA to assess expenditure differences between age groups. Qualitative data from interviews supplements the quantitative findings, examining factors beyond price that influence purchasing decisions, such as product reviews, financial status, and the importance of skincare routines. The results indicate that females tend to spend more on skincare products, while age does not significantly influence spending. The report also explores opinions on product prices and the impact of allergies on spending habits. The findings offer insights into consumer behavior and preferences within the skincare market.
Document Page
Running head: REASEARCH METHOD
Research Method
Name of the Student
Name of the University
Author note
tabler-icon-diamond-filled.svg

Paraphrase This Document

Need a fresh take? Get an instant paraphrase of this document with our AI Paraphraser
Document Page
1RESEARCH METHOD
Table of Contents
Introduction......................................................................................................................................2
Result from Quantitative analysis....................................................................................................3
Result from Qualitative analysis....................................................................................................11
Discussion......................................................................................................................................12
Appendix........................................................................................................................................14
Document Page
2RESEARCH METHOD
Introduction
The report aims to analyze relation between the expenses on different skin care product
and factors such as age of people, their gender and other related factors. Various skin care
product such as cleanser, exfoliate product, sunscreen, moisture are considered. It is generally
asserts that females are likely to spend more on skin care product than their male counterpart.
From this the hypothesis drawn is as follows
Hypothesis 1
Null Hypothesis: There is no significant difference between average expenditure on skin care
product between males and females.
Alternative Hypothesis: The mean expenditure of females on skin care product is greater than
that of expenditure made by males.
The opinion about skin care product and expenses of the product may vary between genders. To
test this assertion following hypothesis testing is performed.
Hypothesis 2
Null hypothesis: There is no significant difference in opinion between male and females
Alternative hypothesis: There is significant difference in opinion depending on gender.
With growing age people are more prone to different skin diseases and this likely to be
increasing their expenditure on skin care expenses. The two relevant hypothesis tested here is the
following.
Document Page
3RESEARCH METHOD
Hypothesis 3
Null Hypothesis: There is no significant difference in the expenditure in different age groups
Alternative Hypothesis: The expenditure on skin care product differs significantly among
different age group.
The final hypothesis is derived to test whether presence of allergies have limited the spending on
certain types skin care product.
Hypothesis 4
Null Hypothesis: There is no significant difference in expenditure between groups having
allergies and do not.
Alternative Hypothesis: There is significant difference in expenditure on skin care product.
Result from Quantitative analysis
Table 1: Descriptive Statistics of age
Age
Mean
30.7805
6
Standard Error
0.64112
8
Median 26.5
Mode 22
Standard
Deviation
11.7869
9
Sample Variance
138.933
2
Kurtosis
0.29481
5
Skewness
1.06980
2
Range 55
tabler-icon-diamond-filled.svg

Paraphrase This Document

Need a fresh take? Get an instant paraphrase of this document with our AI Paraphraser
Document Page
4RESEARCH METHOD
Minimum 18
Maximum 73
Sum
10403.8
3
Count 338
1 2
0
50
100
150
200
250
300
Total
Total
Figure 1: Proportion of male and female population
71%
24%
5%
Total
1
2
3
Document Page
5RESEARCH METHOD
Figure 2: Distribution of population in different age group
1 2 3
0
20
40
60
80
100
120
140
Total
Total
Figure 3: Frequency of cleaner brand
1 2 3
0
10
20
30
40
50
60
70
Total
Total
Figure 4: Frequency of exfoliate brand
Document Page
6RESEARCH METHOD
1 2 3
0
20
40
60
80
100
120
140
Total
Total
Figure 5: Frequency of moisturizer brand
1 2 3
0
20
40
60
80
100
120
140
Total
Total
Figure 6: Frequency of Sunscreen brand
tabler-icon-diamond-filled.svg

Paraphrase This Document

Need a fresh take? Get an instant paraphrase of this document with our AI Paraphraser
Document Page
7RESEARCH METHOD
0-100
101-200
201-300
301-400
401-500
Missing
Figure 7: Distribution of income
Table 2: t test for equality of mean expense between male and female
t-Test: Two-Sample Assuming Equal Variances
male female
Mean 56.48485 85.09225
Variance 4069.484 8767.595
Observations 66 271
Pooled Variance 7856.021
Hypothesized Mean Difference 0
df 335
t Stat -2.35136
P(T<=t) one-tail 0.009642
t Critical one-tail 1.649415
P(T<=t) two-tail 0.019284
t Critical two-tail 1.967071
Document Page
8RESEARCH METHOD
Table 3: t test for difference in opinion about price influencing choice of skin care product
t-Test: Two-Sample Assuming Equal Variances
Female Male
Mean 3.443182 3.484375
Variance 1.069003 0.983879
Observations 264 64
Pooled Variance 1.052552
Hypothesized Mean Difference 0
df 326
t Stat -0.28818
P(T<=t) one-tail 0.386697
t Critical one-tail 1.649541
P(T<=t) two-tail 0.773395
t Critical two-tail 1.967268
Table 4: t test for difference in opinion about expensive skin care product are better
t-Test: Two-Sample Assuming Equal Variances
Male Female
Mean
2.98437
5
2.9469
7
Variance 0.93626
0.9021
2
Observations 64 264
Pooled Variance
0.90871
8
Hypothesized Mean Difference 0
df 326
t Stat
0.28162
7
P(T<=t) one-tail
0.38920
4
t Critical one-tail
1.64954
1
P(T<=t) two-tail
0.77840
8
t Critical two-tail
1.96726
8
Document Page
9RESEARCH METHOD
tabler-icon-diamond-filled.svg

Paraphrase This Document

Need a fresh take? Get an instant paraphrase of this document with our AI Paraphraser
Document Page
10RESEARCH METHOD
Table 5: t test for difference in opinion about looking after the skin is important
t-Test: Two-Sample Assuming Equal Variances (Looking after skin is
important)
Male Female
Mean 3.875 4.390152
Variance 0.68254 0.504998
Observations 64 264
Pooled Variance 0.539308
Hypothesized Mean Difference 0
df 326
t Stat -5.03468
P(T<=t) one-tail 3.97E-07
t Critical one-tail 1.649541
P(T<=t) two-tail 7.93E-07
t Critical two-tail 1.967268
Table 6: t test for difference in opinion about purchasing the product online in available
t-Test: Two-Sample Assuming Equal Variances
Male Female
Mean 3.28125
3.48106
1
Variance 1.443452
0.92739
7
Observations 64 264
Pooled Variance 1.027125
Hypothesized Mean Difference 0
df 326
t Stat -1.41502
P(T<=t) one-tail 0.079009
t Critical one-tail 1.649541
P(T<=t) two-tail 0.158018
t Critical two-tail 1.967268
Document Page
11RESEARCH METHOD
Table 7: ANOVA table for testing relation between different age group and expenditure
Anova: Single Factor
SUMMARY
Groups Count Sum Average Variance
1 233 18213 78.16738 7529.45
2 78 6960 89.23077 10627.32
3 18 875 48.61111 1022.958
ANOVA
Source of Variation SS df MS F P-value F crit
Between Groups 24938.53 2 12469.26 1.574032 0.208779 3.023431
Within Groups 2582527 326 7921.861
Total 2607465 328
Table 8: Result of t test analyzing relation between allergies and expenditure
t-Test: Two-Sample Assuming Equal
Variances
1 2
Mean
72.3943
7
81.0387
6
Variance
6042.04
2
8483.89
7
Observations 71 258
Pooled Variance
7961.17
6
Hypothesized Mean Difference 0
df 327
t Stat -0.72291
P(T<=t) one-tail
0.23512
5
t Critical one-tail 1.64952
chevron_up_icon
1 out of 19
circle_padding
hide_on_mobile
zoom_out_icon