Comprehensive Financial Analysis of Sky Network Television Ltd
VerifiedAdded on 2023/06/12
|12
|2731
|207
Report
AI Summary
This report presents a financial analysis of Sky Network Television Limited, an Australian publicly listed company, utilizing financial statements from the last two years. It involves a detailed ratio analysis, covering current ratio, gross profit margin, return on equity, asset turnover ratio, and debt to equity ratio, to assess the company's liquidity, profitability, efficiency, and solvency. The report defines and interprets each ratio, explaining its implications for Sky Network Television Ltd's financial health. Furthermore, it compares Sky Network Television Ltd's performance with Netflix Inc, a competitor in the same industry, highlighting key differences and relative strengths. The analysis reveals that Sky Network Television Ltd has faced financial challenges in recent years, indicated by decreasing profitability and efficiency ratios, while also demonstrating a preference for equity financing over debt. Despite these challenges, the report concludes that Sky Network Television Ltd could be a viable investment opportunity if certain financial issues are addressed.
Financial Analysis of Sky Network Television Limited i
FINANCIAL ANALYSIS OF SKY NETWORK TELEVISION LIMITED
Student ID
Course Title
Professor
Date
FINANCIAL ANALYSIS OF SKY NETWORK TELEVISION LIMITED
Student ID
Course Title
Professor
Date
Paraphrase This Document
Need a fresh take? Get an instant paraphrase of this document with our AI Paraphraser
Financial Analysis of Sky Network Television Limited ii
Executive Summary
The purpose of this paper is to prepare a report regarding one of the Australian publicly listed
firms. This entails analysis of its financial statement over the last two years. This report
provides direct comparison between Sky Network and its competitor. From the analysis, Sky
Network Television Ltd has been experiencing some financial hitches in the last two years.
This is evident by decreasing trend in its profitability, liquidity, solvency and efficiency
ratios. In essence, it is clear that if some issues are resolved, Sky Network Television stands
as a viable investment opportunity for potential investor. It is clear that Sky Network
Television Ltd has been experiencing some financial hitches in the last two years. This is
evident by decreasing trend in its profitability, liquidity, solvency and efficiency ratios. For
instance, the company gross profit margin and its return on equity decreased over the two
years, indicating a decrease in its financial performance or position over the two years. In
essence, it is clear that if some issues are resolved, Sky Network Television stands as a viable
investment opportunity for potential investors. Basically, based on Sky Network Television
Limited asset turnover ratio, it is evident that its management is not efficient enough in using
its assets in generating the required amount of sales. Moreover, Based current ratio analysis,
Sky Network Television network seems to be experiencing some difficulties while settling its
short-term debt commitments. This is due to the fact that its current ratio for the last two
years was significantly below 1 which is not an attractive ratio for any company. It can also
be concluded that the company is financially weak in terms of profitability and given that its
profitability ratios decreased over the last two years. Such call for appropriate measures by
the management in ensuring that the management is doing the best means possible in making
sure that all assets are utilized appropriately.
Financial Analysis of Sky Network Television Limited 1
Table of Contents
Executive Summary...............................................................................................................................ii
1.0 Introduction...............................................................................................................................2
1.1 Purpose..................................................................................................................................2
1.2 Scope.....................................................................................................................................2
1.3 Limitation..............................................................................................................................2
2.0 Company Overview.........................................................................................................................2
3.0 Ratio Analysis...........................................................................................................................3
3.1 Current Ratio...............................................................................................................................3
3.2 Gross profit margin......................................................................................................................4
3.3 Return on Equity..........................................................................................................................4
3.4 Asset turnover ratio.....................................................................................................................4
3.5 Debt to equity ratio.....................................................................................................................5
4.0 Analysis and Comparison of Sky Network Television Ltd with Netflix Inc..............................5
5.0 Conclusion.......................................................................................................................................6
References.............................................................................................................................................8
⊘ This is a preview!⊘
Do you want full access?
Subscribe today to unlock all pages.
Trusted by 1+ million students worldwide
Financial Analysis of Sky Network Television Limited 2
1.0 Introduction
1.1 Purpose
The purpose of this paper is to prepare a report regarding one of the Australian publicly listed
firms. This requires analysis of its financial statement over the last two years. It also aims to
conduct financial ratio analysis of the company as well as a comparison with another firm in
the same industry. Basically, the report provides direct comparison between Sky Network and
its competitor.
1.2 Scope
The scope of this report is to assess financial performance and health of the company. This
would assist in providing recommendation to potential investors as to whether the company
offer viable investment opportunity to them. The analysis would provide potential investors
and shareholders better comprehension of the organization’s financial performance and
condition than what they could have accessed through perusal of the financial statements.
Basically, the report aims to provide clear understand to potential investors of the company
financial performance and status in media industry.
1.3 Limitation
Some of the limitations of using the five ratios in analysing the company financial position
include seasonal factors which could distort the analysis. Furthermore, ratio analysis could
distort comparison due to different account practices. Further, different organization are said
to operate differentiated divisions in numerous sector. This makes it hectic in establishing
meaningful set of the sector-average ratios.
Paraphrase This Document
Need a fresh take? Get an instant paraphrase of this document with our AI Paraphraser
Financial Analysis of Sky Network Television Limited 3
2.0 Company Overview
Sky Network Television Ltd is multinational firm offering multi-channel, free-to-air and pay
television services within New Zealand (Reuters 2018). The firm broadcasts around 100
channels on the digital satellite platform comprising basic package of around 58 channels
including family programs, news, radio stations, premium channels including 6 movies
channels, 5 sport channels, games channels as well as Rugby channel and general
entertainment (The Wall street Journal 2018). The company also offers various videos on
demand for MY SKY HDI and MY SKY clients. Additionally, the firm is involved in sale of
the advertising time on around 26 of its main channels as well as online DVD rental. It also
distributes the analogue TV channels to its subscribers through its four UHF frequencies
(Market Watch 2018).
3.0 Ratio Analysis
Ratio analysis is considered as the quantitative analysis of the financial information contained
in the organization’s financial report. It is used in analysing numerous aspect of an
organization’s operating as well as financial status like liquidity, solvency, efficiency as well
as profitability. Besides, ratio analysis is use in comparing an organization’s financial
position and status with its competitor or industry overage.
3.1 Current Ratio
This is the form of the liquidity ratio used in measuring an organization’s capacity in settling
its short-run obligations using its short-term or current assets (Cinca, Molinero & Larraz
2005). The ratio provides a rough idea of the firm’s capacity in settling its current liabilities
with current assets. It compares total current assets to the total current liabilities within an
organization to see whether an organization has sufficient cash in settling its most immediate
debts. The ratio can be computed as follows;
Current ratio = current assets/current liabilities
Financial Analysis of Sky Network Television Limited 4
2016 =175.64 /417.47 = 0.42
2017 = 154.1/217 = 0.71
Based on the above calculations, it is evident that the company has been experiencing some
difficulties while settling its short-term debt commitments. This is due to the fact that its
current ratio for the last two years was significantly below 1 which is not an attractive ratio
for any company (Cinca, Molinero & Larraz 2005). The ratios for the past two years were
low meaning that the firm had less current assets in comparison to its current liabilities over
this period.
3.2 Gross profit margin
The ratio helps in measuring proportion of the total income or earnings that are generated by
total revenue before sales and administrative costs are included (Pech, Noguera & White,
2015). In other words, it is used in measuring an entity’s financial health as well as business
model by indicating proportion of income left from sales after deducting COGS. The ratio is
computed as follows;
Gross margin = gross profit/sales
2016 = 306.48/928.2 = 33.02%
2017 = 236.93/875.4 = 27.07%
Basically, from the above calculations, it is evident that the company performance in terms of
earnings generation decreased in 2017 in comparison to 2016. This could have been
contributed by decrease in the company total revenue in the same period (Cinca, Molinero &
Larraz 2005). The figures indicates that the company has less than 50% of its sales left after
settling all the costs linked with its sales.
3.3 Return on Equity
This ratio assists in measuring amount of income that is generated by shareholders’ equity. It
is computed by dividing net income by shareholders’ equity (Gadoiu 2014). In other words,
⊘ This is a preview!⊘
Do you want full access?
Subscribe today to unlock all pages.
Trusted by 1+ million students worldwide
Financial Analysis of Sky Network Television Limited 5
it measures an organization’s profitability by indicating how much income an entity generate
with shareholders’ money.
ROE = net income/shareholders’ equity
2016 = 146.72/1330 = 11.03%
2017 = 116.03/1330= 8.74%
From the above computations, it is evident that the company ROE decreased from 11.03% in
2016 to 8.74% in 2017. The decrease is a clear sign that the company has not been so
efficient in utilizing its shareholder’s equity to generate profit (Cinca, Molinero & Larraz
2005). Besides, it is evident from the decreasing and relatively low ROE that the company
management is not using its shareholders’ finances effectively.
3.4 Asset turnover ratio
The ratio assists in measuring how efficiently an organization generates revenue or sales on
every asset. Here, an increasing ratio shows that an organization it utilizing its assets more
appropriate (Pervan & Kuvek, 2013). In other words, asset turnover helps in measuring
capacity of an organization in generating revenue from assets through comparison of the total
revenue with total assets. The ratio is therefore computed through the following equitation;
Asset turnover = sales/ total assets
2016 = 928.2/1940 = 0.48
2017 = 875.4/1890 = 0.46
As from the computation above, it is evident that the company is experiencing decreasing
asset turnover ratio over the past two years. The decrease is a clear indication that the
company is not utilizing its assets in the most appropriate manner to generate sales (Gadoiu
2014). In other words, given that for the past two years the asset turnover was below one, it is
clear that the firm was inefficient or there was some management issues during this time.
3.5 Debt to equity ratio
Paraphrase This Document
Need a fresh take? Get an instant paraphrase of this document with our AI Paraphraser
Financial Analysis of Sky Network Television Limited 6
This ratio compares proportion of the total liabilities to the shareholders’ equity to assess
whether an organization prefer either equity finance over debt finance (Arkan 2016). In other
words, it shows how much debts are being used by an entity in financing its operations
relative to shareholders’ equity. It is the measure of an organization’s future debt obligations
on the statement of financial position relative to the equity. It is computed using the following
equation;
Debt to equity = total liabilities/total equity
2016 = 612.64/1330 = 0.46
2017 = 559.32/1330 = 0.42
Based on the above computations, it is evident that for the past two years, Sky Network
Television Ltd preferred equity financing over debt financing. This is evident by relatively
low debt to equity ratio below one. Such is a good indication that the company was
financially healthy over these two years (Arkan 2016). In other words, the low ratio is a clear
sign that the firm has been less aggressive in financing its operations with debts.
4.0 Analysis and Comparison of Sky Network Television Ltd with Netflix Inc
Based on Table 1 below, it is evident that Sky Network Television Ltd current ratio was
slightly higher in comparison to that one of Netflix Inc. Nonetheless, its debt to equity is
slightly lower than Netflix Inc. From these comparisons, it is evident that both companies
have been experiencing some difficulties in settling their short-term debt commitments,
however, Sky Network Television Ltd seems to be doing relatively better in settling its debts
compared to its counterpart. Further, Sky Network Television Ltd debt to equity ratio in 2017
was relatively lower than Netflix Inc. This implies that Sky Network Television was using
depending on equity financing over debt financing in comparison to Netflix Inc which seem
to have been relying on debt finance over equity finance. Additionally, gross margin ratios
for Sky Network Television in 2017 were lower in comparison to Netflix Inc, implying that
Financial Analysis of Sky Network Television Limited 7
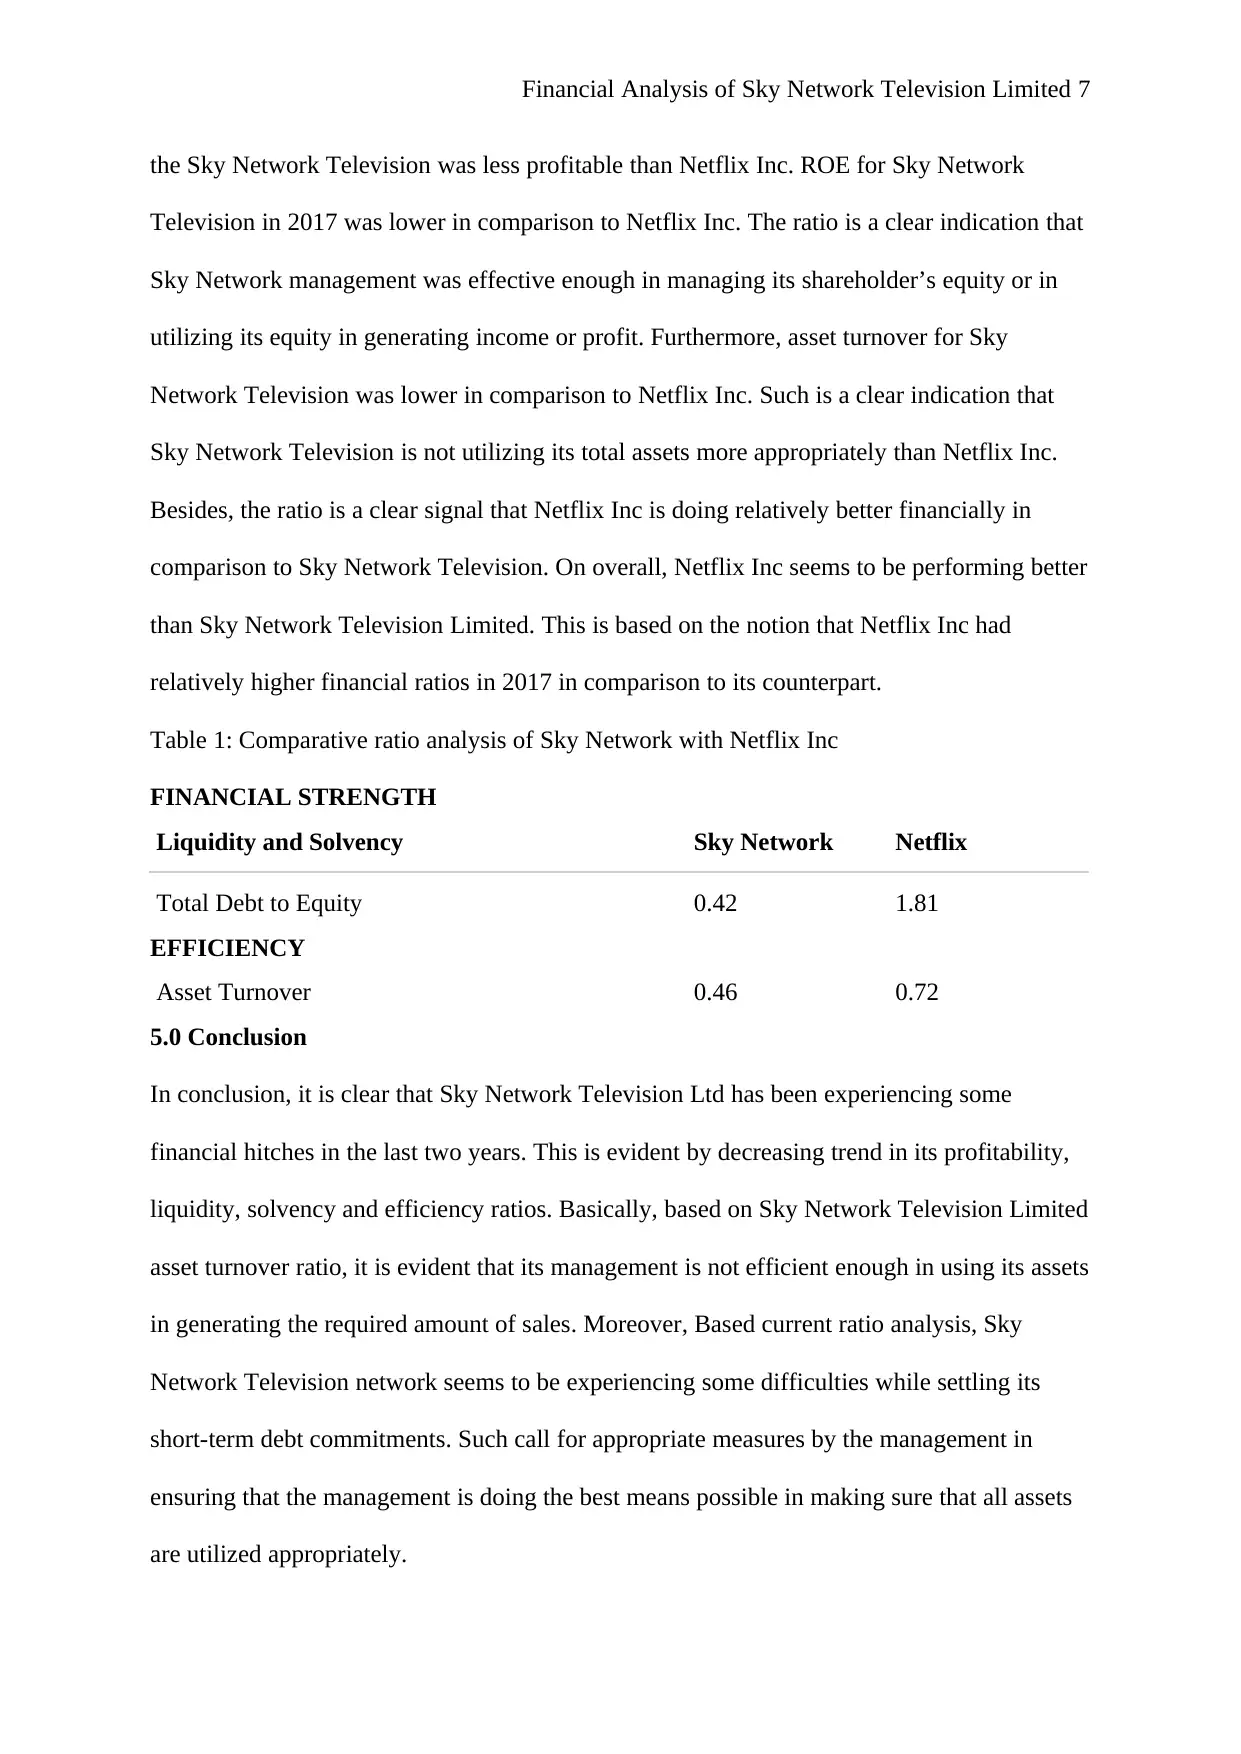
the Sky Network Television was less profitable than Netflix Inc. ROE for Sky Network
Television in 2017 was lower in comparison to Netflix Inc. The ratio is a clear indication that
Sky Network management was effective enough in managing its shareholder’s equity or in
utilizing its equity in generating income or profit. Furthermore, asset turnover for Sky
Network Television was lower in comparison to Netflix Inc. Such is a clear indication that
Sky Network Television is not utilizing its total assets more appropriately than Netflix Inc.
Besides, the ratio is a clear signal that Netflix Inc is doing relatively better financially in
comparison to Sky Network Television. On overall, Netflix Inc seems to be performing better
than Sky Network Television Limited. This is based on the notion that Netflix Inc had
relatively higher financial ratios in 2017 in comparison to its counterpart.
Table 1: Comparative ratio analysis of Sky Network with Netflix Inc
FINANCIAL STRENGTH
Liquidity and Solvency Sky Network Netflix
Total Debt to Equity 0.42 1.81
EFFICIENCY
Asset Turnover 0.46 0.72
5.0 Conclusion
In conclusion, it is clear that Sky Network Television Ltd has been experiencing some
financial hitches in the last two years. This is evident by decreasing trend in its profitability,
liquidity, solvency and efficiency ratios. Basically, based on Sky Network Television Limited
asset turnover ratio, it is evident that its management is not efficient enough in using its assets
in generating the required amount of sales. Moreover, Based current ratio analysis, Sky
Network Television network seems to be experiencing some difficulties while settling its
short-term debt commitments. Such call for appropriate measures by the management in
ensuring that the management is doing the best means possible in making sure that all assets
are utilized appropriately.
⊘ This is a preview!⊘
Do you want full access?
Subscribe today to unlock all pages.
Trusted by 1+ million students worldwide

Financial Analysis of Sky Network Television Limited 8
Paraphrase This Document
Need a fresh take? Get an instant paraphrase of this document with our AI Paraphraser
Financial Analysis of Sky Network Television Limited 9
References
The Wall street Journal (2018), Sky Network Television Limited; Viewed at 21st April 2018
from; http://quotes.wsj.com/AU/XASX/SKT/financials
Market Watch (2018), Sky Network Television Ltd; Viewed at 21st April 2018 from;
https://www.marketwatch.com/investing/stock/sykwf/profile
Reuters (2018), SKY Network Television Ltd (SKT.NZ); Viewed at 21st April 2018 from;
https://www.reuters.com/finance/stocks/financial-highlights/SKT.NZ
Arkan, T. (2016). The importance of financial ratios in predicting stock price trends: A case
study in emerging markets. Finanse. Rynki Finansowe, Ubezpieczenia, (1), 79.
Gadoiu, M. (2014). Advantages and limitations of the financial ratios used in the financial
diagnosis of the enterprise. Scientific Bulletin-Economic Sciences, 13(2), 87-95.
Pervan, I., & Kuvek, T. (2013). The relative importance of financial ratios and nonfinancial
variables in predicting of insolvency. Croatian Operational research review, 4(1), 187-197.
Delen, D., Kuzey, C., & Uyar, A. (2013). Measuring firm performance using financial ratios:
A decision tree approach. Expert Systems with Applications, 40(10), 3970-3983.
Pech, C. O. T., Noguera, M., & White, S. (2015). Financial ratios used by equity analysts in
Mexico and stock returns. Contaduría y Administración, 60(3), 578-592.
Cinca, C. S., Molinero, C. M., & Larraz, J. G. (2005). Country and size effects in financial
ratios: A European perspective. Global Finance Journal, 16(1), 26-47.

Financial Analysis of Sky Network Television Limited 10
Investing.com (2018), Netflix Inc; Viewed at 21st April 2018 from;
https://www.investing.com/equities/netflix,-inc.-ratios
Morningstar (2018), Netflix Inc; Viewed at 21st April 2018 from;
http://financials.morningstar.com/ratios/r.html?t=NFLX
Investing.com (2018), Netflix Inc; Viewed at 21st April 2018 from;
https://www.investing.com/equities/netflix,-inc.-ratios
Morningstar (2018), Netflix Inc; Viewed at 21st April 2018 from;
http://financials.morningstar.com/ratios/r.html?t=NFLX
⊘ This is a preview!⊘
Do you want full access?
Subscribe today to unlock all pages.
Trusted by 1+ million students worldwide
1 out of 12
Related Documents


Your All-in-One AI-Powered Toolkit for Academic Success.
+13062052269
info@desklib.com
Available 24*7 on WhatsApp / Email
![[object Object]](/_next/static/media/star-bottom.7253800d.svg)
Unlock your academic potential
Copyright © 2020–2026 A2Z Services. All Rights Reserved. Developed and managed by ZUCOL.