Analysis of Financial Capital for Sky Network Television Ltd
VerifiedAdded on  2021/06/17
|10
|1875
|88
Report
AI Summary
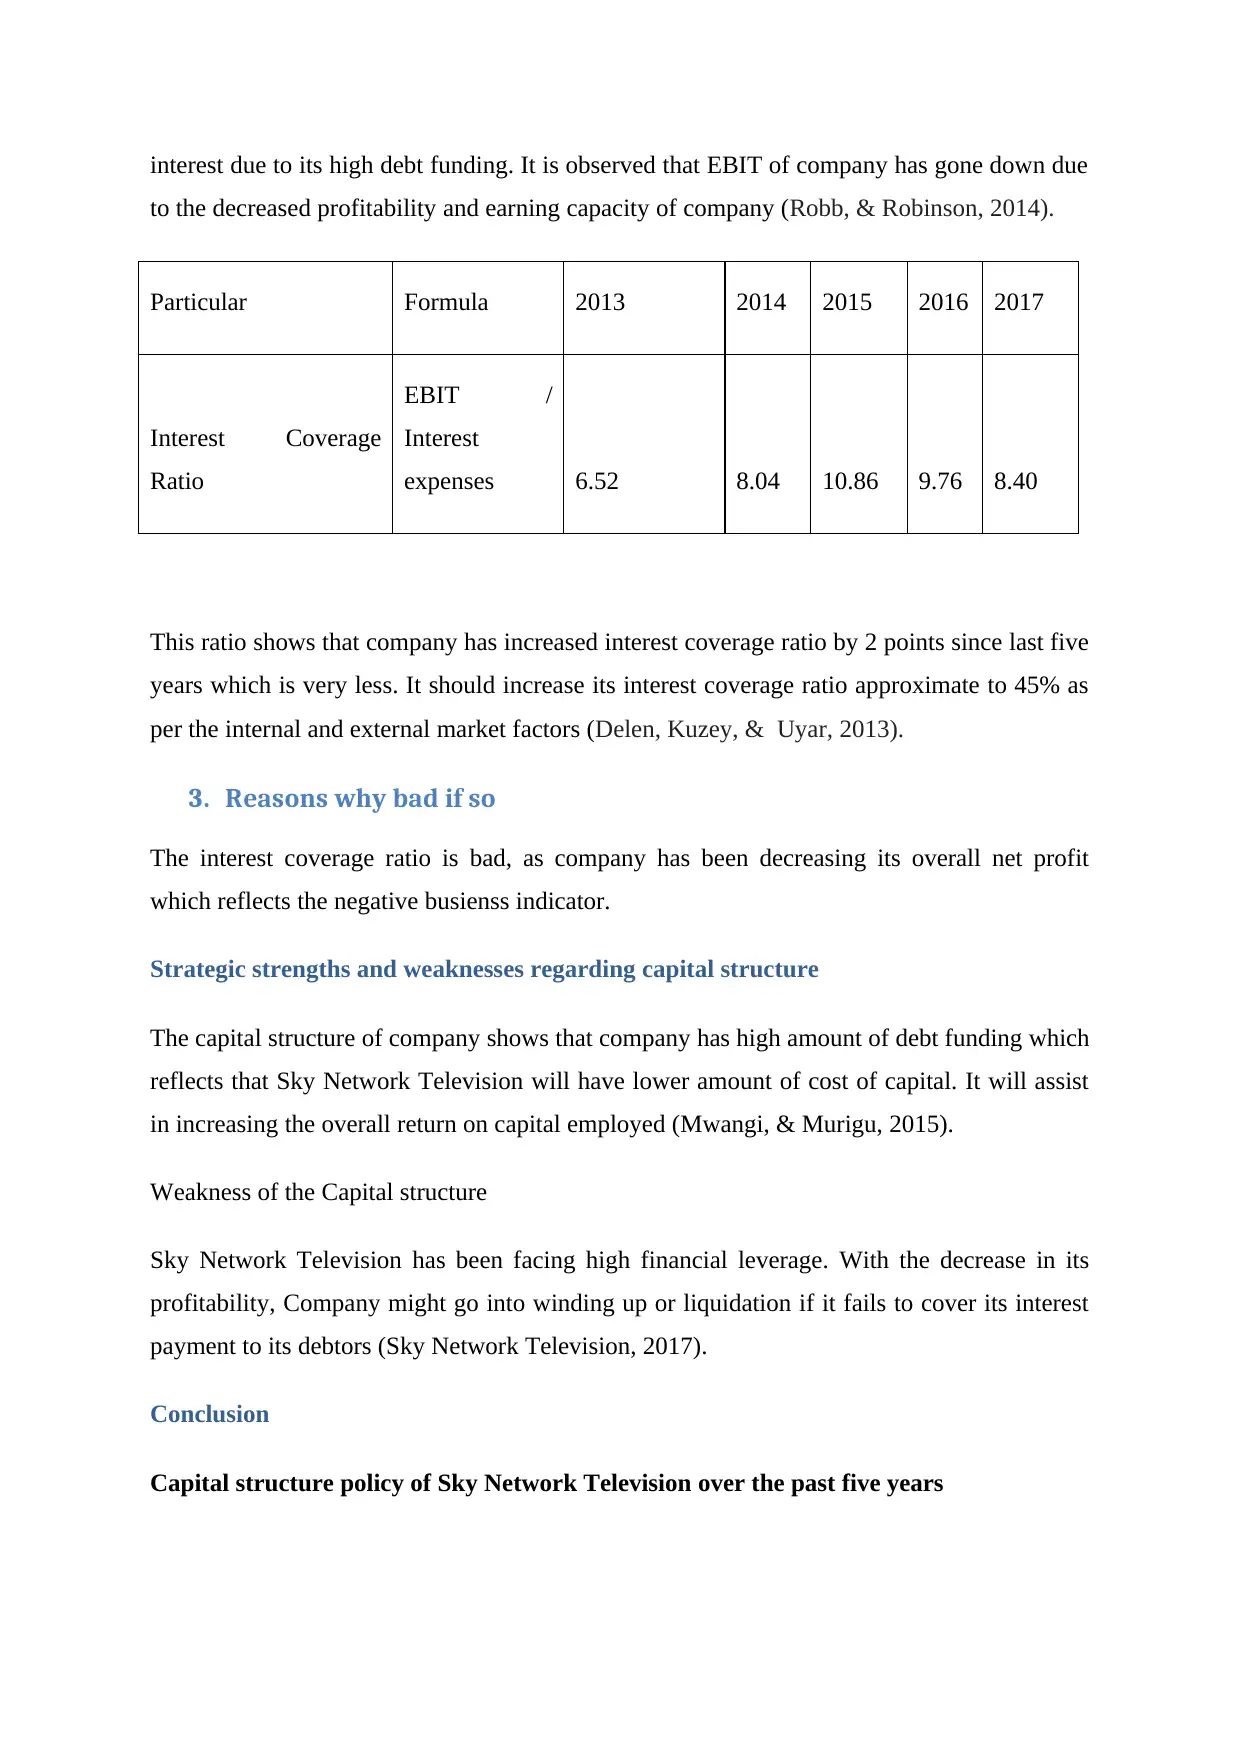
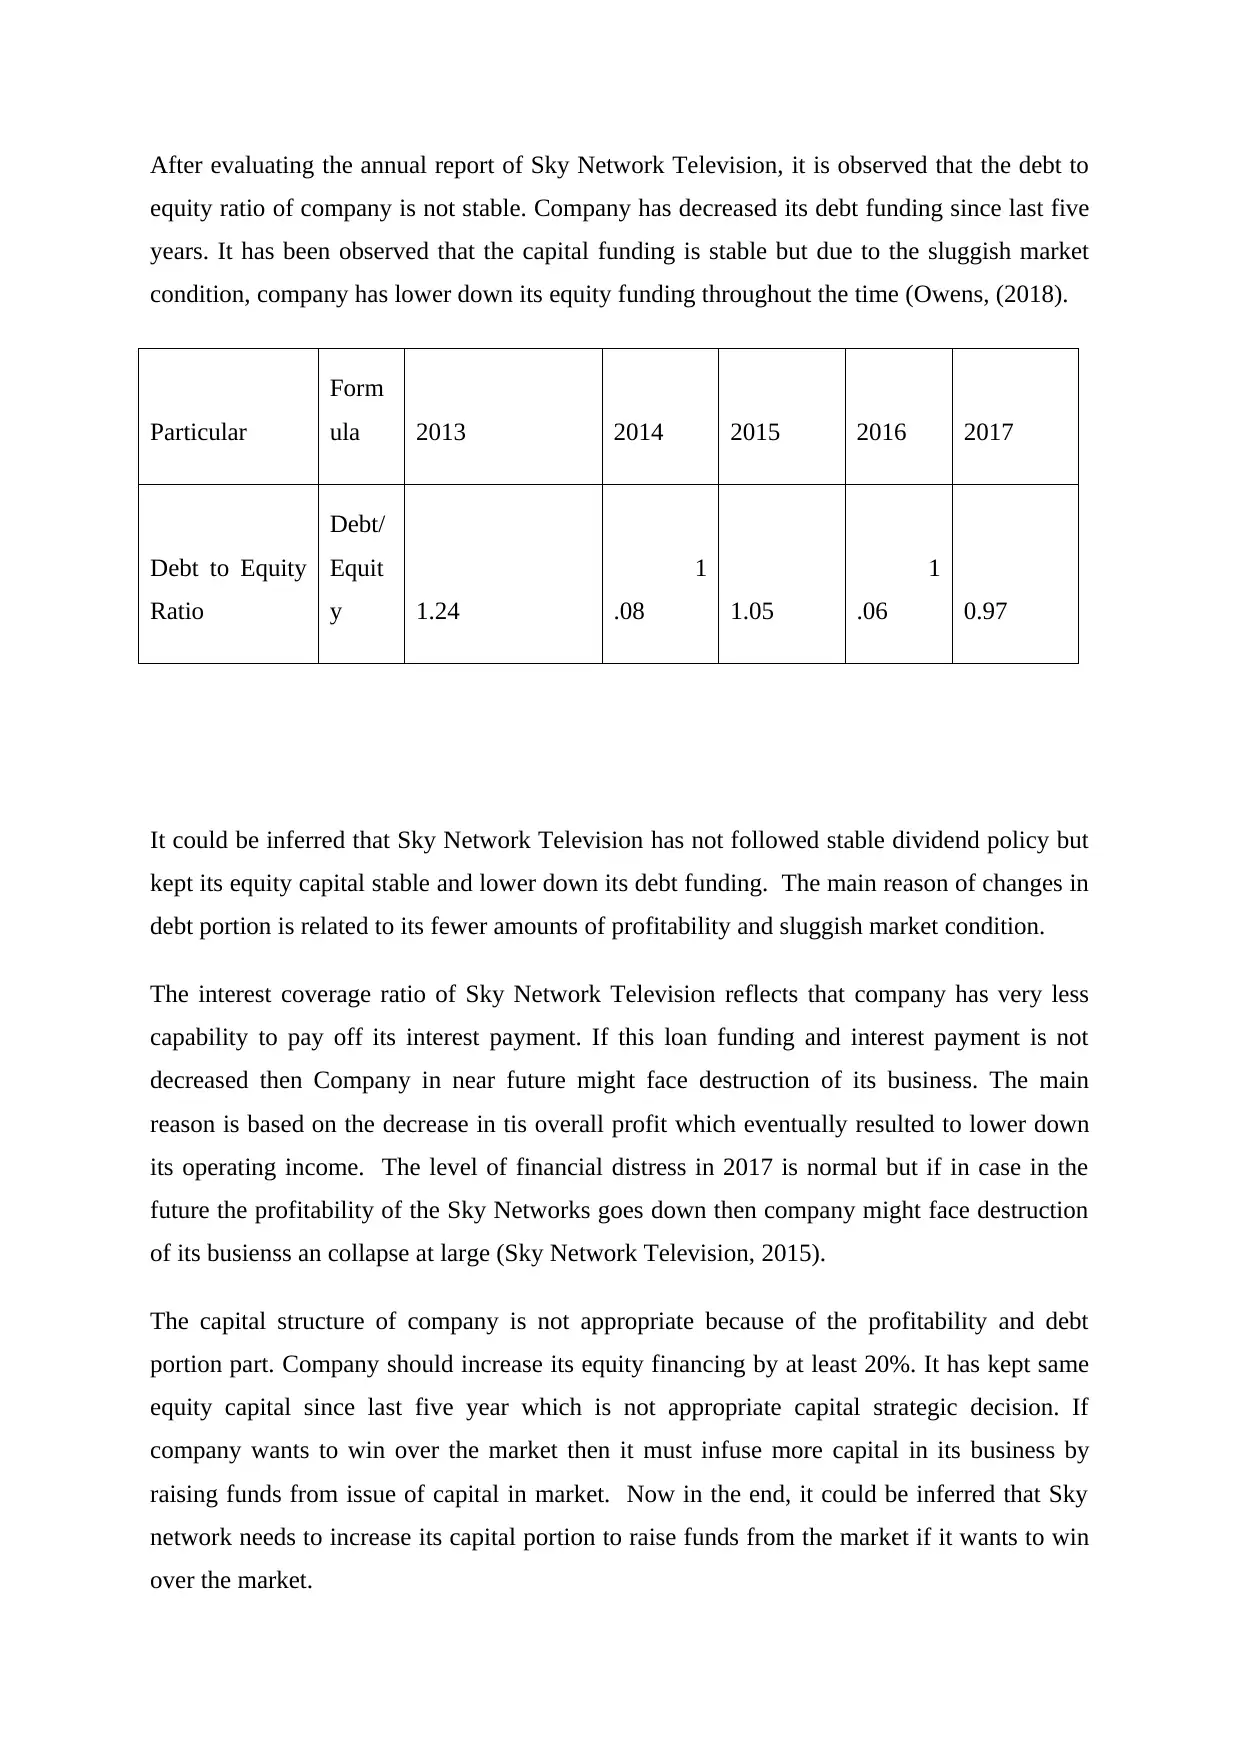
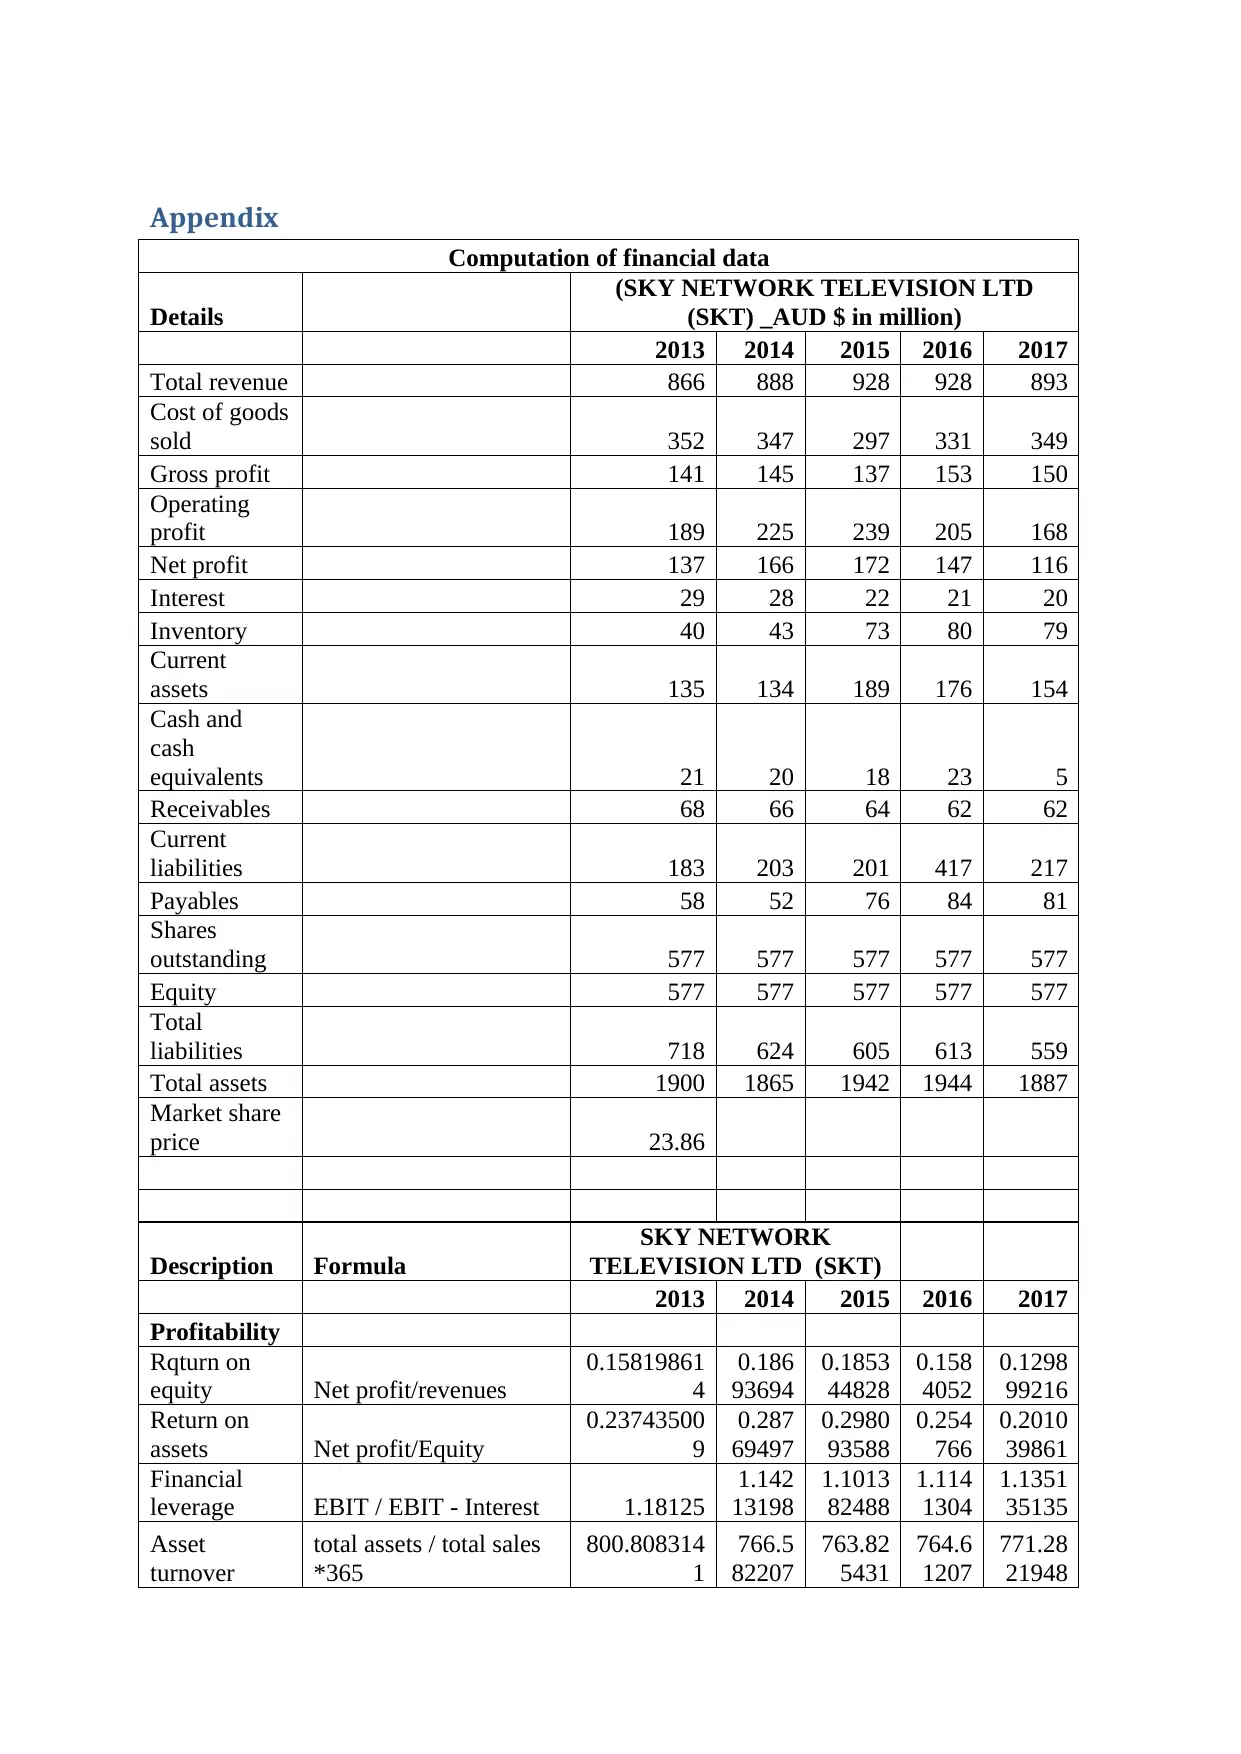
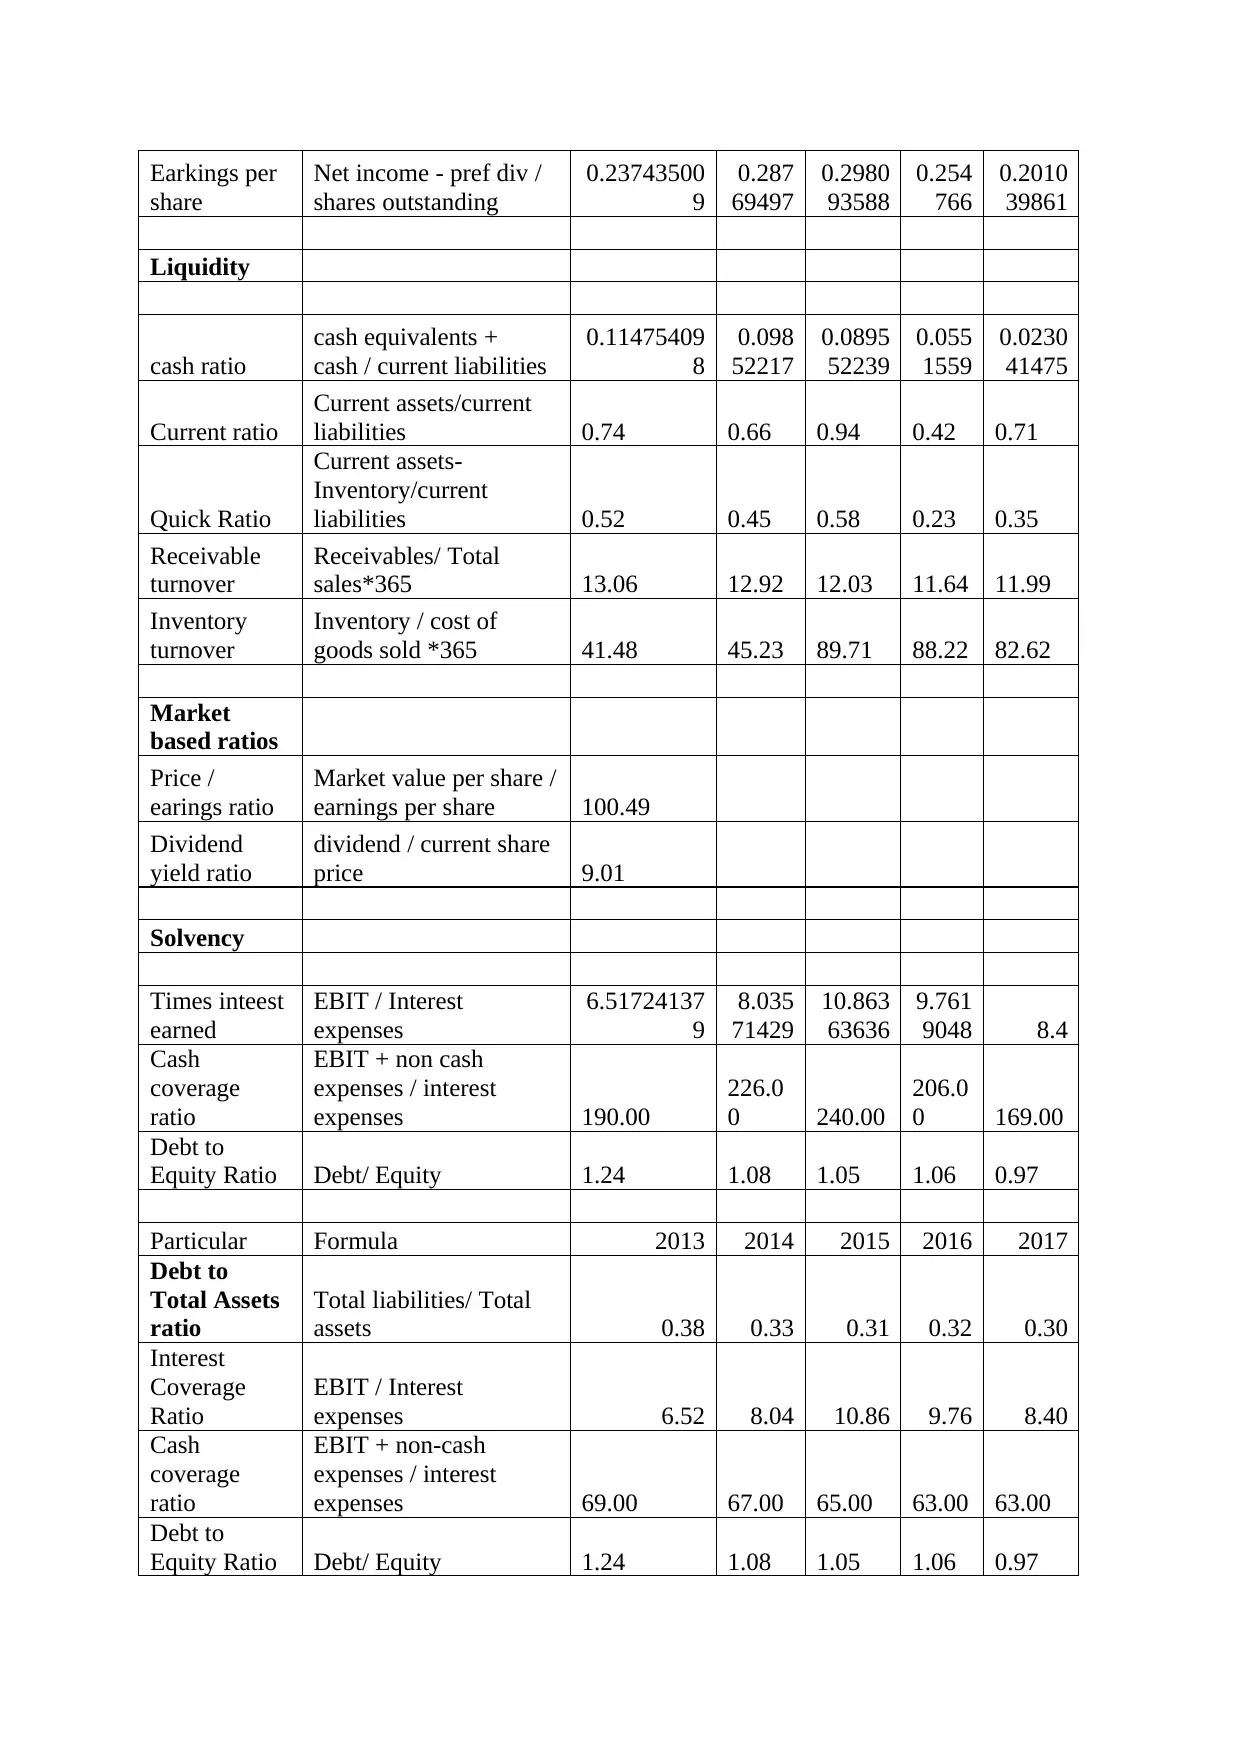
This report provides a comprehensive financial analysis of Sky Network Television Ltd, focusing on its capital structure, debt-to-asset ratio, interest coverage ratios, and strategic strengths and weaknesses. The analysis covers the period from 2013 to 2017, examining the company's financial leverage, profitability, and capital structure policies. The report calculates and interprets key financial ratios, including debt-to-assets, interest coverage, and debt-to-equity ratios, to assess the company's financial health and performance. It identifies the factors influencing the company's financial leverage, the impact of market conditions, and the importance of maintaining an optimal capital structure. The conclusion highlights the need for Sky Network Television to improve its equity financing and manage its debt to ensure long-term sustainability and competitiveness in the market. The report also provides detailed financial data and calculations in the appendix, supporting the analysis of the company's performance and financial decisions.
Contribute Materials
Your contribution can guide someone’s learning journey. Share your
documents today.

Sky Network Television Ltd
Financial Capital analysis
Finance
Name of the Student-
Financial Capital analysis
Finance
Name of the Student-
Secure Best Marks with AI Grader
Need help grading? Try our AI Grader for instant feedback on your assignments.

Table of Contents
Introduction...........................................................................................................................................2
Description of Company....................................................................................................................2
Capital structure....................................................................................................................................2
1. Debt to Assets Ratio..................................................................................................................2
2. Interest coverage ratios..............................................................................................................3
3. Reasons why bad if so................................................................................................................4
Strategic strengths and weaknesses regarding capital structure.............................................................4
Conclusion.............................................................................................................................................4
References.............................................................................................................................................6

Introduction
With the increasing ramified economic changes and complex busienss structure, each
and every company needs to establish proper equilibrium between cost of the capital and
financial leverage of company. In this report, appropriateness of the capital structure, the
firm’s pay-out policy in the increased competition and corporate governance framework of
company has been analyzed. The main outcomes of the report is to identify how company
could maintain equilibrium between cost of the capital and financial leverage of company by
having optimum capital structure i.e. debt and equity capital of the company and its
profitability. This report emphasises upon the profitability, firm pay out, capital structure and
how company has been performing in the market.
Sky Network Television is international New Zealand pay television satellite TV
provider which has faced high down fall in its busienss due to increased demand of the
streaming video services. The government of the New Zealand and other countries make
their interventions to promote advance technologies and system for the better satisfaction of
clients. The external factors such as market condition and negative business factors have also
impacted the financial leverage and share price of company at large (Sky Network
Television, 2017).
Purpose of the report
This assignment is prepared to identify the positive and negative factors of the company
which will help investors to make effective investment decision.
Objective of this report
The main objective of this report is to analysis the potential of Sky Network Television and
how it has been performing since last five years.
Events of the Company
Company raised capital from the long term debts to diversify its business and kept zero
changes in its equity part capital

Capital structure
The capital structure of company is accompanied with the debt and equity portion of
the company. Sky Network Television has faced high financial leverage in its business and in
case of its less profitability; company has been facing risk of sustainable busienss. There are
several ratios have been calculated as below to compute the capital structure ratio of company
(Sky Network Television, 2013).
1. Debt to Assets Ratio
The debt to assets ratio is an indicator of the financial leverage which divulges the % of the
total assets financed by the creditors, lenders. The debt to asset ratio is calculated by
corporation's total liabilities by its total assets (Ehiedu, 2014).
Debt to Assets ratio= Total liabilities/ Total assets
Particular Formula 2013 2014 2015 2016 2017
Debt to
Total Assets
ratio
Total liabilities/
Total assets 0.38 0.33 0.31 0.32 0.30
(Sky Network Television, 2015).
After evaluating the annual report of Sky Network Television since last five year, it
could be inferred that the debt to total assets of company has been stable since last five years.
In 2013, company had .38 points of debt to total assets which went down in 2014 by .5
points. After that in 2017 it further went down to .30 points. It shows that company has lower
down its debt financing due to the sluggish market condition and negative busienss
profitability (Robb, & Robinson, 2014).
2. Interest coverage ratios
The interest coverage ratio divulges company’s ability to pay off interest payment from its
earnings before interest and tax. It is observed that company has been paying good amount of
Secure Best Marks with AI Grader
Need help grading? Try our AI Grader for instant feedback on your assignments.

interest due to its high debt funding. It is observed that EBIT of company has gone down due
to the decreased profitability and earning capacity of company (Robb, & Robinson, 2014).
Particular Formula 2013 2014 2015 2016 2017
Interest Coverage
Ratio
EBIT /
Interest
expenses 6.52 8.04 10.86 9.76 8.40
This ratio shows that company has increased interest coverage ratio by 2 points since last five
years which is very less. It should increase its interest coverage ratio approximate to 45% as
per the internal and external market factors (Delen, Kuzey, & Uyar, 2013).
3. Reasons why bad if so
The interest coverage ratio is bad, as company has been decreasing its overall net profit
which reflects the negative busienss indicator.
Strategic strengths and weaknesses regarding capital structure
The capital structure of company shows that company has high amount of debt funding which
reflects that Sky Network Television will have lower amount of cost of capital. It will assist
in increasing the overall return on capital employed (Mwangi, & Murigu, 2015).
Weakness of the Capital structure
Sky Network Television has been facing high financial leverage. With the decrease in its
profitability, Company might go into winding up or liquidation if it fails to cover its interest
payment to its debtors (Sky Network Television, 2017).
Conclusion
Capital structure policy of Sky Network Television over the past five years

After evaluating the annual report of Sky Network Television, it is observed that the debt to
equity ratio of company is not stable. Company has decreased its debt funding since last five
years. It has been observed that the capital funding is stable but due to the sluggish market
condition, company has lower down its equity funding throughout the time (Owens, (2018).
Particular
Form
ula 2013 2014 2015 2016 2017
Debt to Equity
Ratio
Debt/
Equit
y 1.24
1
.08 1.05
1
.06 0.97
It could be inferred that Sky Network Television has not followed stable dividend policy but
kept its equity capital stable and lower down its debt funding. The main reason of changes in
debt portion is related to its fewer amounts of profitability and sluggish market condition.
The interest coverage ratio of Sky Network Television reflects that company has very less
capability to pay off its interest payment. If this loan funding and interest payment is not
decreased then Company in near future might face destruction of its business. The main
reason is based on the decrease in tis overall profit which eventually resulted to lower down
its operating income. The level of financial distress in 2017 is normal but if in case in the
future the profitability of the Sky Networks goes down then company might face destruction
of its busienss an collapse at large (Sky Network Television, 2015).
The capital structure of company is not appropriate because of the profitability and debt
portion part. Company should increase its equity financing by at least 20%. It has kept same
equity capital since last five year which is not appropriate capital strategic decision. If
company wants to win over the market then it must infuse more capital in its business by
raising funds from issue of capital in market. Now in the end, it could be inferred that Sky
network needs to increase its capital portion to raise funds from the market if it wants to win
over the market.

Paraphrase This Document
Need a fresh take? Get an instant paraphrase of this document with our AI Paraphraser

References
Delen, D., Kuzey, C. & Uyar, A., 2013. Measuring firm performance using financial ratios:
A decision tree approach. Expert Systems with Applications, 40(10), pp.3970-3983.
Ehiedu, V.C., (2014). The impact of liquidity on profitability of some selected companies:
The financial statement analysis (FSA) approach. Research Journal of Finance and
Accounting, 5(5), pp.81-90.
Mwangi, M. & Murigu, J.W., 2015. The determinants of financial performance in general
insurance companies in Kenya. European Scientific Journal, ESJ, 11(1).
Owens, D. (2018). Simply Wall ST. Retrieved from https://simplywall.st/stocks/au/banks/asx-
ben/bendigo-and-adelaide-bank-shares/news/what-makes-bendigo-and-adelaide-bank-
limited-asxben-a-great-dividend-stock/
Robb, A.M. & Robinson, D.T., 2014. The capital structure decisions of new firms. The
Review of Financial Studies, 27(1), pp.153-179.
Sky Network Television, 2013, Annual report, retrieved on 12th May, 2018, from
http://www.annualreports.com/Company/Sky-Network-Television-Ltd
Sky Network Television, 2015, Annual report, retrieved on 12th May, 2018, from
http://www.annualreports.com/Company/Sky-Network-Television-Ltd
Sky Network Television, 2017, Annual report, retrieved on 12th May, 2018, from
http://www.annualreports.com/Company/Sky-Network-Television-Ltd

Appendix
Computation of financial data
Details
(SKY NETWORK TELEVISION LTD
(SKT) _AUD $ in million)
2013 2014 2015 2016 2017
Total revenue 866 888 928 928 893
Cost of goods
sold 352 347 297 331 349
Gross profit 141 145 137 153 150
Operating
profit 189 225 239 205 168
Net profit 137 166 172 147 116
Interest 29 28 22 21 20
Inventory 40 43 73 80 79
Current
assets 135 134 189 176 154
Cash and
cash
equivalents 21 20 18 23 5
Receivables 68 66 64 62 62
Current
liabilities 183 203 201 417 217
Payables 58 52 76 84 81
Shares
outstanding 577 577 577 577 577
Equity 577 577 577 577 577
Total
liabilities 718 624 605 613 559
Total assets 1900 1865 1942 1944 1887
Market share
price 23.86
Description Formula
SKY NETWORK
TELEVISION LTD (SKT)
2013 2014 2015 2016 2017
Profitability
Rqturn on
equity Net profit/revenues
0.15819861
4
0.186
93694
0.1853
44828
0.158
4052
0.1298
99216
Return on
assets Net profit/Equity
0.23743500
9
0.287
69497
0.2980
93588
0.254
766
0.2010
39861
Financial
leverage EBIT / EBIT - Interest 1.18125
1.142
13198
1.1013
82488
1.114
1304
1.1351
35135
Asset
turnover
total assets / total sales
*365
800.808314
1
766.5
82207
763.82
5431
764.6
1207
771.28
21948

Earkings per
share
Net income - pref div /
shares outstanding
0.23743500
9
0.287
69497
0.2980
93588
0.254
766
0.2010
39861
Liquidity
cash ratio
cash equivalents +
cash / current liabilities
0.11475409
8
0.098
52217
0.0895
52239
0.055
1559
0.0230
41475
Current ratio
Current assets/current
liabilities 0.74 0.66 0.94 0.42 0.71
Quick Ratio
Current assets-
Inventory/current
liabilities 0.52 0.45 0.58 0.23 0.35
Receivable
turnover
Receivables/ Total
sales*365 13.06 12.92 12.03 11.64 11.99
Inventory
turnover
Inventory / cost of
goods sold *365 41.48 45.23 89.71 88.22 82.62
Market
based ratios
Price /
earings ratio
Market value per share /
earnings per share 100.49
Dividend
yield ratio
dividend / current share
price 9.01
Solvency
Times inteest
earned
EBIT / Interest
expenses
6.51724137
9
8.035
71429
10.863
63636
9.761
9048 8.4
Cash
coverage
ratio
EBIT + non cash
expenses / interest
expenses 190.00
226.0
0 240.00
206.0
0 169.00
Debt to
Equity Ratio Debt/ Equity 1.24 1.08 1.05 1.06 0.97
Particular Formula 2013 2014 2015 2016 2017
Debt to
Total Assets
ratio
Total liabilities/ Total
assets 0.38 0.33 0.31 0.32 0.30
Interest
Coverage
Ratio
EBIT / Interest
expenses 6.52 8.04 10.86 9.76 8.40
Cash
coverage
ratio
EBIT + non-cash
expenses / interest
expenses 69.00 67.00 65.00 63.00 63.00
Debt to
Equity Ratio Debt/ Equity 1.24 1.08 1.05 1.06 0.97
1 out of 10
Related Documents

Your All-in-One AI-Powered Toolkit for Academic Success.
 +13062052269
info@desklib.com
Available 24*7 on WhatsApp / Email
Unlock your academic potential
© 2024  |  Zucol Services PVT LTD  |  All rights reserved.