Report on Numeracy and Data Analysis: Sleep Data and Calculations

Verified

Added on  2023/01/11

|12
|1525
|65
Report
AI Summary
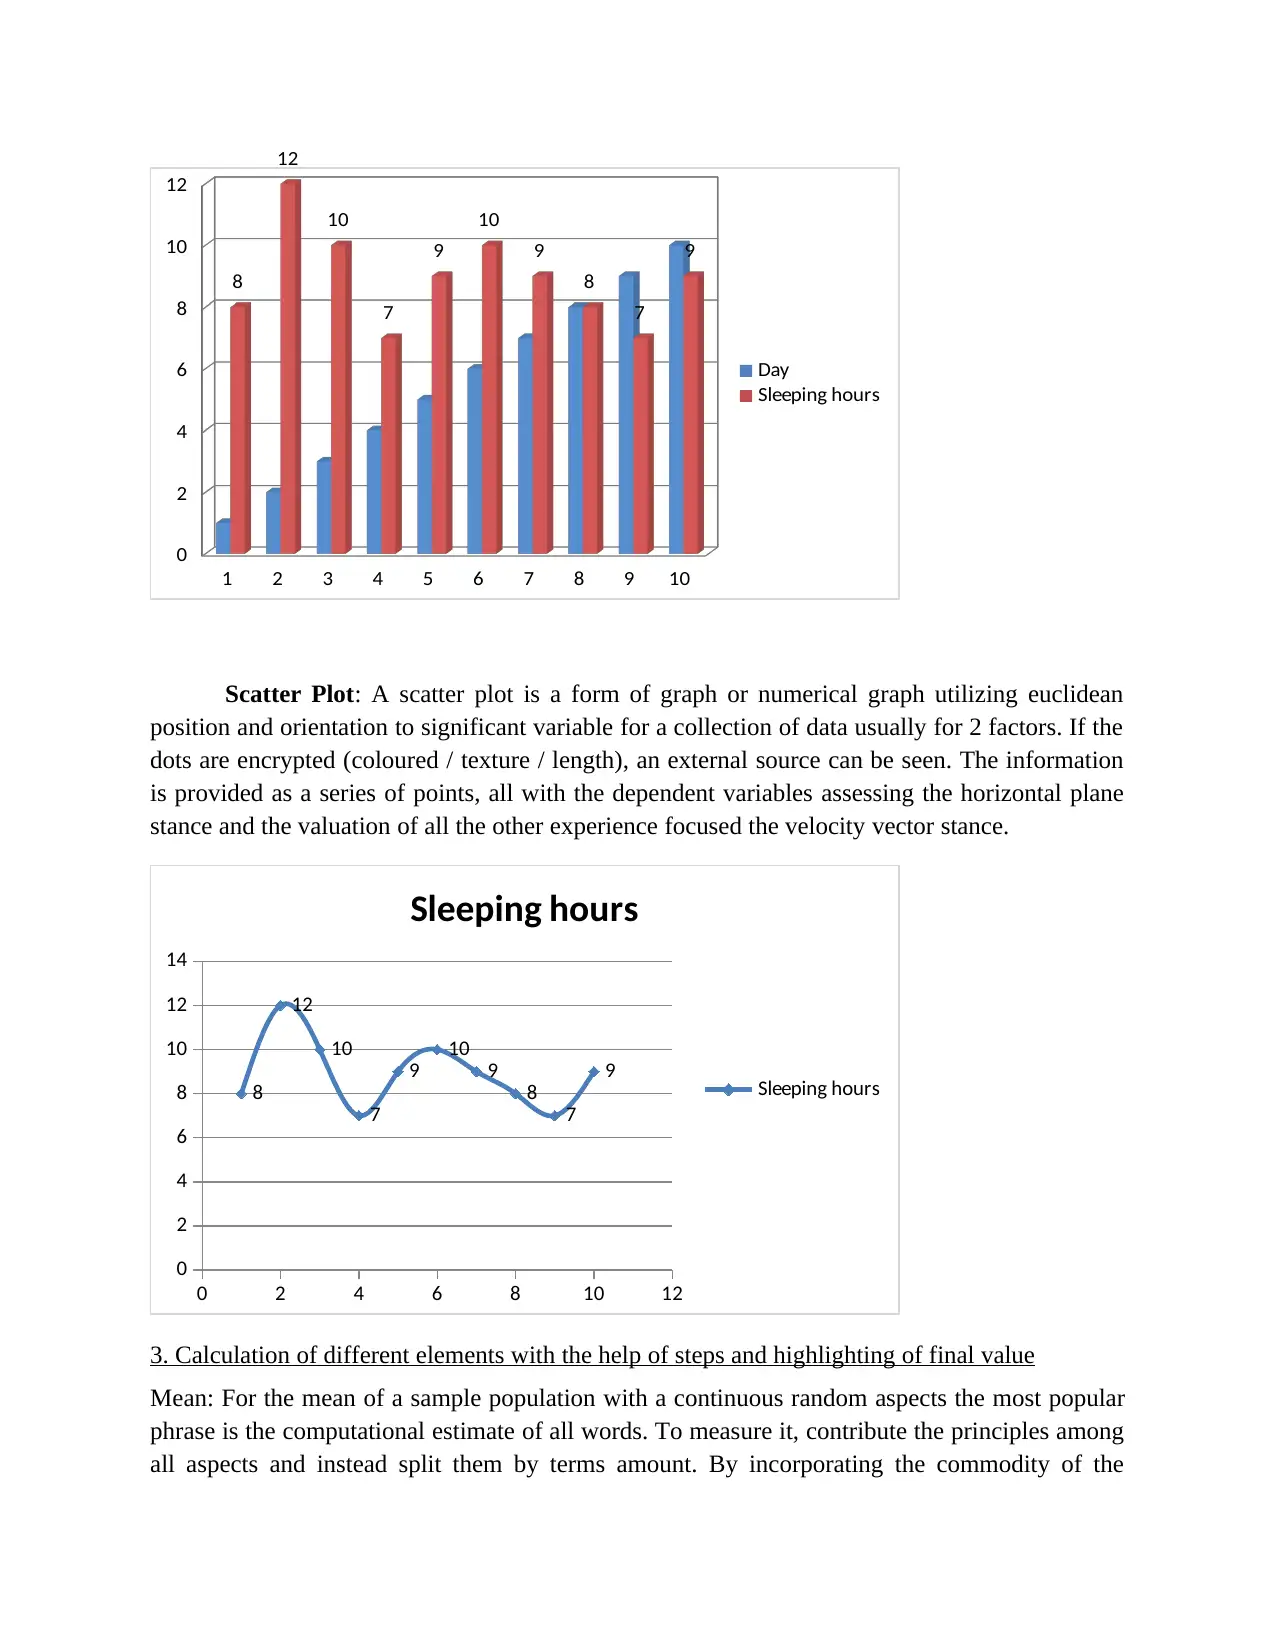
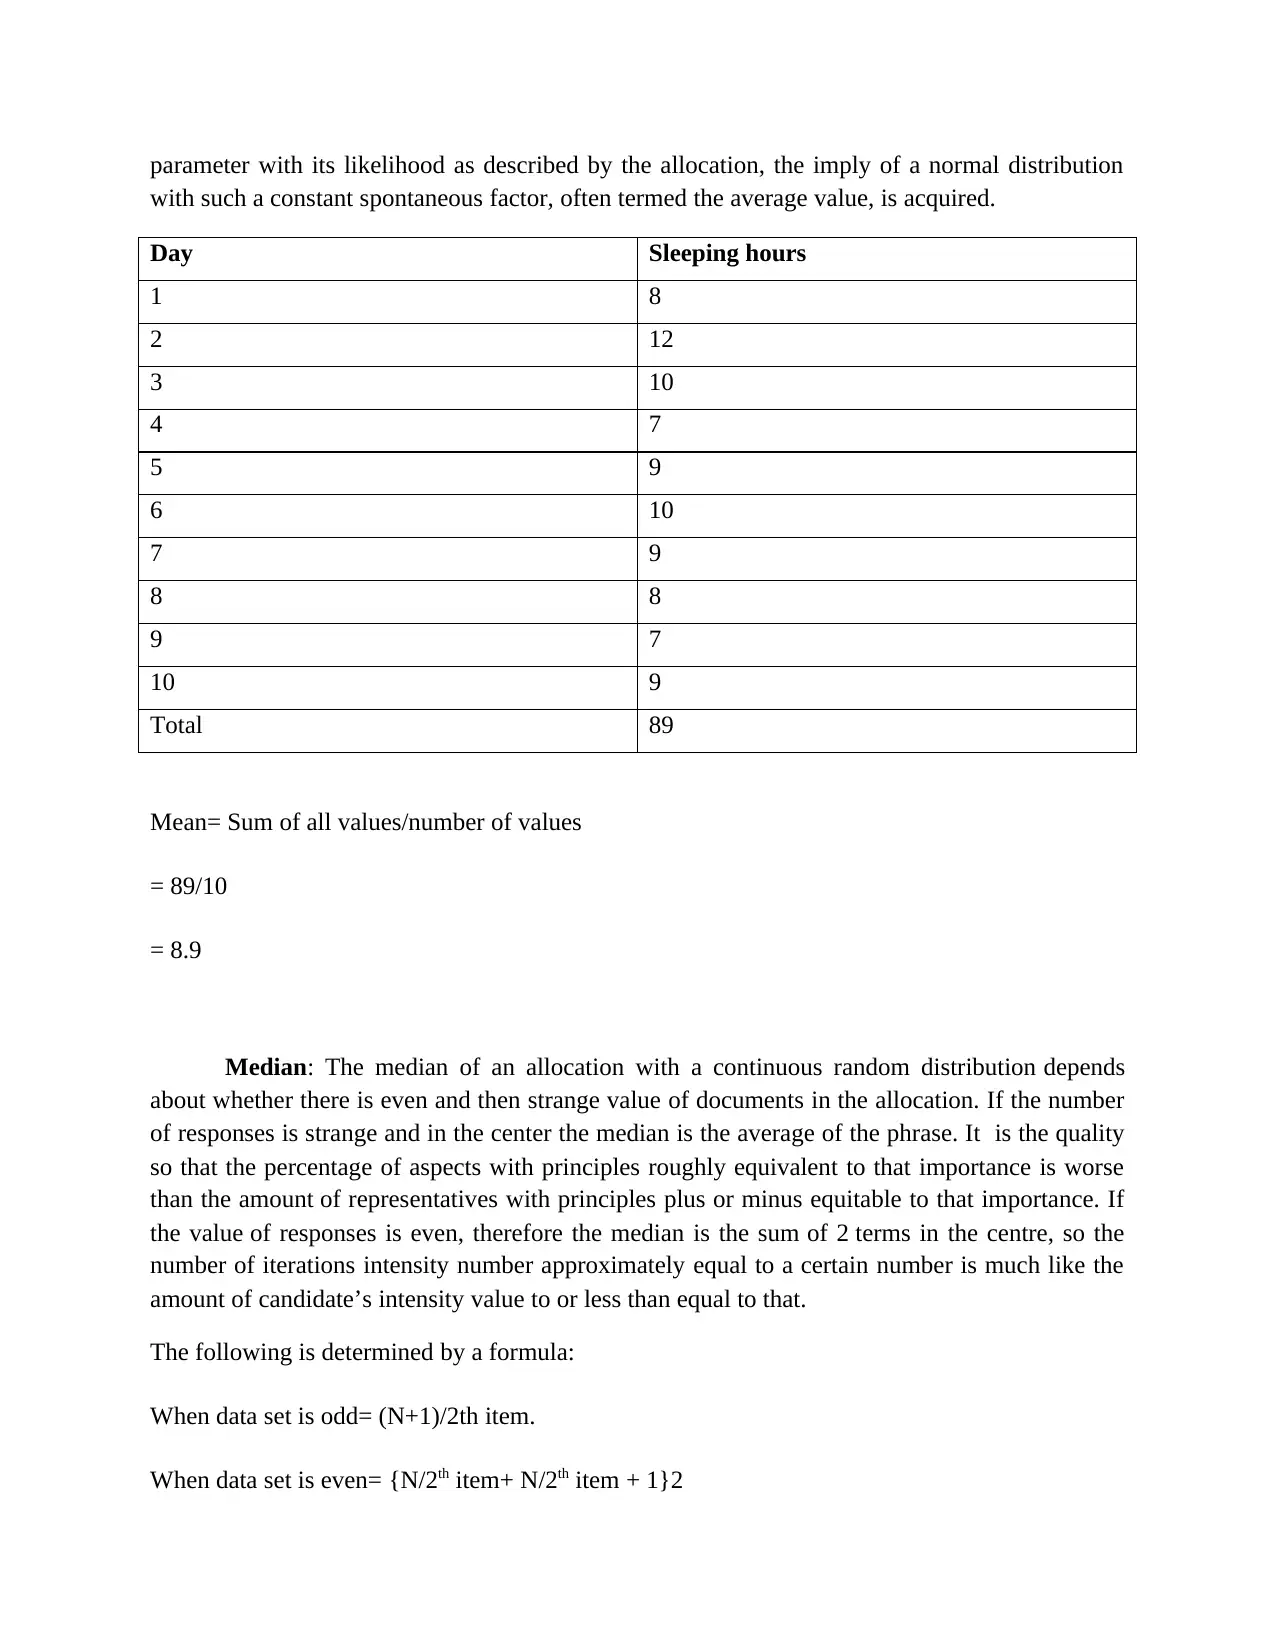
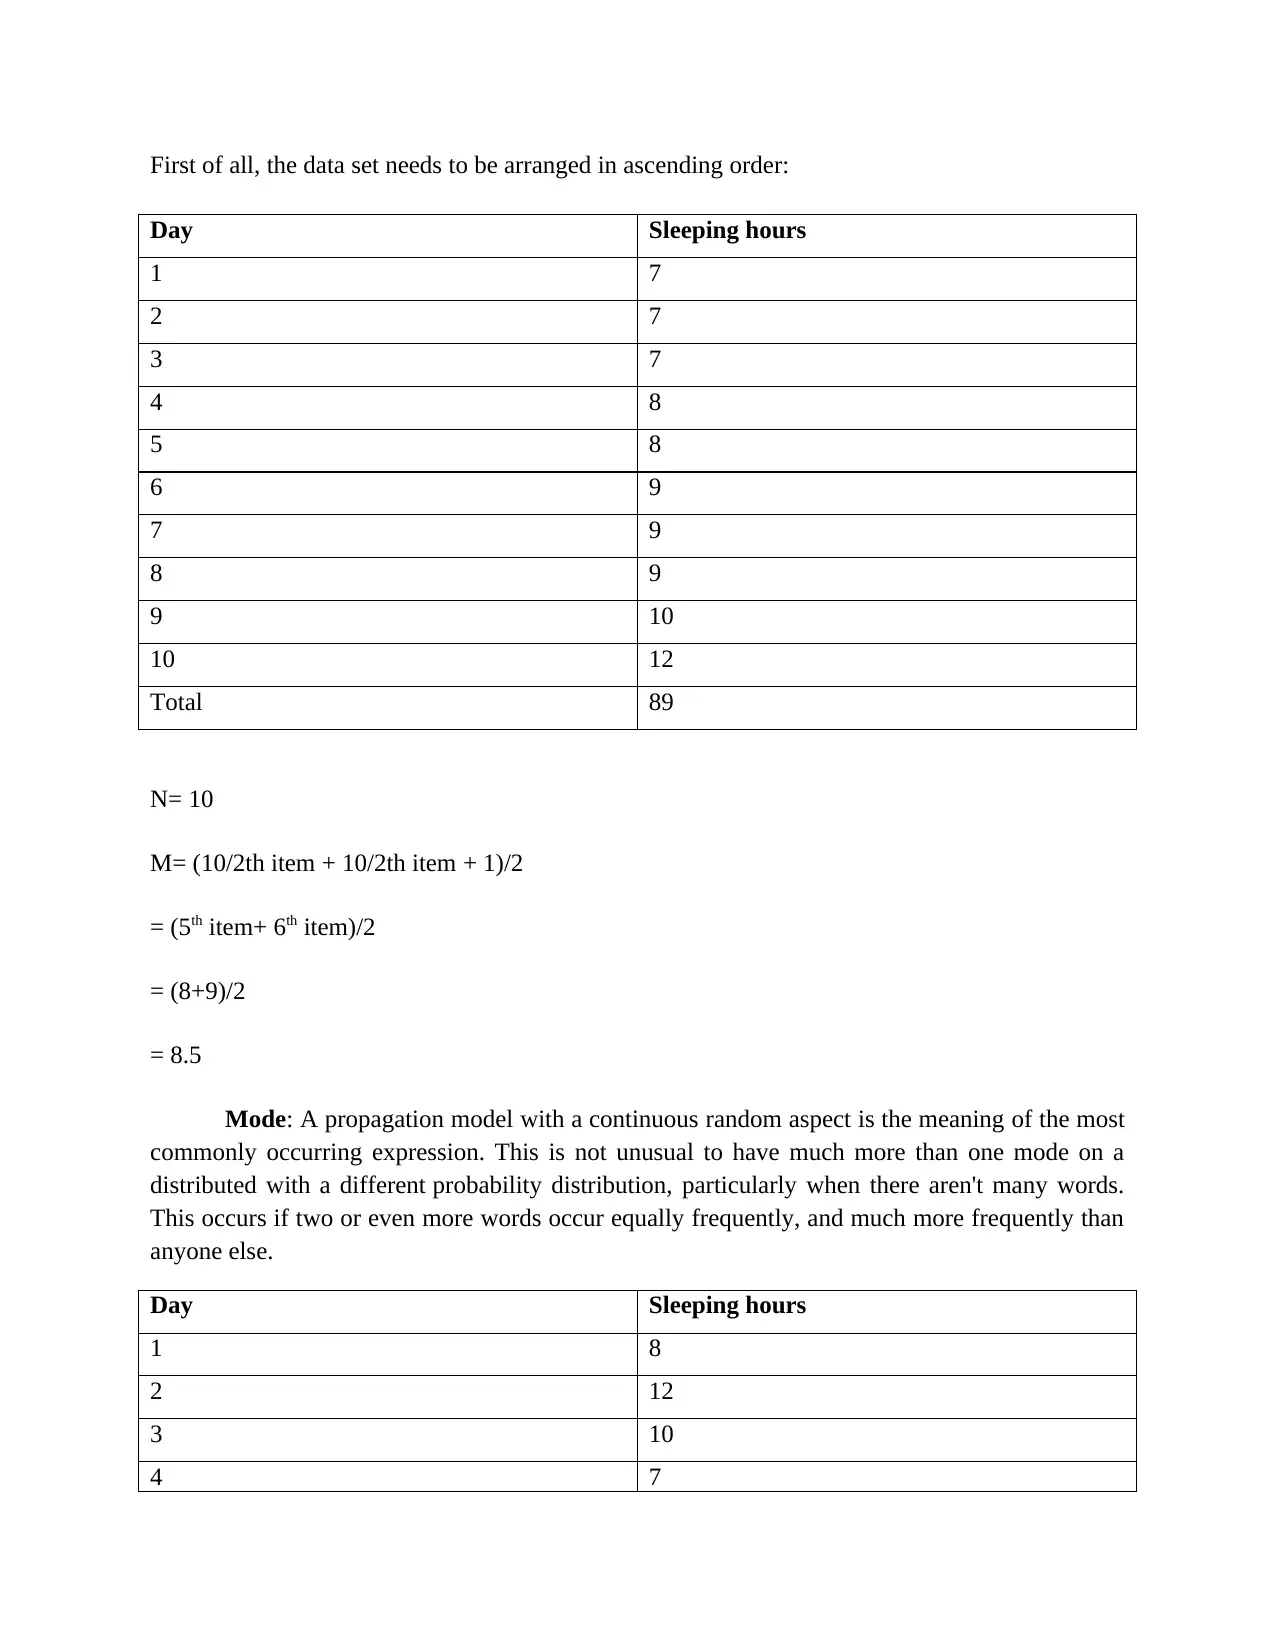
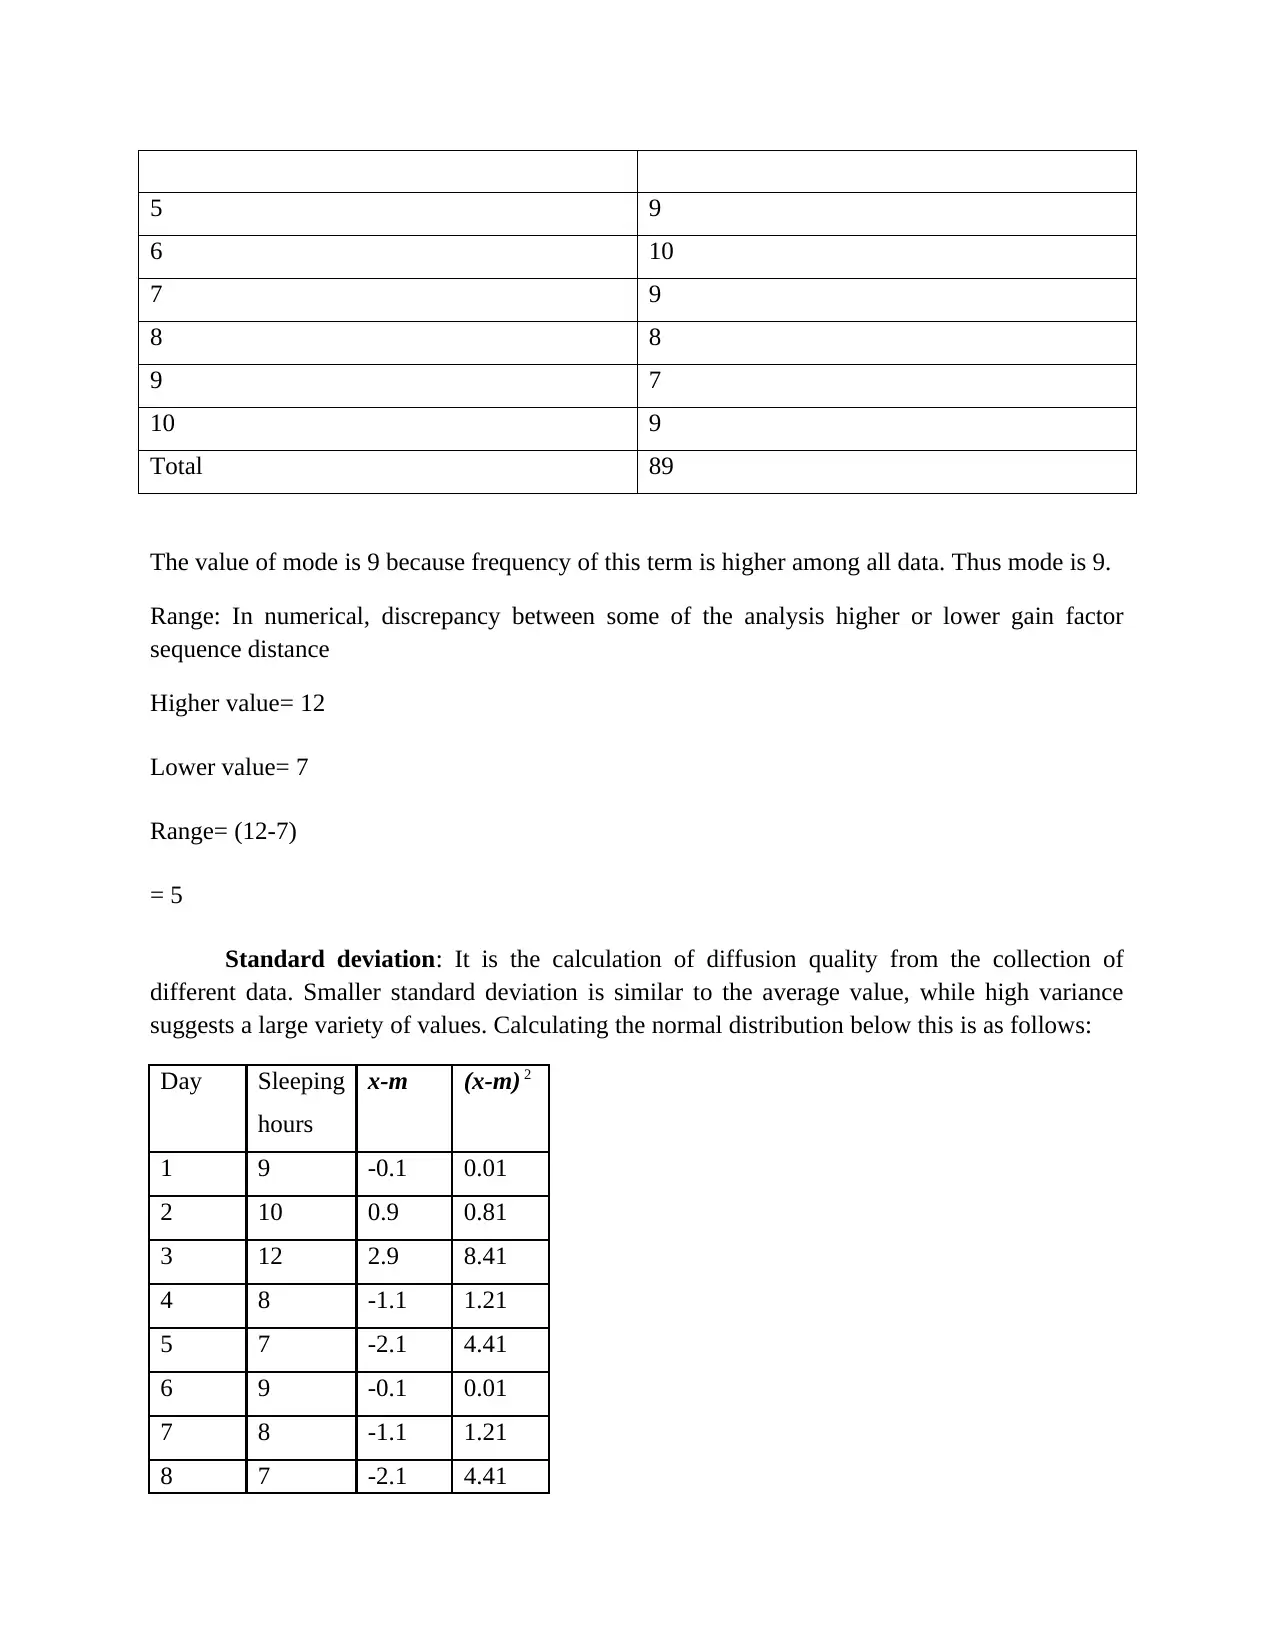
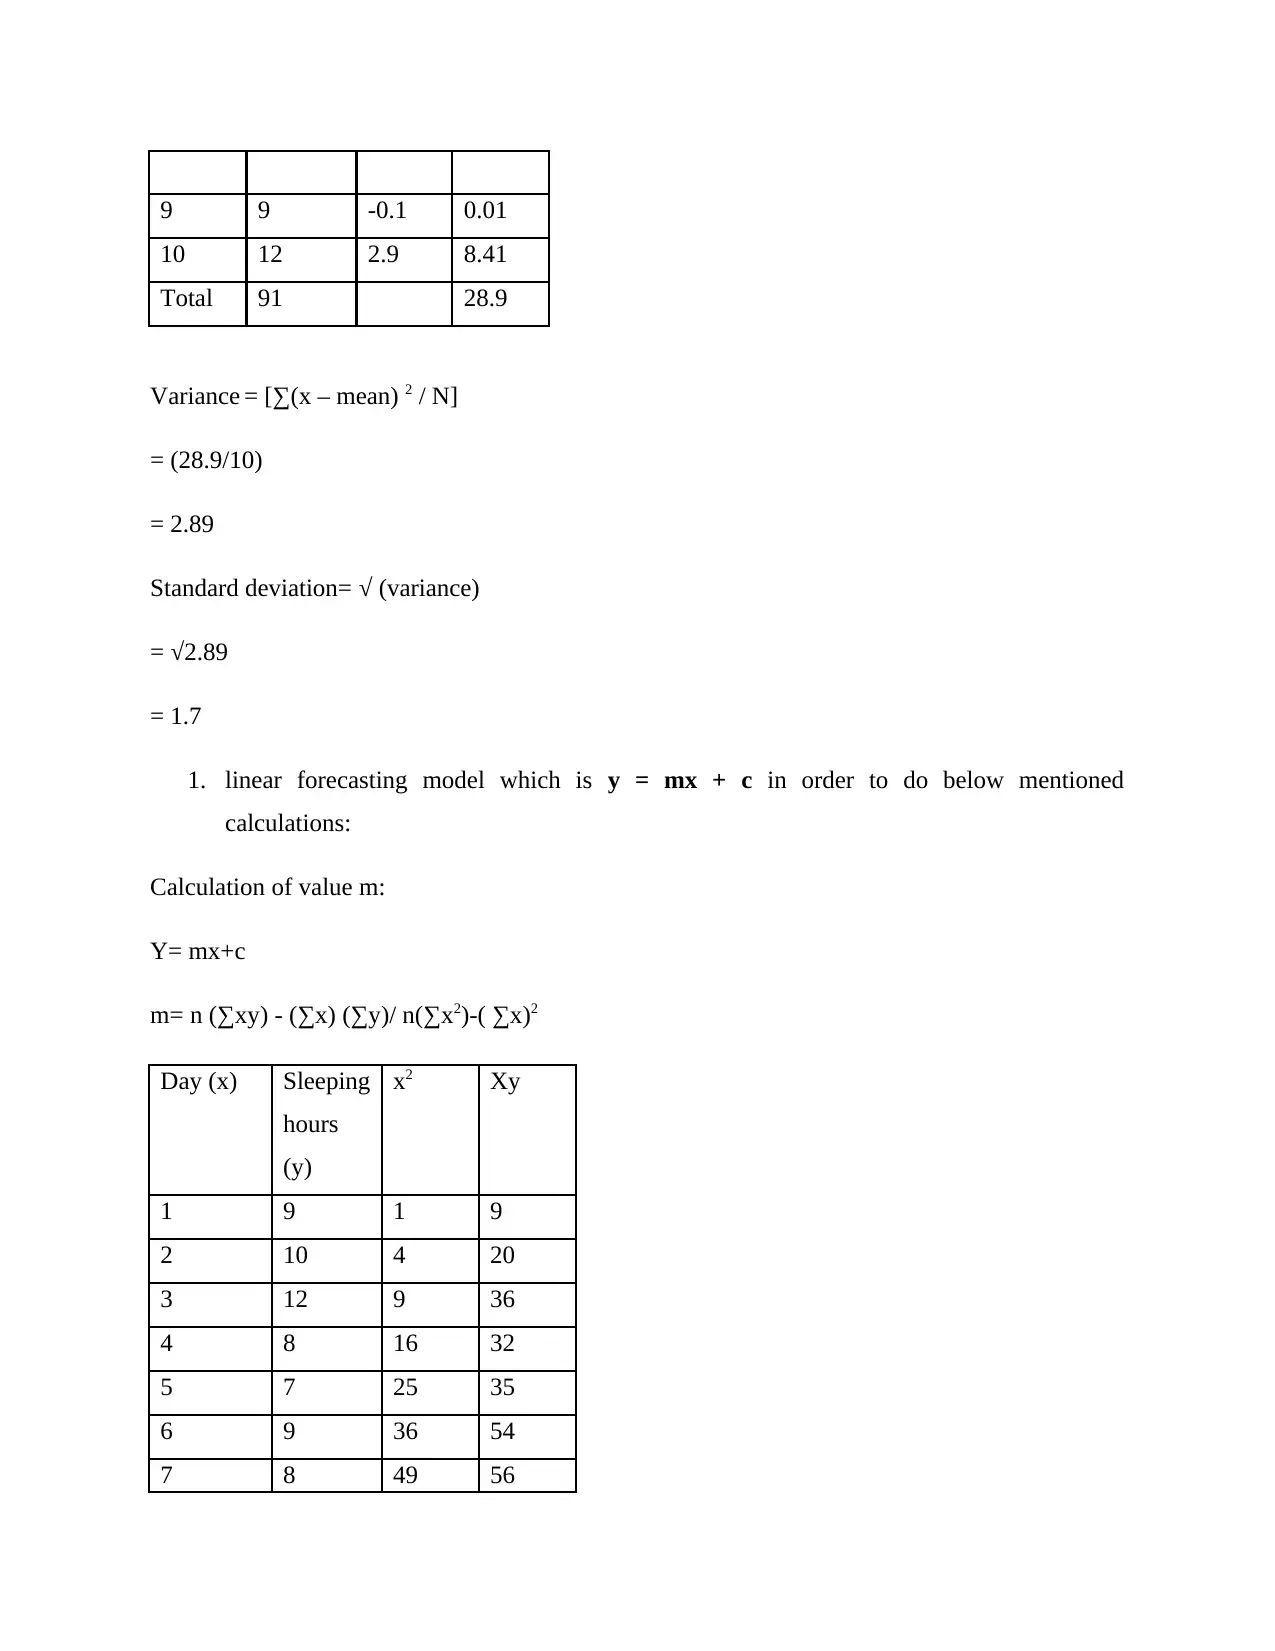
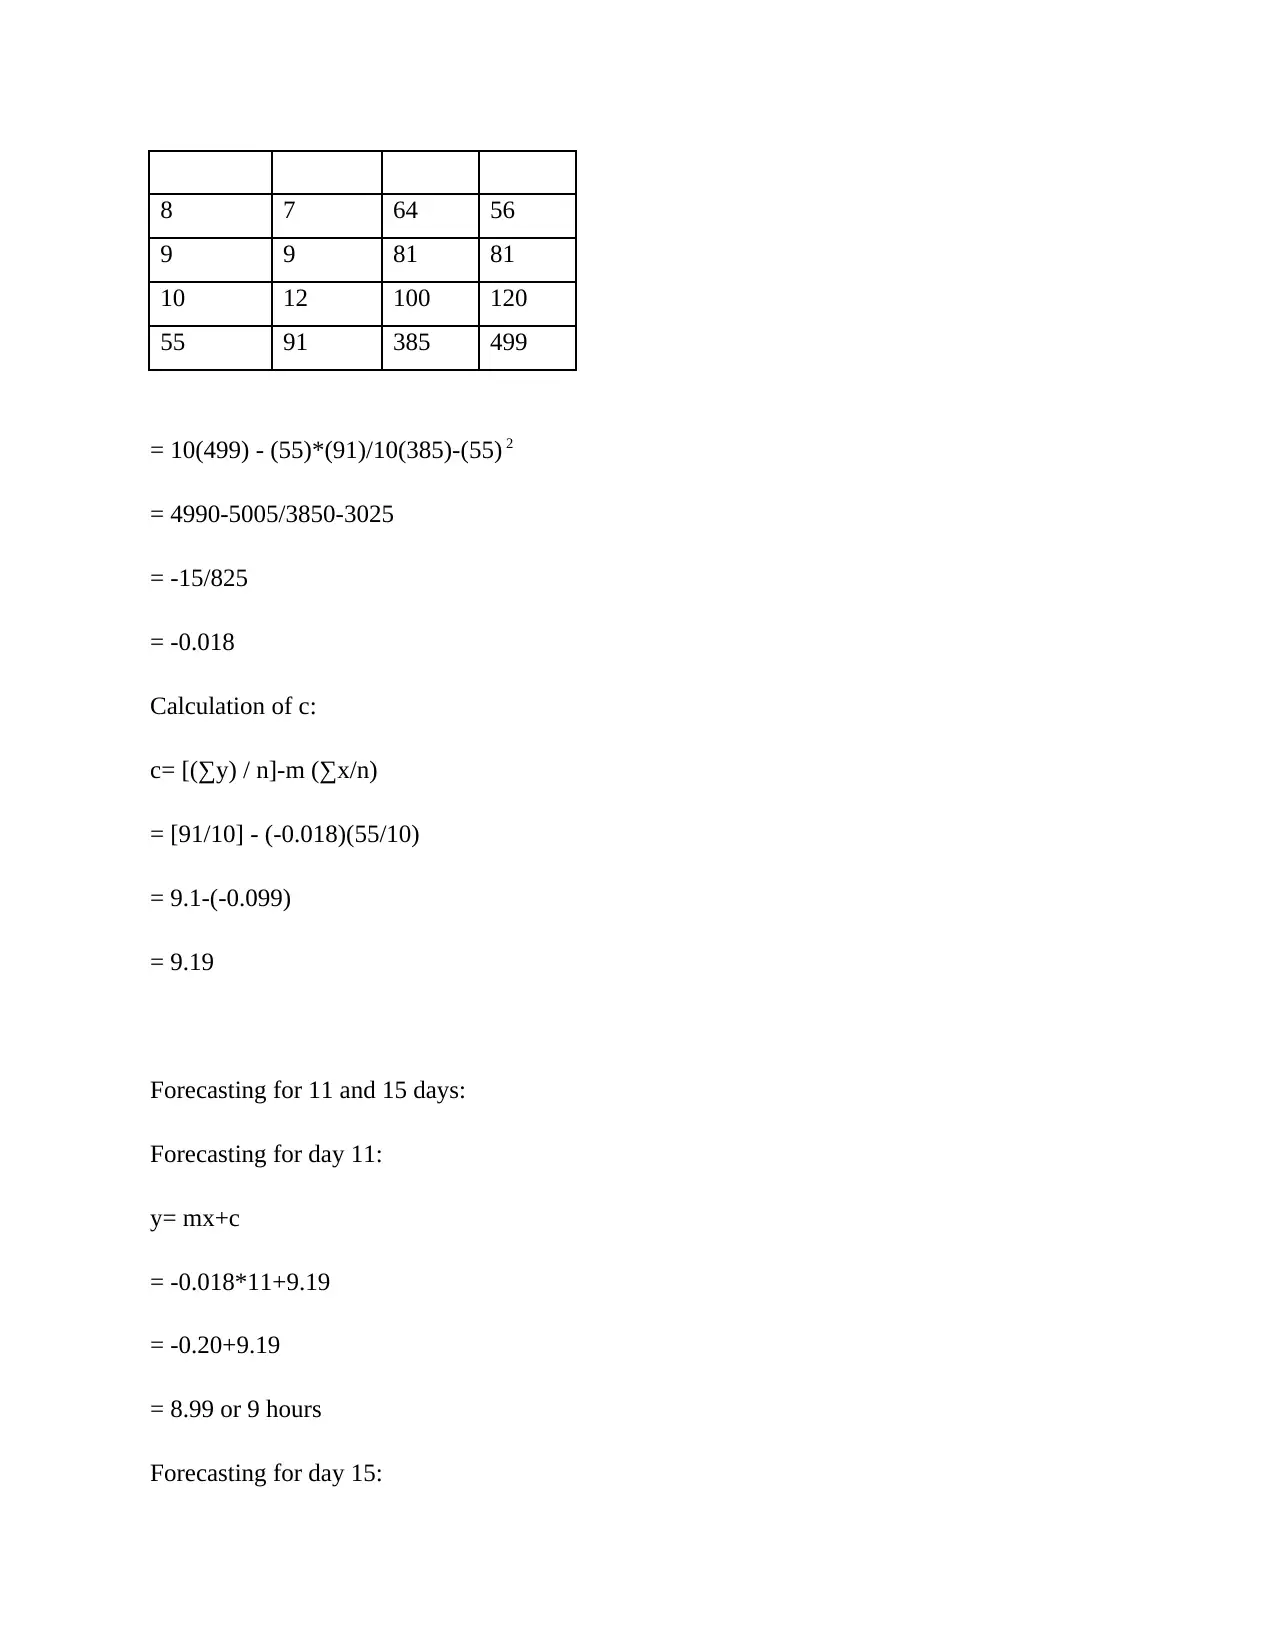
This report presents a comprehensive analysis of sleep data, encompassing data arrangement, presentation, and statistical calculations. The analysis begins by organizing sleep hours recorded over ten days into a tabular format, followed by data visualization using column charts and scatter plots. The core of the report involves calculating essential statistical measures, including the mean, median, mode, range, and standard deviation, with each step clearly outlined. Furthermore, the report employs a linear forecasting model to predict sleep hours for future days. The conclusion highlights the importance of statistical analysis in interpreting data and summarizes the findings of the study, including forecasted sleep hours for specific days. The report references relevant academic sources to support its methodology and findings.
Document Page
NUMERACY AND DATA
ANALYSIS
tabler-icon-diamond-filled.svg

Paraphrase This Document

Need a fresh take? Get an instant paraphrase of this document with our AI Paraphraser
Document Page
Document Page
Contents
MAIN BODY.................................................................................................................................................3
1. Arranging data in tabular format.........................................................................................................3
2. Presenting data in two different chart format.....................................................................................3
3. Calculation of different elements with the help of steps and highlighting of final value.....................4
CONCLUSION.............................................................................................................................................10
Document Page
INTRODUCTION
Analysis of numeracy and records always had to assess large data to help groups and
their international operations. Individuals can forget the massive numbers with the aid of data
collection and can provide some production which also assists in the corporation's decision-
making method. This report mainly based on sleep per day on different days, as well as further
research will be focused on the results. This analysis involves the different subjects and arranges
data in table format, as well as the measurement of mode, mean, standard deviation and range.
Additionally, companies or government departments willing to foresee the outcome with the aid
of linear forecast model.
MAIN BODY
1. Arranging data in tabular format
There are mentioned data of sleep per day by a person on different days that are mentioned
below in table format:
Day Sleeping hours
1 8
2 12
3 10
4 7
5 9
6 10
7 9
8 8
9 7
10 9
2. Presenting data in two different chart format
Data presentation in column chart format and it mentioned below:
Column chart: A column chart is a data presentation graph displaying vertical lines with
the axis amounts for the bars shown on the sample's left hand side. This is a visual item used
in Excel spreadsheet to display the information. If want to make comparisons throughout classes,
that can use a line map.
tabler-icon-diamond-filled.svg

Paraphrase This Document

Need a fresh take? Get an instant paraphrase of this document with our AI Paraphraser
Document Page
1 2 3 4 5 6 7 8 9 10
0
2
4
6
8
10
12
8
12
10
7
9
10
9
8
7
9
Day
Sleeping hours
Scatter Plot: A scatter plot is a form of graph or numerical graph utilizing euclidean
position and orientation to significant variable for a collection of data usually for 2 factors. If the
dots are encrypted (coloured / texture / length), an external source can be seen. The information
is provided as a series of points, all with the dependent variables assessing the horizontal plane
stance and the valuation of all the other experience focused the velocity vector stance.
0 2 4 6 8 10 12
0
2
4
6
8
10
12
14
8
12
10
7
9
10
9
8
7
9
Sleeping hours
Sleeping hours
3. Calculation of different elements with the help of steps and highlighting of final value
Mean: For the mean of a sample population with a continuous random aspects the most popular
phrase is the computational estimate of all words. To measure it, contribute the principles among
all aspects and instead split them by terms amount. By incorporating the commodity of the
Document Page
parameter with its likelihood as described by the allocation, the imply of a normal distribution
with such a constant spontaneous factor, often termed the average value, is acquired.
Day Sleeping hours
1 8
2 12
3 10
4 7
5 9
6 10
7 9
8 8
9 7
10 9
Total 89
Mean= Sum of all values/number of values
= 89/10
= 8.9
Median: The median of an allocation with a continuous random distribution depends
about whether there is even and then strange value of documents in the allocation. If the number
of responses is strange and in the center the median is the average of the phrase. It is the quality
so that the percentage of aspects with principles roughly equivalent to that importance is worse
than the amount of representatives with principles plus or minus equitable to that importance. If
the value of responses is even, therefore the median is the sum of 2 terms in the centre, so the
number of iterations intensity number approximately equal to a certain number is much like the
amount of candidate’s intensity value to or less than equal to that.
The following is determined by a formula:
When data set is odd= (N+1)/2th item.
When data set is even= {N/2th item+ N/2th item + 1}2
Document Page
First of all, the data set needs to be arranged in ascending order:
Day Sleeping hours
1 7
2 7
3 7
4 8
5 8
6 9
7 9
8 9
9 10
10 12
Total 89
N= 10
M= (10/2th item + 10/2th item + 1)/2
= (5th item+ 6th item)/2
= (8+9)/2
= 8.5
Mode: A propagation model with a continuous random aspect is the meaning of the most
commonly occurring expression. This is not unusual to have much more than one mode on a
distributed with a different probability distribution, particularly when there aren't many words.
This occurs if two or even more words occur equally frequently, and much more frequently than
anyone else.
Day Sleeping hours
1 8
2 12
3 10
4 7
tabler-icon-diamond-filled.svg

Paraphrase This Document

Need a fresh take? Get an instant paraphrase of this document with our AI Paraphraser
Document Page
5 9
6 10
7 9
8 8
9 7
10 9
Total 89
The value of mode is 9 because frequency of this term is higher among all data. Thus mode is 9.
Range: In numerical, discrepancy between some of the analysis higher or lower gain factor
sequence distance
Higher value= 12
Lower value= 7
Range= (12-7)
= 5
Standard deviation: It is the calculation of diffusion quality from the collection of
different data. Smaller standard deviation is similar to the average value, while high variance
suggests a large variety of values. Calculating the normal distribution below this is as follows:
Day Sleeping
hours
x-m (x-m) 2
1 9 -0.1 0.01
2 10 0.9 0.81
3 12 2.9 8.41
4 8 -1.1 1.21
5 7 -2.1 4.41
6 9 -0.1 0.01
7 8 -1.1 1.21
8 7 -2.1 4.41
Document Page
9 9 -0.1 0.01
10 12 2.9 8.41
Total 91 28.9
Variance = [∑(x – mean) 2 / N]
= (28.9/10)
= 2.89
Standard deviation= (variance)
= √2.89
= 1.7
1. linear forecasting model which is y = mx + c in order to do below mentioned
calculations:
Calculation of value m:
Y= mx+c
m= n (∑xy) - (∑x) (∑y)/ n(∑x2)-( ∑x)2
Day (x) Sleeping
hours
(y)
x2 Xy
1 9 1 9
2 10 4 20
3 12 9 36
4 8 16 32
5 7 25 35
6 9 36 54
7 8 49 56
Document Page
8 7 64 56
9 9 81 81
10 12 100 120
55 91 385 499
= 10(499) - (55)*(91)/10(385)-(55) 2
= 4990-5005/3850-3025
= -15/825
= -0.018
Calculation of c:
c= [(∑y) / n]-m (∑x/n)
= [91/10] - (-0.018)(55/10)
= 9.1-(-0.099)
= 9.19
Forecasting for 11 and 15 days:
Forecasting for day 11:
y= mx+c
= -0.018*11+9.19
= -0.20+9.19
= 8.99 or 9 hours
Forecasting for day 15:
tabler-icon-diamond-filled.svg

Paraphrase This Document

Need a fresh take? Get an instant paraphrase of this document with our AI Paraphraser
Document Page
= -0.018*15+9.19
= -0.27+9.19
= 8.92 hours
CONCLUSION
In the following study it is claimed that statistical analysis is too critical to identify any
particular consequences of data gathering. Various values were calculated in this study, including
such standard, mode, median and different others. The second part of the study ends with a
conditional approximation of the sleeping hours predicted for day 11 and day 15.
Document Page
REFERENCES
Books and Journal
Huang, Q., Zhang, X., Liu, Y., Yang, W. and Song, Z., 2017. The contribution of parent–child
numeracy activities to young Chinese children's mathematical ability. British Journal of
Educational Psychology. 87(3). pp.328-344.
Mmasa, M. and Anney, V. N., 2016. Exploring Literacy and Numeracy Teaching in Tanzanian
Classrooms: Insights from Teachers' Classroom Practices. Journal of Education and
Practice. 7(9). pp.137-154.
Aunio, P. and Mononen, R., 2018. The effects of educational computer game on low-performing
children’s early numeracy skills–an intervention study in a preschool setting. European
Journal of Special Needs Education. 33(5). pp.677-691.
Tanner, H., Jones, S. and Davies, A., 2020. Developing numeracy in the secondary school: a
practical guide for students and teachers. Routledge.
chevron_up_icon
1 out of 12
circle_padding
hide_on_mobile
zoom_out_icon
[object Object]