A SMART Decision Analysis: Selecting Best Car Brand for the UK Market
VerifiedAdded on 2021/04/19
|13
|2301
|38
Report
AI Summary
This report utilizes the SMART (Simple Multi-Attribute Rating Technique) decision support system to determine the optimal car brand from a selection of four popular UK models: Ford Fiesta, Volkswagen Golf, Nissan Qashqai, and Vauxhall Corsa. The analysis focuses on key attributes including cost, acceleration, and top speed, assigning values and weights to each factor to evaluate the alternatives. The decision-making process involves identifying the decision-maker, defining alternative actions, identifying relevant attributes, assigning values to measure performance, determining attribute weights, calculating weighted averages, and making a provisional decision. Through this structured approach, the report concludes that the Vauxhall Corsa emerges as the most suitable car, offering a balance of cost efficiency and speed. Sensitivity analysis is performed to validate the findings, offering insights into how changes in attribute weights impact the final decision. The report includes detailed tables and figures to support the analysis and provides references to relevant sources.
Running head: SMART DECISION ANALYSIS
SMART decision analysis for choosing best brand of car
Student Name:
University Name:
SMART decision analysis for choosing best brand of car
Student Name:
University Name:
Paraphrase This Document
Need a fresh take? Get an instant paraphrase of this document with our AI Paraphraser
1SMART DECISION ANALYSIS
Introduction
The SMART (Simple Multi-Attribute Rating Technique) has been used as the decision support
system in context to this study to choose the best brand of car. The list of the vehicles that have
been chosen for this analysis are presented below which illustrates upon four different types of
car brands such as Ford, Volkswagen, Nissan and Vauxhall.
1. Ford Fiesta – Ranked first in the list of bestselling cars of UK with 56,415 registrations.
2. Volkswagen Golf – Ranked second in the list of bestselling cars of UK with 39,930
registrations.
3. Nissan Qashqai – Ranked fourth in the list of bestselling cars of UK with 30,0667
registrations.
4. Vauxhall Corsa – Ranked fifth in the list of bestselling cars of UK with 28,003
registrations (Best-selling cars in the UK 2018).
For this analysis, information has been gathered from different sources such as journals, articles
as well as websites. As a decision maker, I would prefer to choose the most cost efficient with
better acceleration or top speed car.
SMART Analysis
1. Identification of the Decision Maker
I (Chiemeka Anyadike) is the decision maker for the chosen topic to select the best brand of car.
2. Identification of the alternative courses of action
The alternative courses of action for this SMART analysis is to choose the best brand of car
based on some factors such as Space and Comfort of the chosen vehicles. However, the analysis
here has been carried out by taking Cost and Speed as the main factors for choosing best brand
of car.
2SMART DECISION ANALYSIS
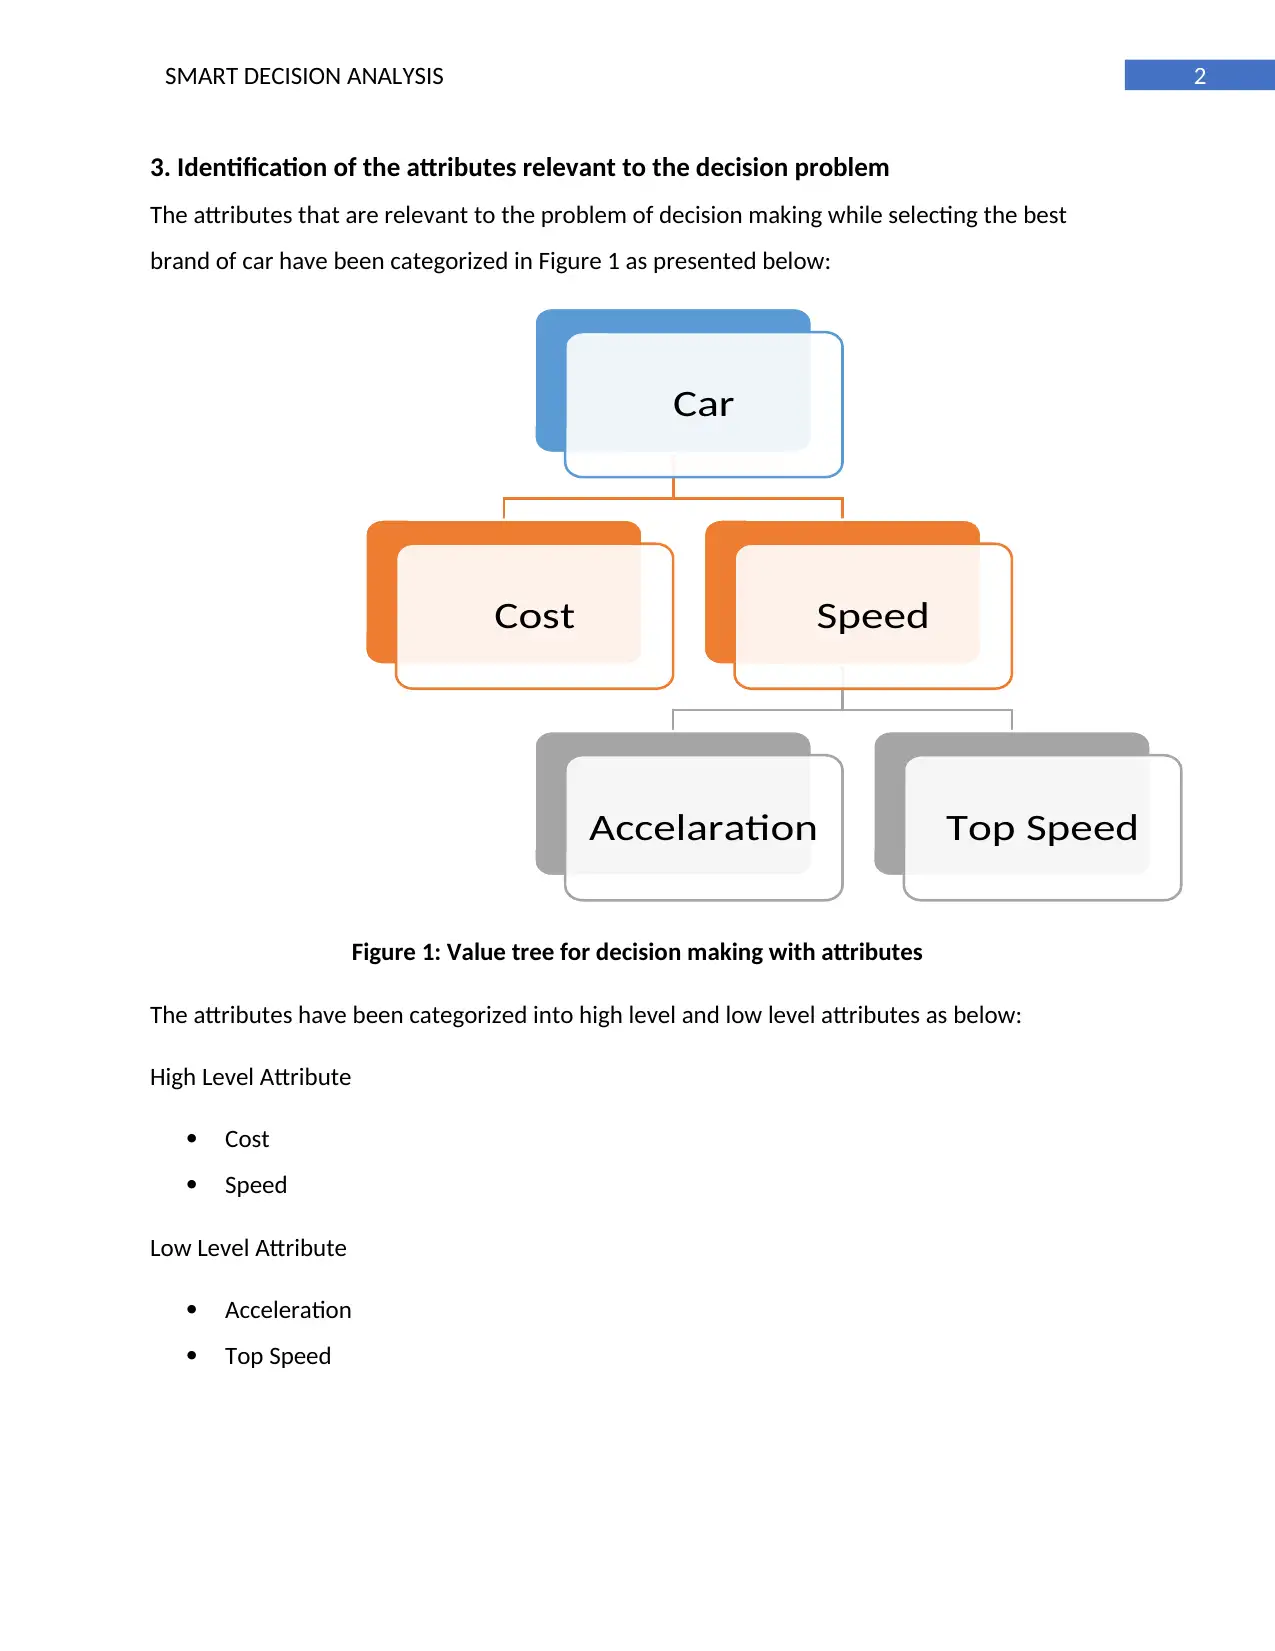
3. Identification of the attributes relevant to the decision problem
The attributes that are relevant to the problem of decision making while selecting the best
brand of car have been categorized in Figure 1 as presented below:
Figure 1: Value tree for decision making with attributes
The attributes have been categorized into high level and low level attributes as below:
High Level Attribute
Cost
Speed
Low Level Attribute
Acceleration
Top Speed
Car
Cost Speed
Accelaration Top Speed
⊘ This is a preview!⊘
Do you want full access?
Subscribe today to unlock all pages.
Trusted by 1+ million students worldwide
3SMART DECISION ANALYSIS
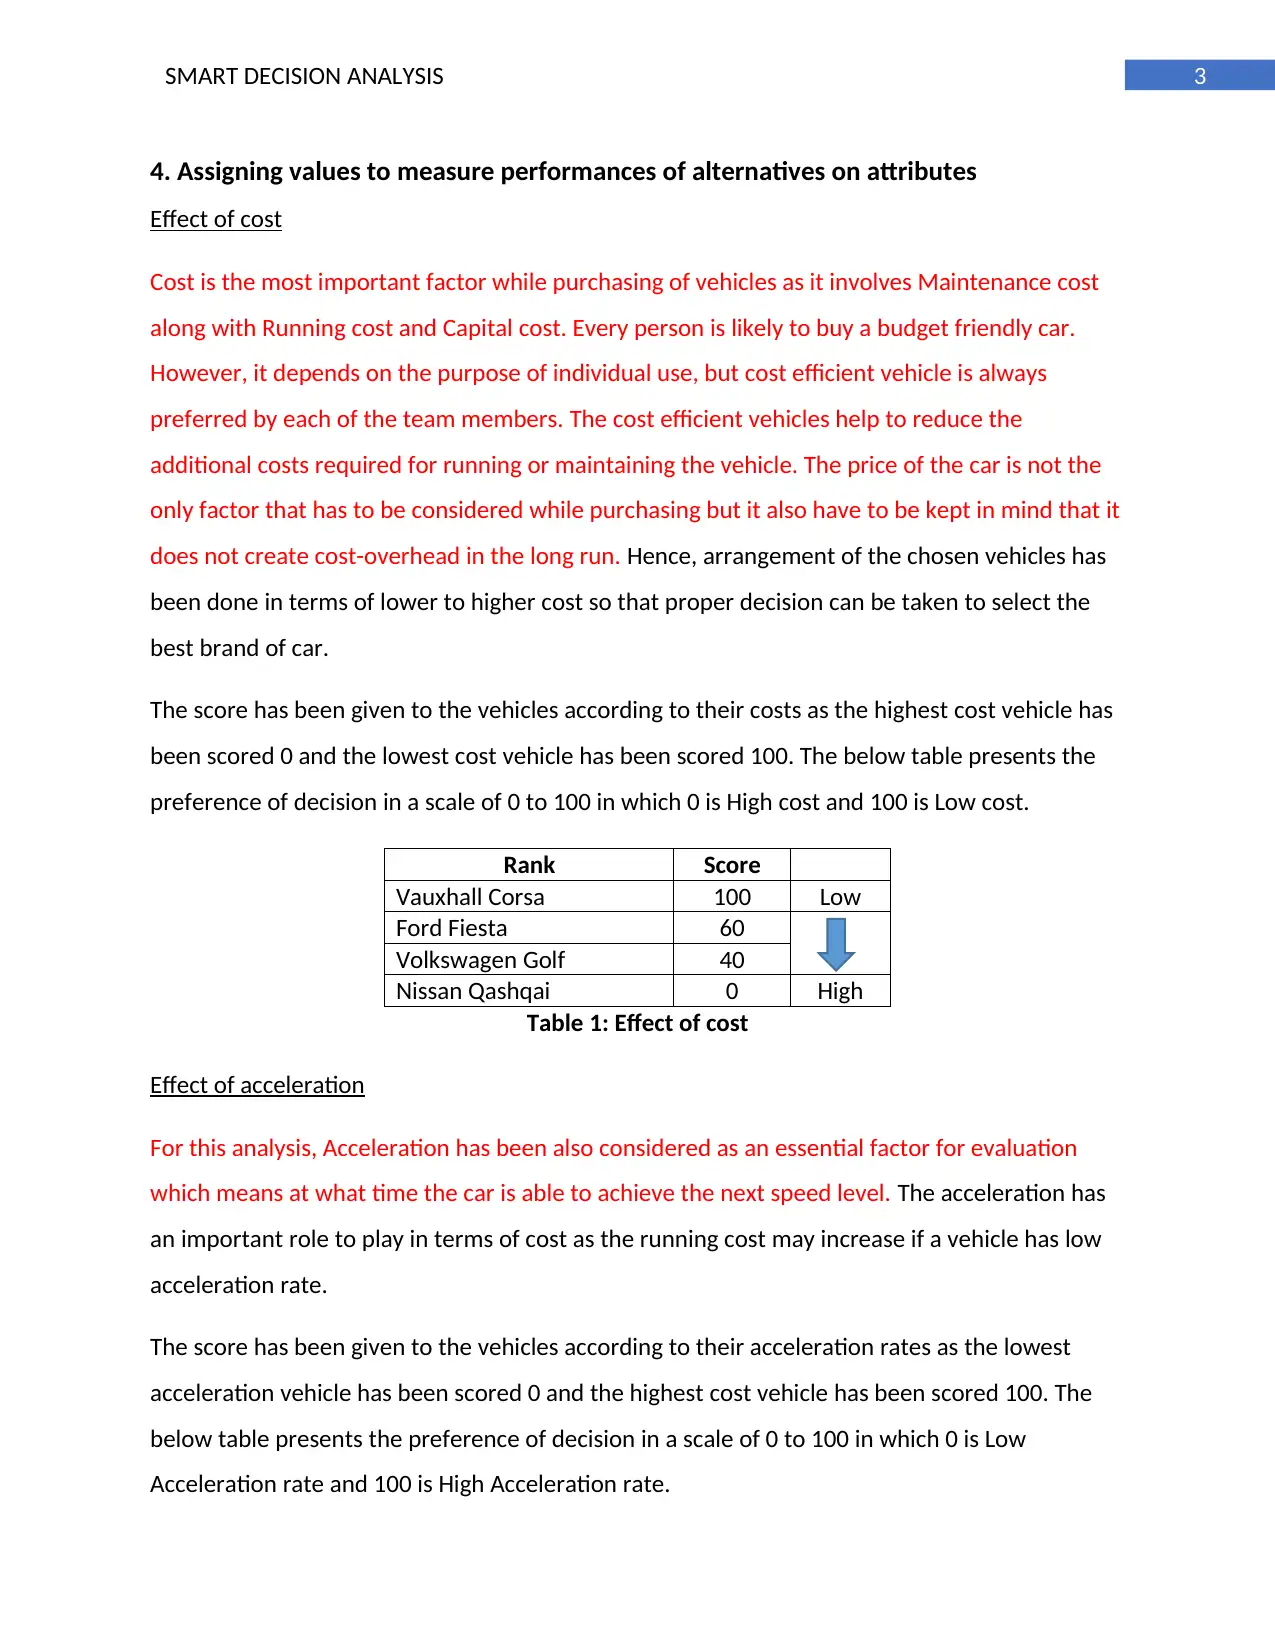
4. Assigning values to measure performances of alternatives on attributes
Effect of cost
Cost is the most important factor while purchasing of vehicles as it involves Maintenance cost
along with Running cost and Capital cost. Every person is likely to buy a budget friendly car.
However, it depends on the purpose of individual use, but cost efficient vehicle is always
preferred by each of the team members. The cost efficient vehicles help to reduce the
additional costs required for running or maintaining the vehicle. The price of the car is not the
only factor that has to be considered while purchasing but it also have to be kept in mind that it
does not create cost-overhead in the long run. Hence, arrangement of the chosen vehicles has
been done in terms of lower to higher cost so that proper decision can be taken to select the
best brand of car.
The score has been given to the vehicles according to their costs as the highest cost vehicle has
been scored 0 and the lowest cost vehicle has been scored 100. The below table presents the
preference of decision in a scale of 0 to 100 in which 0 is High cost and 100 is Low cost.
Rank Score
Vauxhall Corsa 100 Low
Ford Fiesta 60
Volkswagen Golf 40
Nissan Qashqai 0 High
Table 1: Effect of cost
Effect of acceleration
For this analysis, Acceleration has been also considered as an essential factor for evaluation
which means at what time the car is able to achieve the next speed level. The acceleration has
an important role to play in terms of cost as the running cost may increase if a vehicle has low
acceleration rate.
The score has been given to the vehicles according to their acceleration rates as the lowest
acceleration vehicle has been scored 0 and the highest cost vehicle has been scored 100. The
below table presents the preference of decision in a scale of 0 to 100 in which 0 is Low
Acceleration rate and 100 is High Acceleration rate.
Paraphrase This Document
Need a fresh take? Get an instant paraphrase of this document with our AI Paraphraser
4SMART DECISION ANALYSIS
Rank Acceleration (in Sec) Utility Value
Nissan Qashqai 9.1 100
Volkswagen Golf 9.3 70
Vauxhall Corsa 10.3 45
Ford Fiesta 11.2 0
Table 2: Effect of acceleration
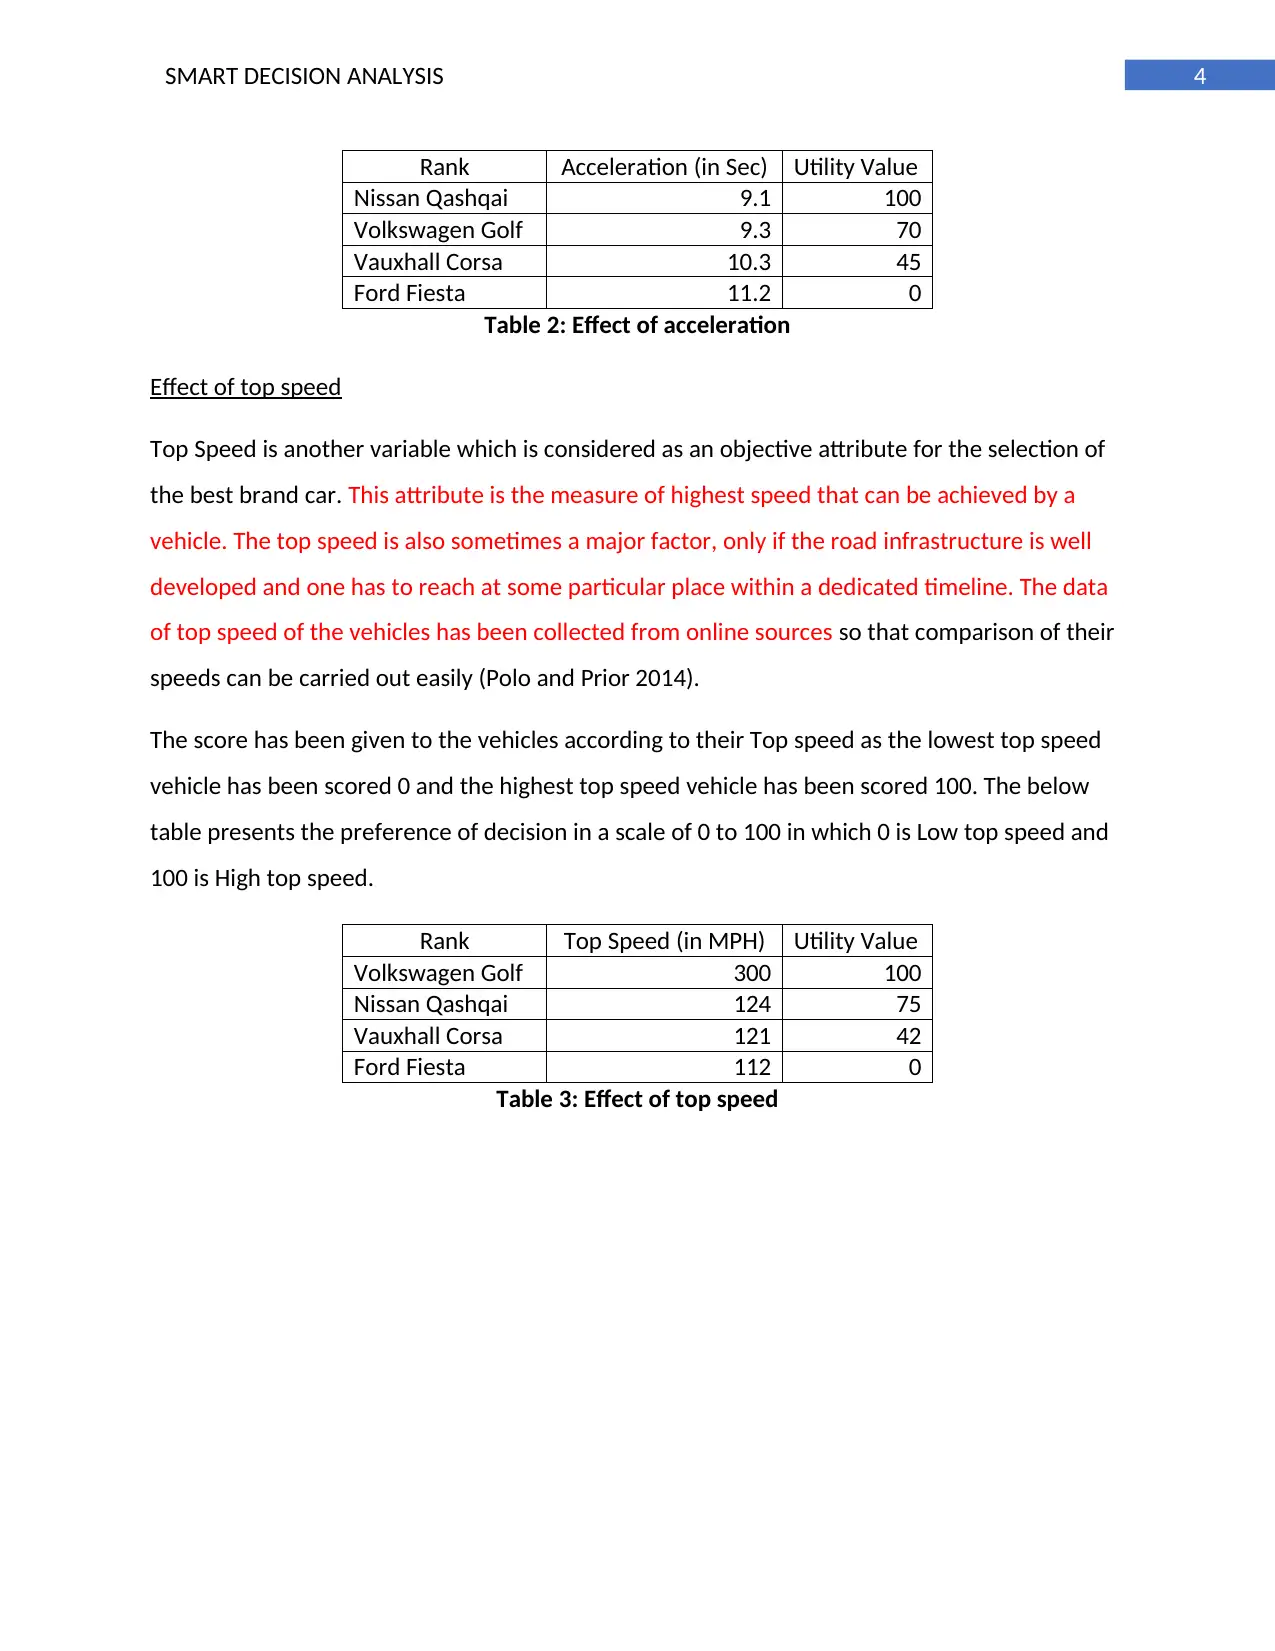
Effect of top speed
Top Speed is another variable which is considered as an objective attribute for the selection of
the best brand car. This attribute is the measure of highest speed that can be achieved by a
vehicle. The top speed is also sometimes a major factor, only if the road infrastructure is well
developed and one has to reach at some particular place within a dedicated timeline. The data
of top speed of the vehicles has been collected from online sources so that comparison of their
speeds can be carried out easily (Polo and Prior 2014).
The score has been given to the vehicles according to their Top speed as the lowest top speed
vehicle has been scored 0 and the highest top speed vehicle has been scored 100. The below
table presents the preference of decision in a scale of 0 to 100 in which 0 is Low top speed and
100 is High top speed.
Rank Top Speed (in MPH) Utility Value
Volkswagen Golf 300 100
Nissan Qashqai 124 75
Vauxhall Corsa 121 42
Ford Fiesta 112 0
Table 3: Effect of top speed
Rank Acceleration (in Sec) Utility Value
Nissan Qashqai 9.1 100
Volkswagen Golf 9.3 70
Vauxhall Corsa 10.3 45
Ford Fiesta 11.2 0
Table 2: Effect of acceleration
Effect of top speed
Top Speed is another variable which is considered as an objective attribute for the selection of
the best brand car. This attribute is the measure of highest speed that can be achieved by a
vehicle. The top speed is also sometimes a major factor, only if the road infrastructure is well
developed and one has to reach at some particular place within a dedicated timeline. The data
of top speed of the vehicles has been collected from online sources so that comparison of their
speeds can be carried out easily (Polo and Prior 2014).
The score has been given to the vehicles according to their Top speed as the lowest top speed
vehicle has been scored 0 and the highest top speed vehicle has been scored 100. The below
table presents the preference of decision in a scale of 0 to 100 in which 0 is Low top speed and
100 is High top speed.
Rank Top Speed (in MPH) Utility Value
Volkswagen Golf 300 100
Nissan Qashqai 124 75
Vauxhall Corsa 121 42
Ford Fiesta 112 0
Table 3: Effect of top speed
5SMART DECISION ANALYSIS
100 150 200 250 300 350
0
20
40
60
80
100
120
Value function for Vehicle Top Speed
Top Speed (in MPH)
Rank Value
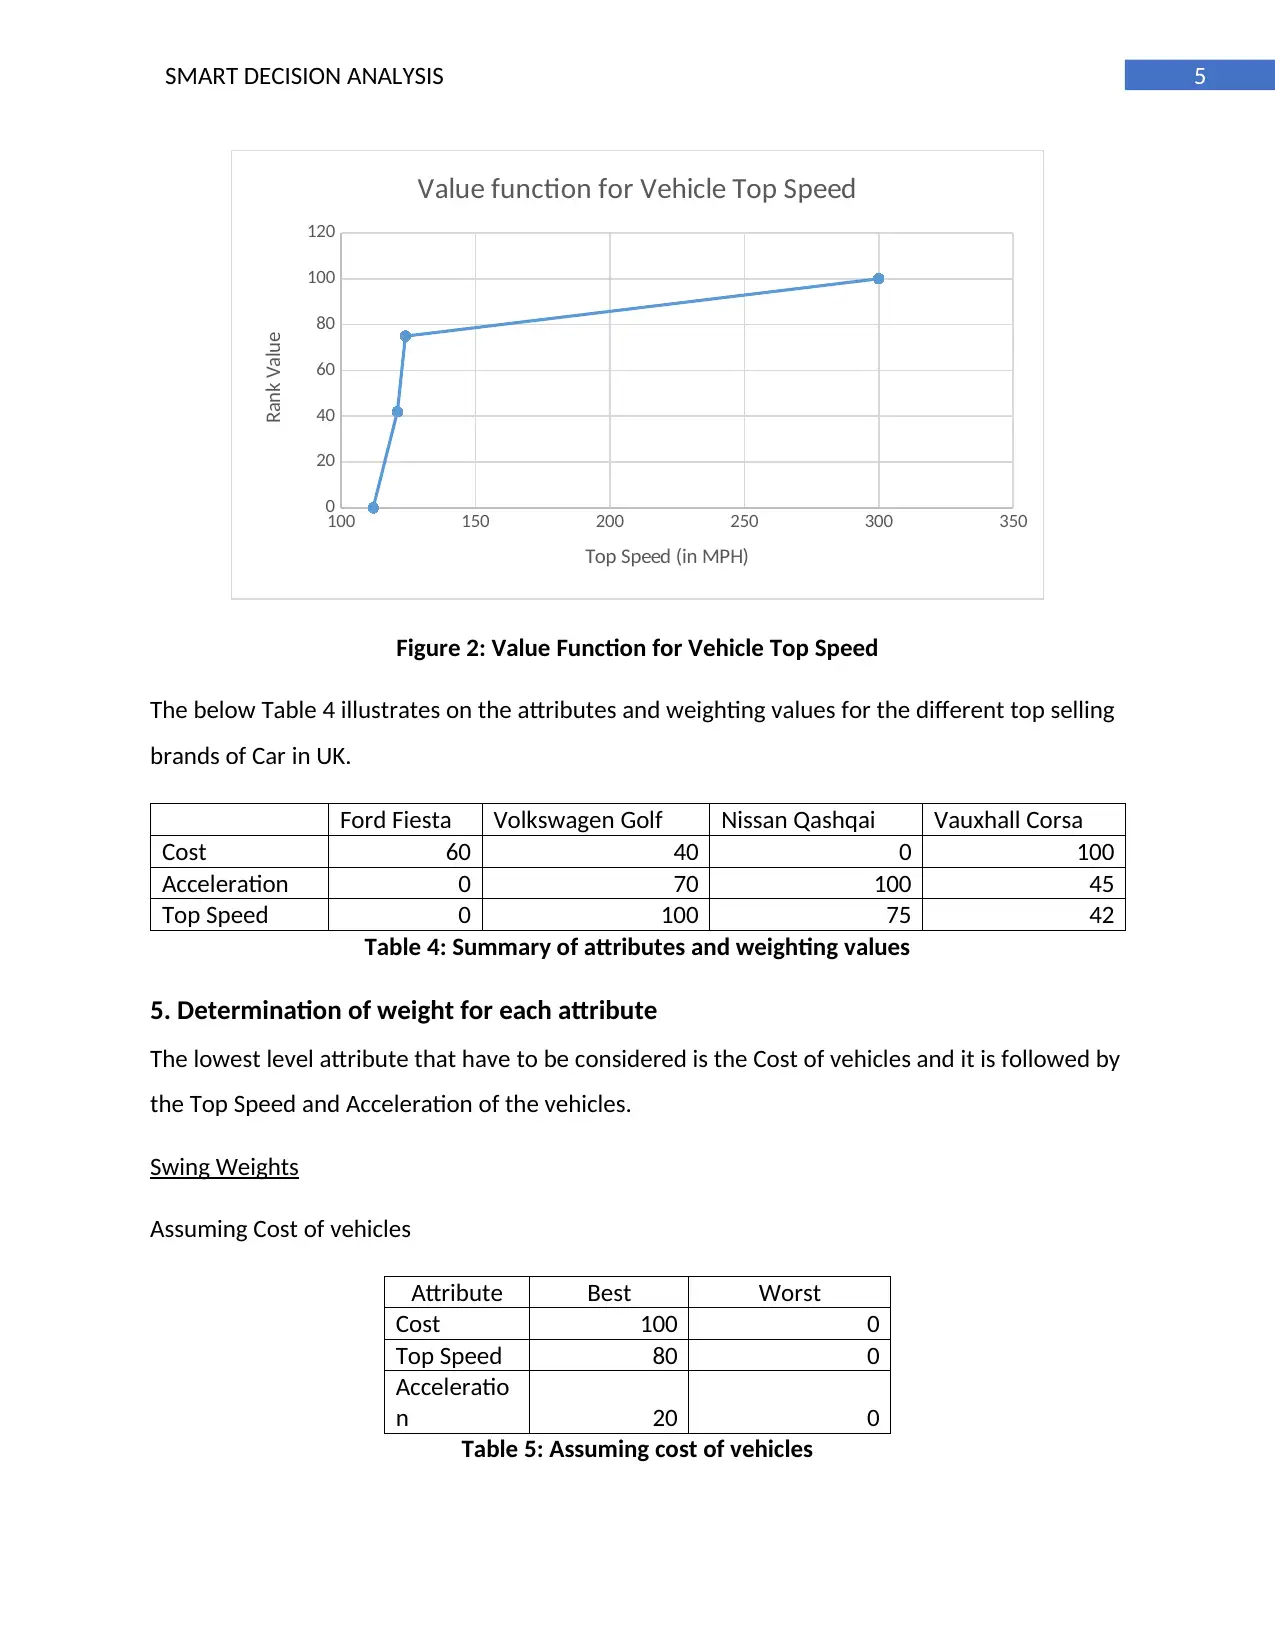
Figure 2: Value Function for Vehicle Top Speed
The below Table 4 illustrates on the attributes and weighting values for the different top selling
brands of Car in UK.
Ford Fiesta Volkswagen Golf Nissan Qashqai Vauxhall Corsa
Cost 60 40 0 100
Acceleration 0 70 100 45
Top Speed 0 100 75 42
Table 4: Summary of attributes and weighting values
5. Determination of weight for each attribute
The lowest level attribute that have to be considered is the Cost of vehicles and it is followed by
the Top Speed and Acceleration of the vehicles.
Swing Weights
Assuming Cost of vehicles
Attribute Best Worst
Cost 100 0
Top Speed 80 0
Acceleratio
n 20 0
Table 5: Assuming cost of vehicles
100 150 200 250 300 350
0
20
40
60
80
100
120
Value function for Vehicle Top Speed
Top Speed (in MPH)
Rank Value
Figure 2: Value Function for Vehicle Top Speed
The below Table 4 illustrates on the attributes and weighting values for the different top selling
brands of Car in UK.
Ford Fiesta Volkswagen Golf Nissan Qashqai Vauxhall Corsa
Cost 60 40 0 100
Acceleration 0 70 100 45
Top Speed 0 100 75 42
Table 4: Summary of attributes and weighting values
5. Determination of weight for each attribute
The lowest level attribute that have to be considered is the Cost of vehicles and it is followed by
the Top Speed and Acceleration of the vehicles.
Swing Weights
Assuming Cost of vehicles
Attribute Best Worst
Cost 100 0
Top Speed 80 0
Acceleratio
n 20 0
Table 5: Assuming cost of vehicles
⊘ This is a preview!⊘
Do you want full access?
Subscribe today to unlock all pages.
Trusted by 1+ million students worldwide
6SMART DECISION ANALYSIS
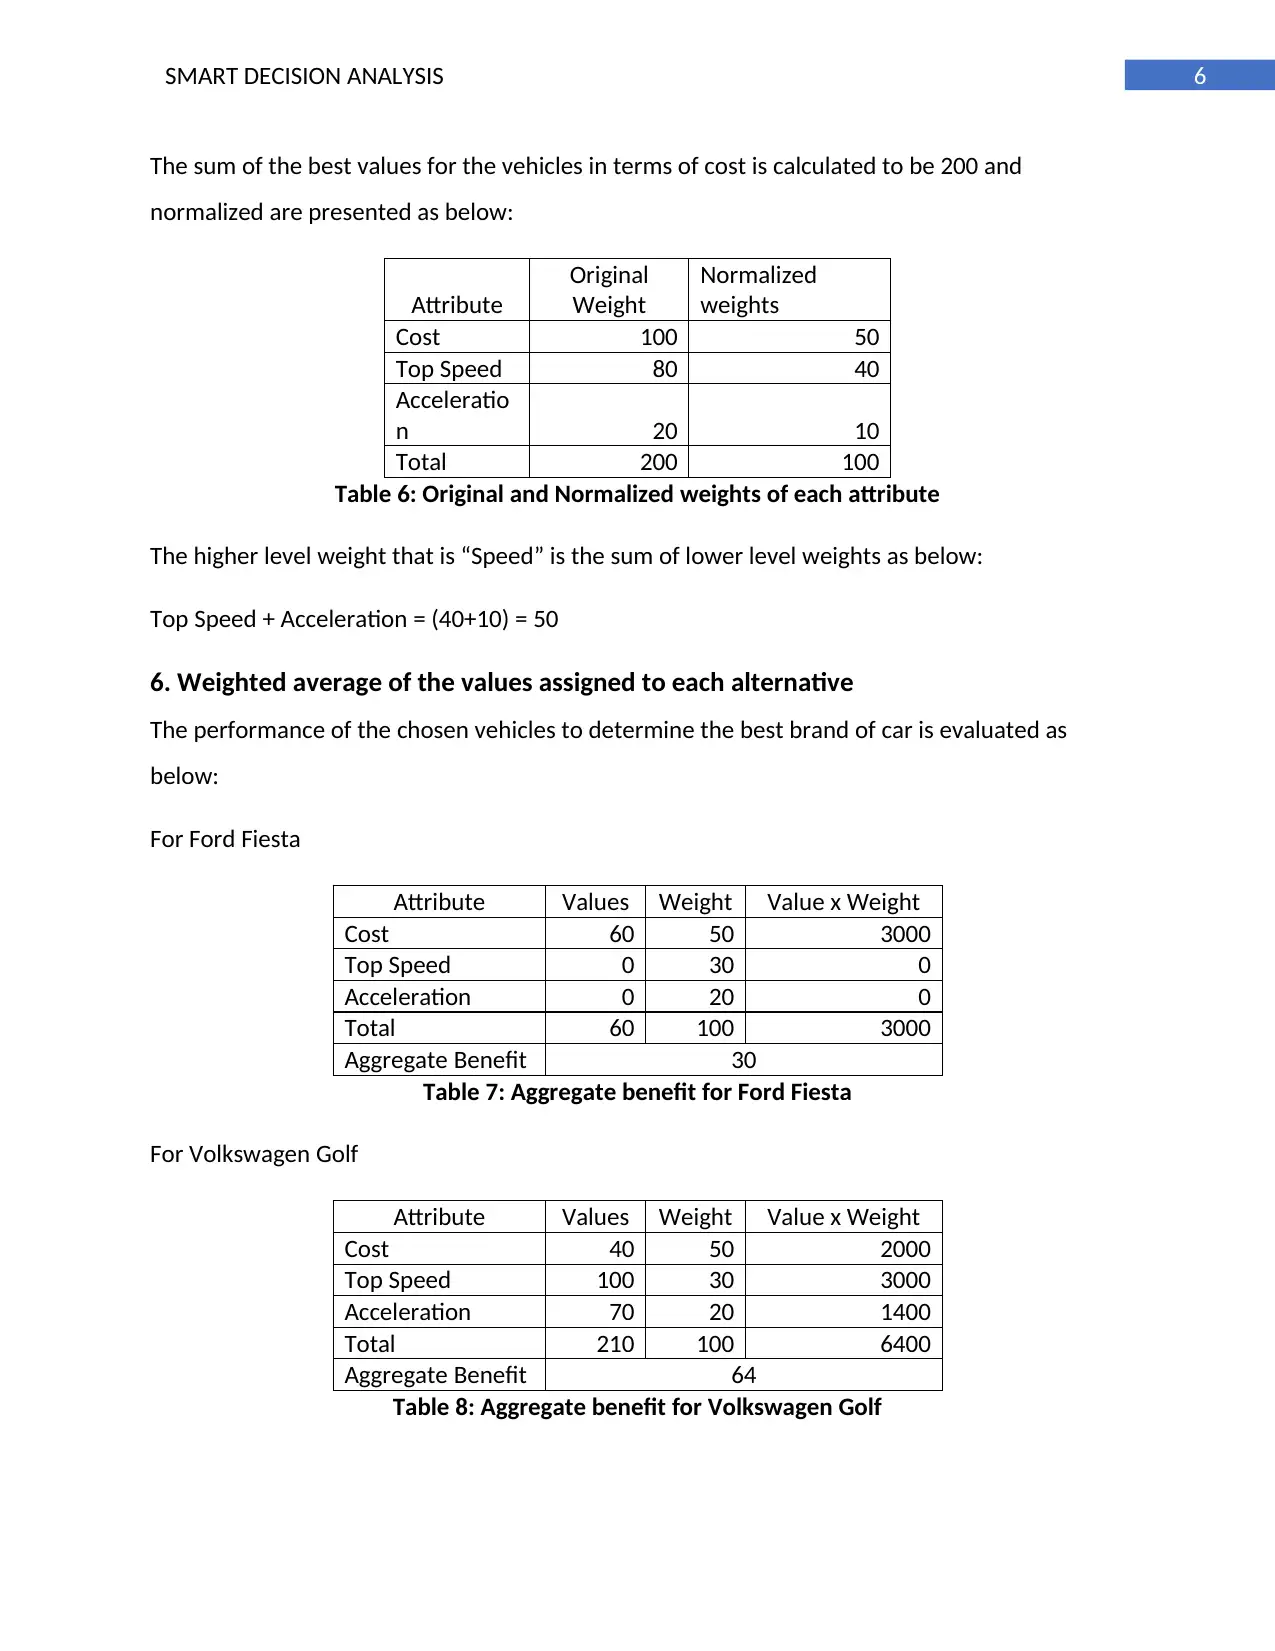
The sum of the best values for the vehicles in terms of cost is calculated to be 200 and
normalized are presented as below:
Attribute
Original
Weight
Normalized
weights
Cost 100 50
Top Speed 80 40
Acceleratio
n 20 10
Total 200 100
Table 6: Original and Normalized weights of each attribute
The higher level weight that is “Speed” is the sum of lower level weights as below:
Top Speed + Acceleration = (40+10) = 50
6. Weighted average of the values assigned to each alternative
The performance of the chosen vehicles to determine the best brand of car is evaluated as
below:
For Ford Fiesta
Attribute Values Weight Value x Weight
Cost 60 50 3000
Top Speed 0 30 0
Acceleration 0 20 0
Total 60 100 3000
Aggregate Benefit 30
Table 7: Aggregate benefit for Ford Fiesta
For Volkswagen Golf
Attribute Values Weight Value x Weight
Cost 40 50 2000
Top Speed 100 30 3000
Acceleration 70 20 1400
Total 210 100 6400
Aggregate Benefit 64
Table 8: Aggregate benefit for Volkswagen Golf
Paraphrase This Document
Need a fresh take? Get an instant paraphrase of this document with our AI Paraphraser
7SMART DECISION ANALYSIS
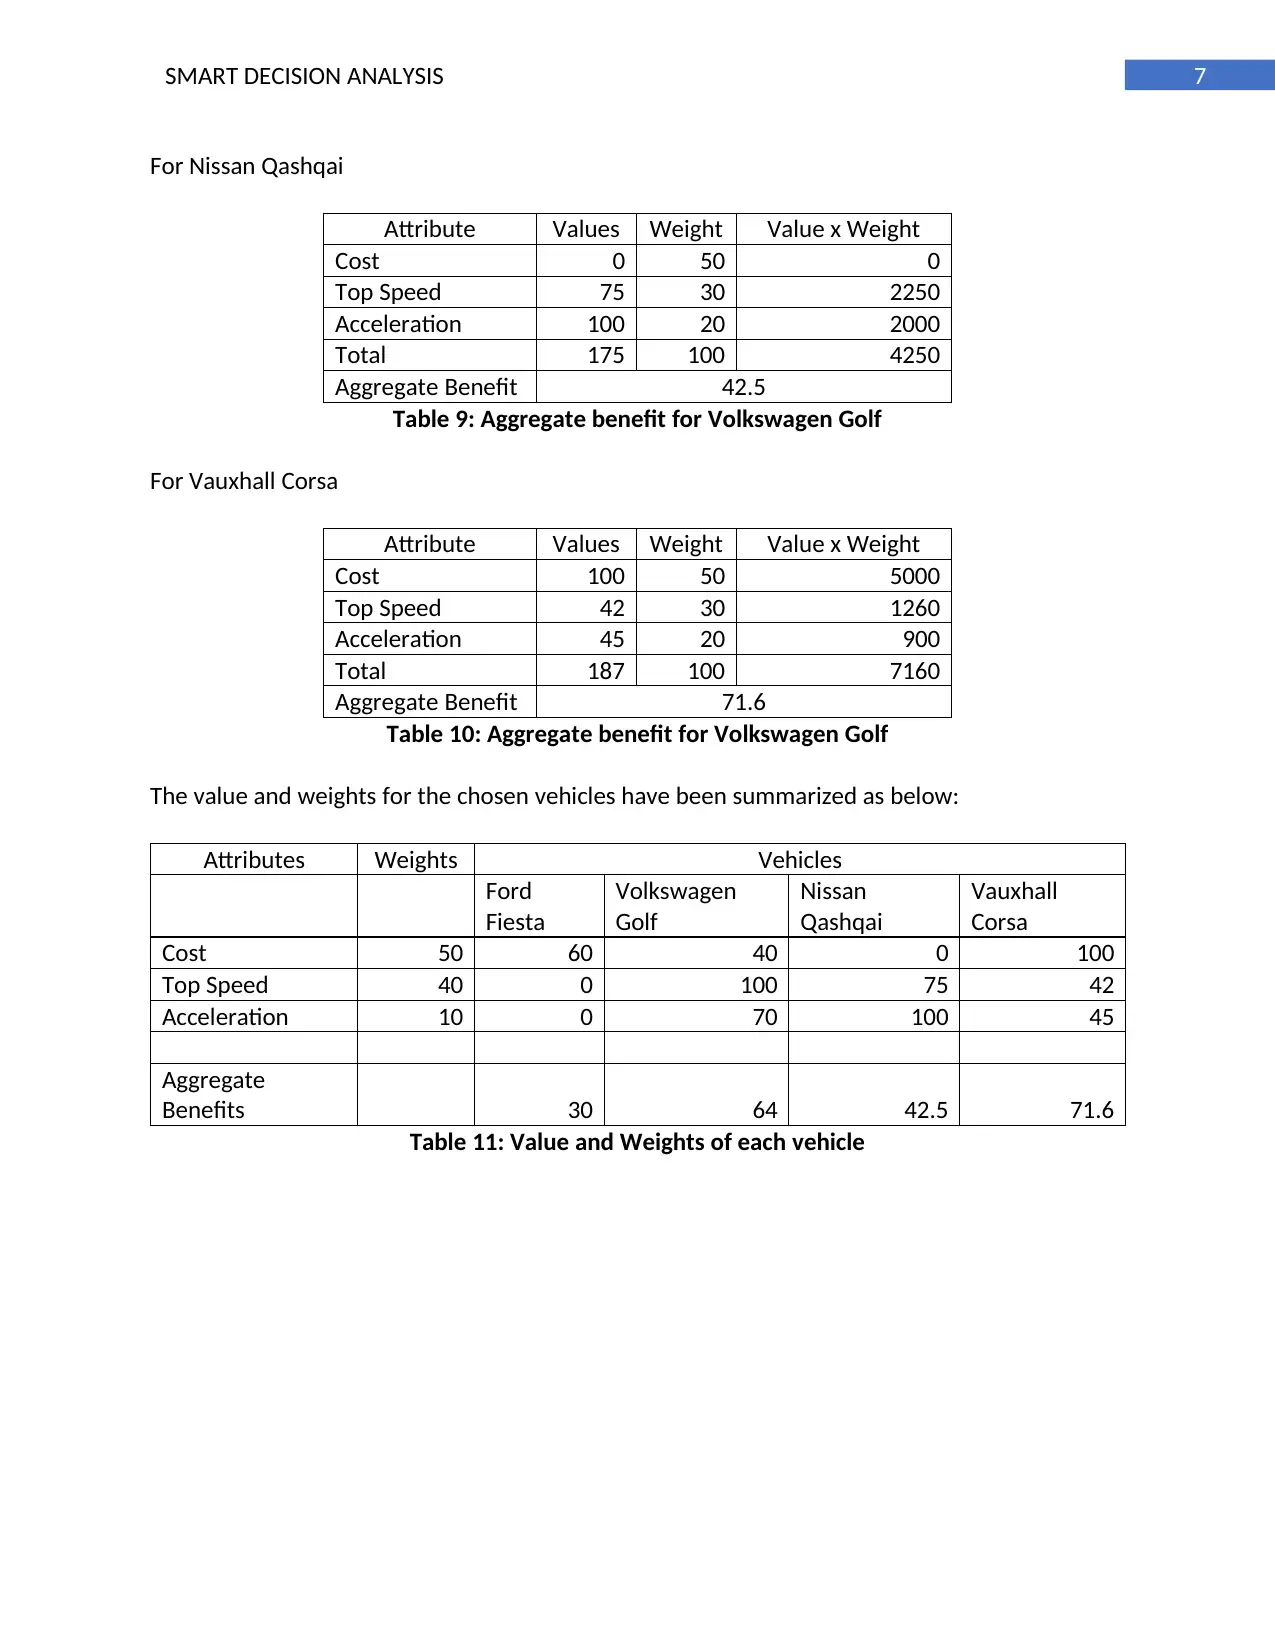
For Nissan Qashqai
Attribute Values Weight Value x Weight
Cost 0 50 0
Top Speed 75 30 2250
Acceleration 100 20 2000
Total 175 100 4250
Aggregate Benefit 42.5
Table 9: Aggregate benefit for Volkswagen Golf
For Vauxhall Corsa
Attribute Values Weight Value x Weight
Cost 100 50 5000
Top Speed 42 30 1260
Acceleration 45 20 900
Total 187 100 7160
Aggregate Benefit 71.6
Table 10: Aggregate benefit for Volkswagen Golf
The value and weights for the chosen vehicles have been summarized as below:
Attributes Weights Vehicles
Ford
Fiesta
Volkswagen
Golf
Nissan
Qashqai
Vauxhall
Corsa
Cost 50 60 40 0 100
Top Speed 40 0 100 75 42
Acceleration 10 0 70 100 45
Aggregate
Benefits 30 64 42.5 71.6
Table 11: Value and Weights of each vehicle
8SMART DECISION ANALYSIS
Ford Fiesta Volkswagen Golf Nissan Qashqai Vauxhall Corsa
0
20
40
60
80
100
120
Graph of Aggregated Benefits against Cost for
vehicles
Cost Aggregate Benefits
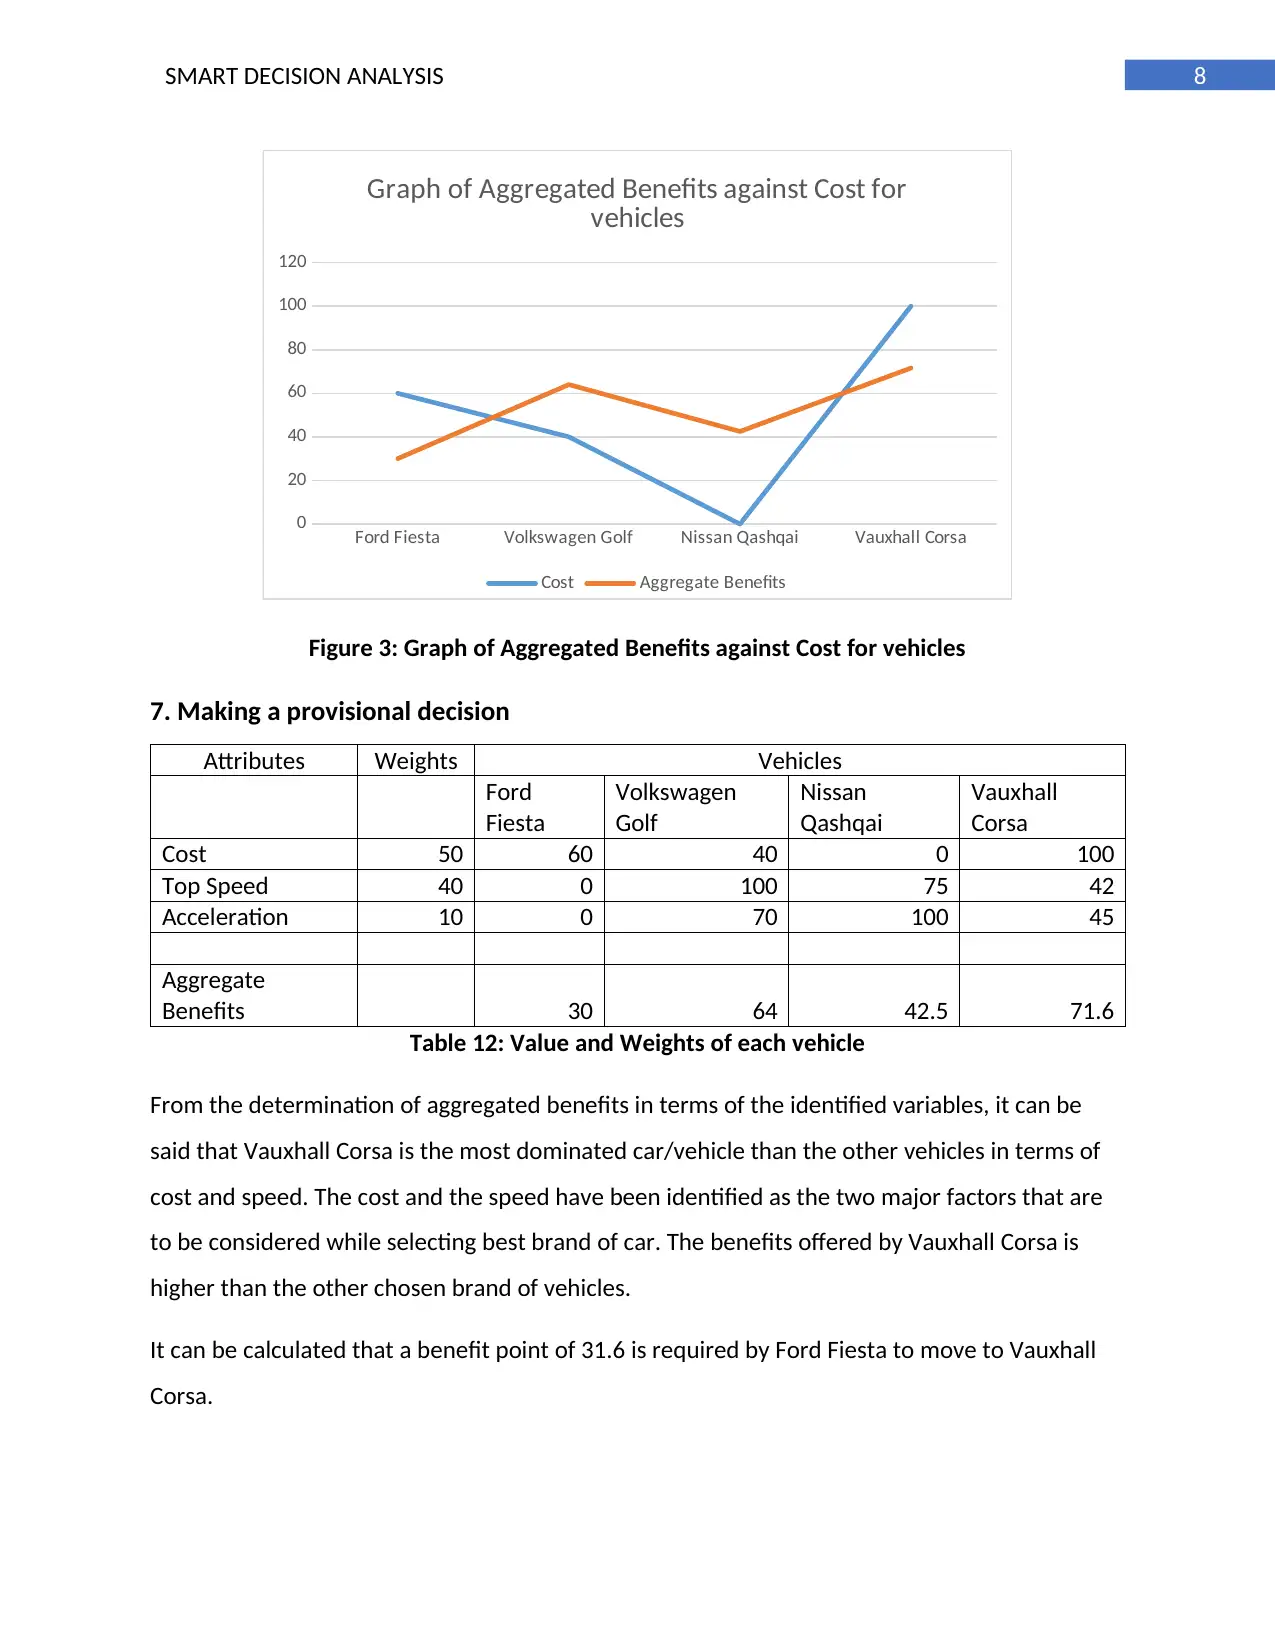
Figure 3: Graph of Aggregated Benefits against Cost for vehicles
7. Making a provisional decision
Attributes Weights Vehicles
Ford
Fiesta
Volkswagen
Golf
Nissan
Qashqai
Vauxhall
Corsa
Cost 50 60 40 0 100
Top Speed 40 0 100 75 42
Acceleration 10 0 70 100 45
Aggregate
Benefits 30 64 42.5 71.6
Table 12: Value and Weights of each vehicle
From the determination of aggregated benefits in terms of the identified variables, it can be
said that Vauxhall Corsa is the most dominated car/vehicle than the other vehicles in terms of
cost and speed. The cost and the speed have been identified as the two major factors that are
to be considered while selecting best brand of car. The benefits offered by Vauxhall Corsa is
higher than the other chosen brand of vehicles.
It can be calculated that a benefit point of 31.6 is required by Ford Fiesta to move to Vauxhall
Corsa.
Ford Fiesta Volkswagen Golf Nissan Qashqai Vauxhall Corsa
0
20
40
60
80
100
120
Graph of Aggregated Benefits against Cost for
vehicles
Cost Aggregate Benefits
Figure 3: Graph of Aggregated Benefits against Cost for vehicles
7. Making a provisional decision
Attributes Weights Vehicles
Ford
Fiesta
Volkswagen
Golf
Nissan
Qashqai
Vauxhall
Corsa
Cost 50 60 40 0 100
Top Speed 40 0 100 75 42
Acceleration 10 0 70 100 45
Aggregate
Benefits 30 64 42.5 71.6
Table 12: Value and Weights of each vehicle
From the determination of aggregated benefits in terms of the identified variables, it can be
said that Vauxhall Corsa is the most dominated car/vehicle than the other vehicles in terms of
cost and speed. The cost and the speed have been identified as the two major factors that are
to be considered while selecting best brand of car. The benefits offered by Vauxhall Corsa is
higher than the other chosen brand of vehicles.
It can be calculated that a benefit point of 31.6 is required by Ford Fiesta to move to Vauxhall
Corsa.
⊘ This is a preview!⊘
Do you want full access?
Subscribe today to unlock all pages.
Trusted by 1+ million students worldwide
9SMART DECISION ANALYSIS
A benefit point of 7.6 is required by Volkswagen Golf to move to Vauxhall Corsa but it lacks in
terms of cost as the cost of Volkswagen Golf is much higher than Vauxhall Corsa.
Further, a benefit point of 29.1 is required by Nissan Qashqai to move to Vauxhall Corsa but it is
not possible to achieve as Nissan Qashqai has a score of 0 for cost as it is the costliest car in the
list of chosen vehicles.
Hence, it can be said that Vauxhall Corsa is the suitable car in terms of cost efficiency as well as
speed.
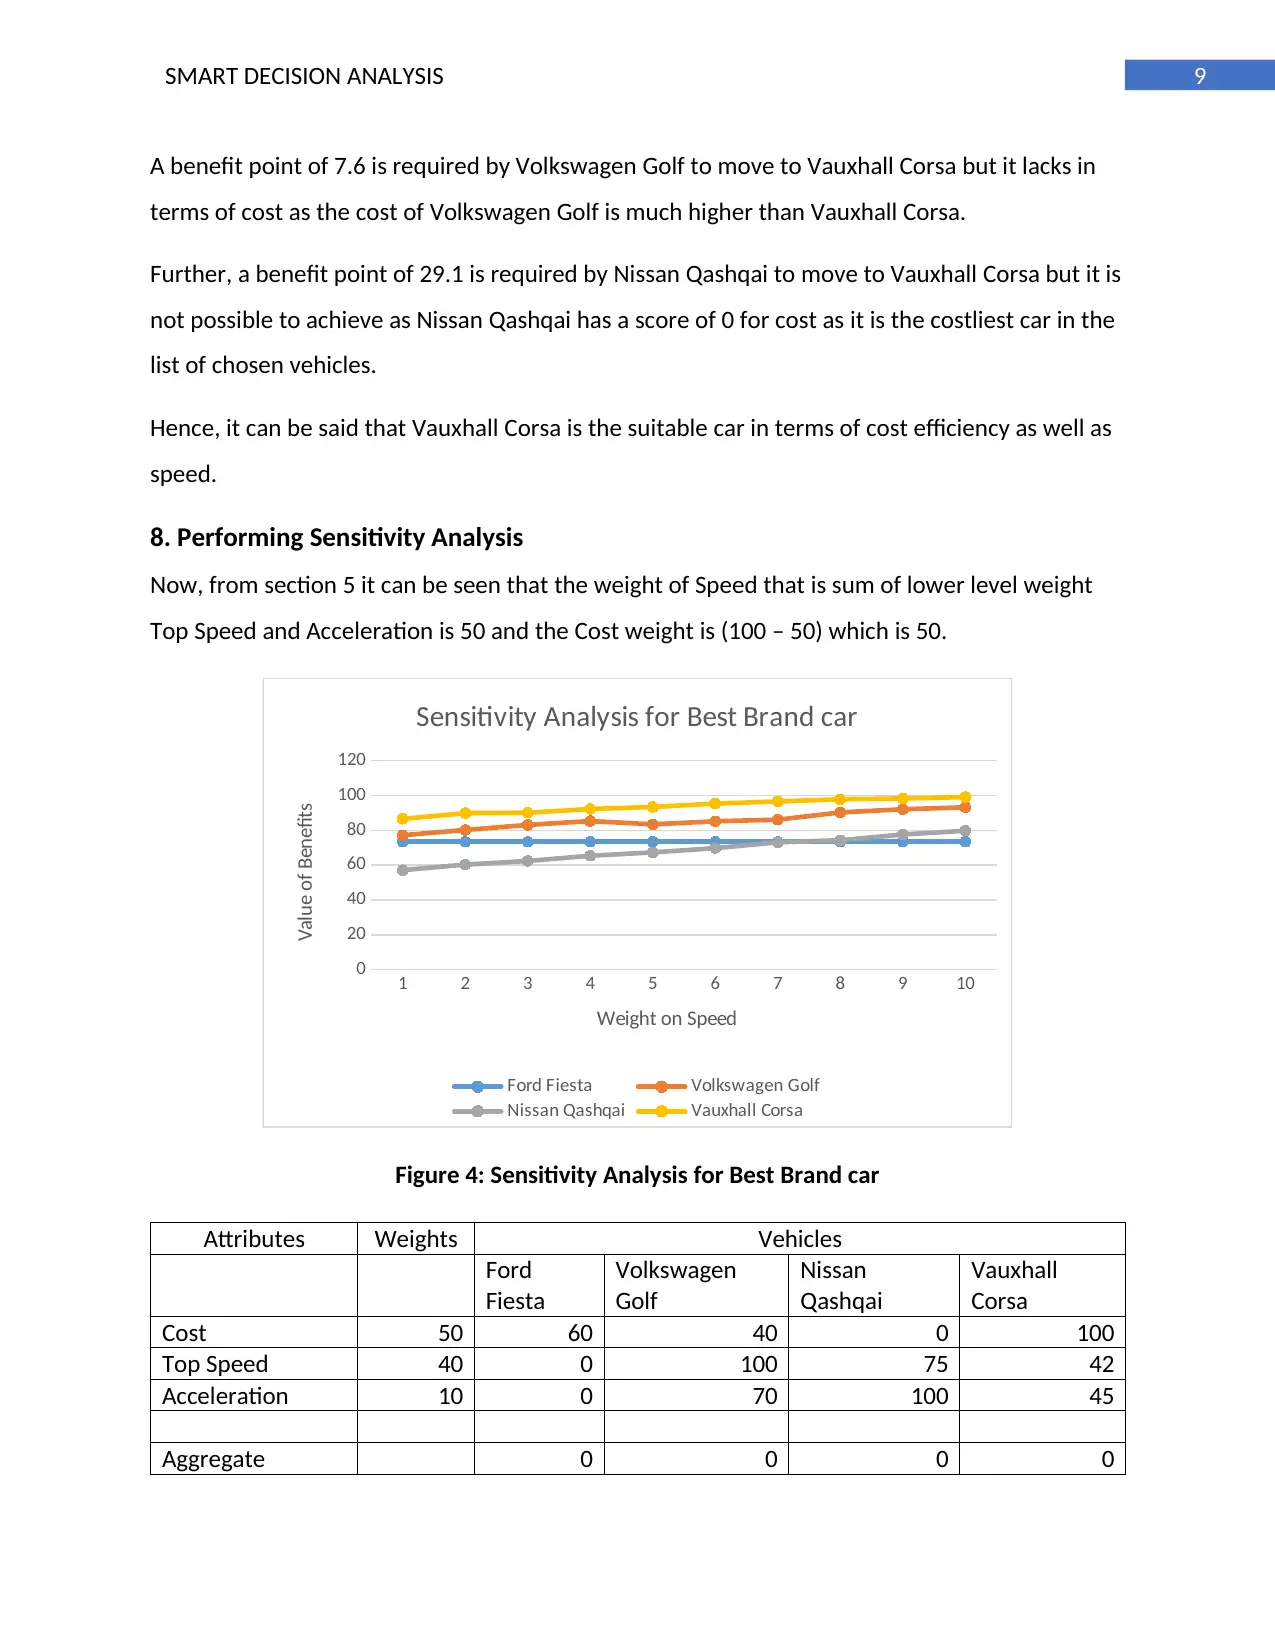
8. Performing Sensitivity Analysis
Now, from section 5 it can be seen that the weight of Speed that is sum of lower level weight
Top Speed and Acceleration is 50 and the Cost weight is (100 – 50) which is 50.
1 2 3 4 5 6 7 8 9 10
0
20
40
60
80
100
120
Sensitivity Analysis for Best Brand car
Ford Fiesta Volkswagen Golf
Nissan Qashqai Vauxhall Corsa
Weight on Speed
Value of Benefits
Figure 4: Sensitivity Analysis for Best Brand car
Attributes Weights Vehicles
Ford
Fiesta
Volkswagen
Golf
Nissan
Qashqai
Vauxhall
Corsa
Cost 50 60 40 0 100
Top Speed 40 0 100 75 42
Acceleration 10 0 70 100 45
Aggregate 0 0 0 0
A benefit point of 7.6 is required by Volkswagen Golf to move to Vauxhall Corsa but it lacks in
terms of cost as the cost of Volkswagen Golf is much higher than Vauxhall Corsa.
Further, a benefit point of 29.1 is required by Nissan Qashqai to move to Vauxhall Corsa but it is
not possible to achieve as Nissan Qashqai has a score of 0 for cost as it is the costliest car in the
list of chosen vehicles.
Hence, it can be said that Vauxhall Corsa is the suitable car in terms of cost efficiency as well as
speed.
8. Performing Sensitivity Analysis
Now, from section 5 it can be seen that the weight of Speed that is sum of lower level weight
Top Speed and Acceleration is 50 and the Cost weight is (100 – 50) which is 50.
1 2 3 4 5 6 7 8 9 10
0
20
40
60
80
100
120
Sensitivity Analysis for Best Brand car
Ford Fiesta Volkswagen Golf
Nissan Qashqai Vauxhall Corsa
Weight on Speed
Value of Benefits
Figure 4: Sensitivity Analysis for Best Brand car
Attributes Weights Vehicles
Ford
Fiesta
Volkswagen
Golf
Nissan
Qashqai
Vauxhall
Corsa
Cost 50 60 40 0 100
Top Speed 40 0 100 75 42
Acceleration 10 0 70 100 45
Aggregate 0 0 0 0
Paraphrase This Document
Need a fresh take? Get an instant paraphrase of this document with our AI Paraphraser
10SMART DECISION ANALYSIS
Benefits
Table 13: Value and Weights of each vehicle
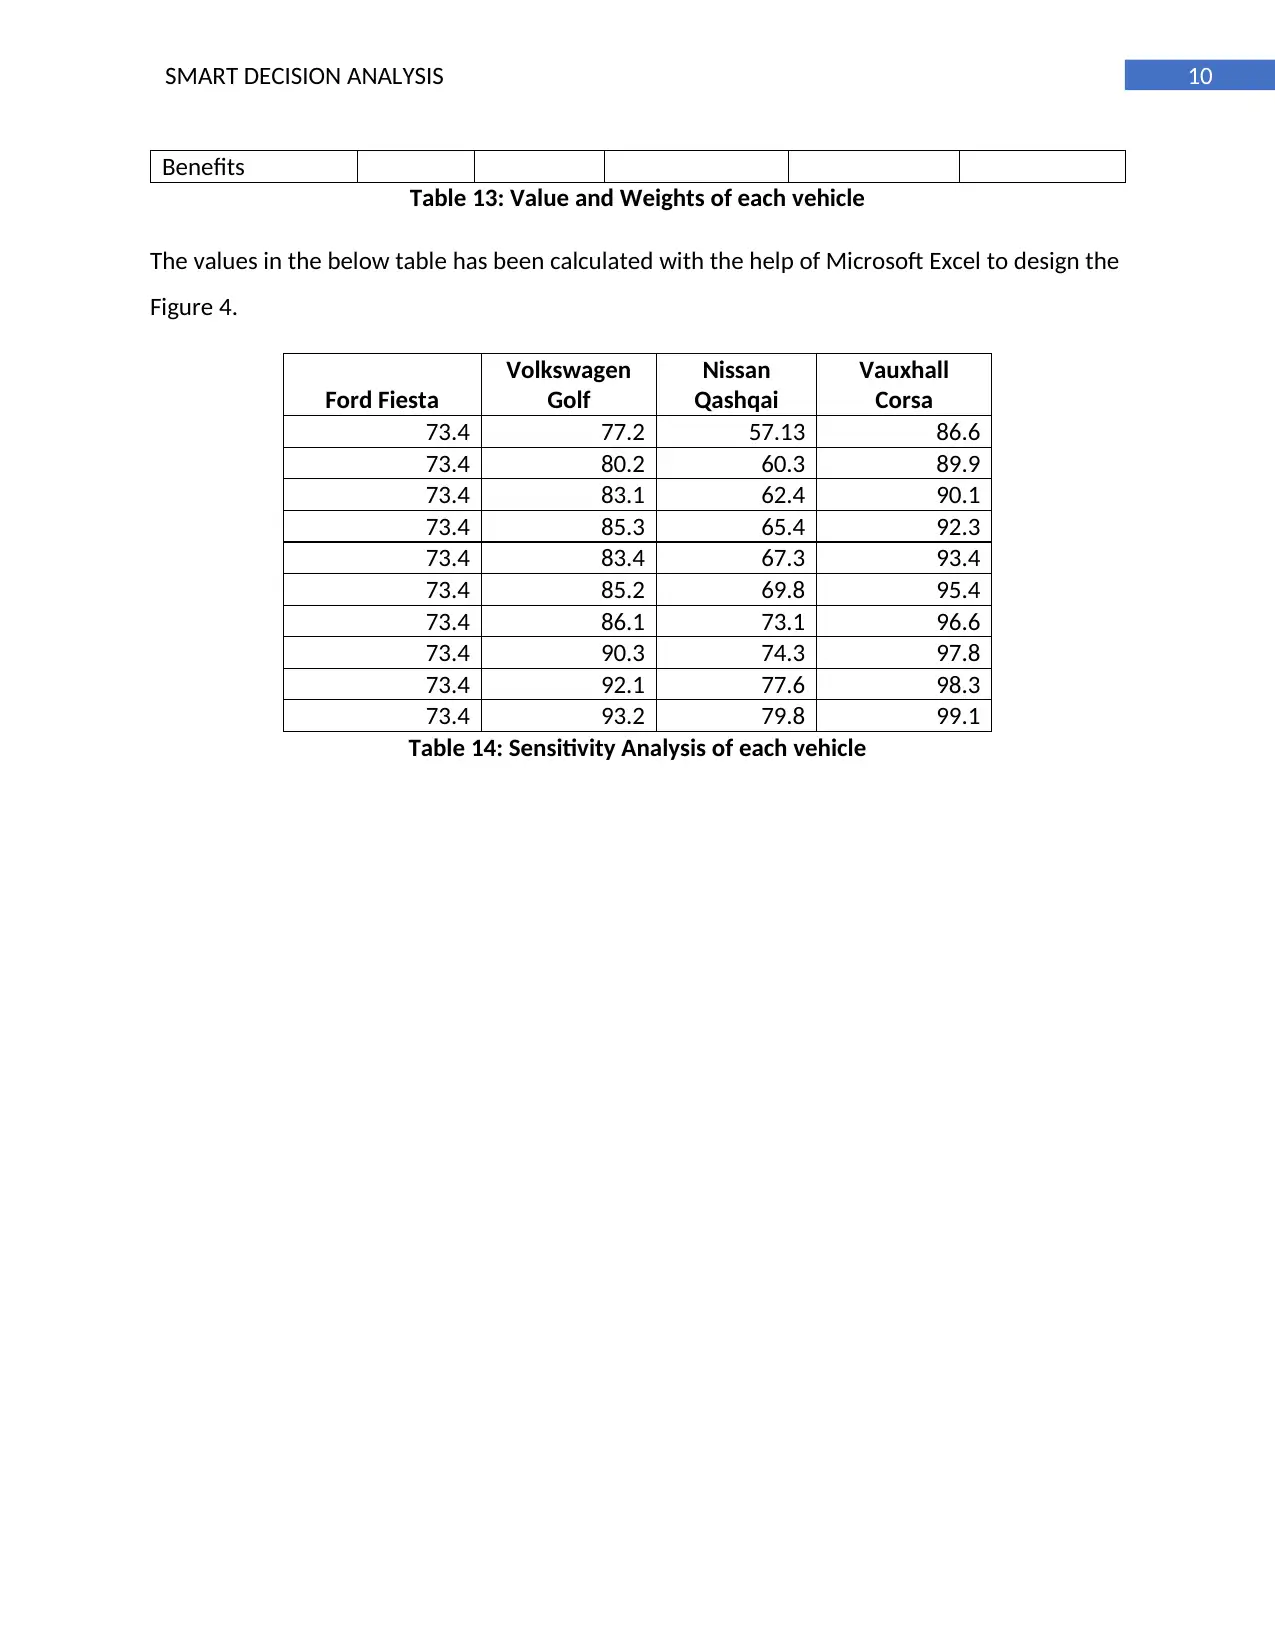
The values in the below table has been calculated with the help of Microsoft Excel to design the
Figure 4.
Ford Fiesta
Volkswagen
Golf
Nissan
Qashqai
Vauxhall
Corsa
73.4 77.2 57.13 86.6
73.4 80.2 60.3 89.9
73.4 83.1 62.4 90.1
73.4 85.3 65.4 92.3
73.4 83.4 67.3 93.4
73.4 85.2 69.8 95.4
73.4 86.1 73.1 96.6
73.4 90.3 74.3 97.8
73.4 92.1 77.6 98.3
73.4 93.2 79.8 99.1
Table 14: Sensitivity Analysis of each vehicle
Benefits
Table 13: Value and Weights of each vehicle
The values in the below table has been calculated with the help of Microsoft Excel to design the
Figure 4.
Ford Fiesta
Volkswagen
Golf
Nissan
Qashqai
Vauxhall
Corsa
73.4 77.2 57.13 86.6
73.4 80.2 60.3 89.9
73.4 83.1 62.4 90.1
73.4 85.3 65.4 92.3
73.4 83.4 67.3 93.4
73.4 85.2 69.8 95.4
73.4 86.1 73.1 96.6
73.4 90.3 74.3 97.8
73.4 92.1 77.6 98.3
73.4 93.2 79.8 99.1
Table 14: Sensitivity Analysis of each vehicle
11SMART DECISION ANALYSIS
References
1. 4frontcarsales.co.uk., 2018. VW Golf Outsells the Ford Fiesta. [online] Available at:
https://www.4frontcarsales.co.uk/news/vw-golf-outsells-the-ford-fiesta/# [Accessed 28
Jul. 2018].
2. Best-selling cars in the UK 2018., 2018. Auto Express. Retrieved 28 July 2018, from
http://www.autoexpress.co.uk/best-cars/94280/best-selling-cars-in-the-uk-2018
3. Broadbent, G.H., Drozdzewski, D. and Metternicht, G., 2018. Electric vehicle adoption:
An analysis of best practice and pitfalls for policy making from experiences of Europe
and the US. Geography Compass, 12(2), p.e12358.
4. Cuaresma, C., Lagrimas, A.P., Perez, A. and Atento, R.G.O., 2015. Strategy Innovation For
Honda High–End Car. Laguna Business and Accountancy Jounal, 1(2), pp.185-200.
5. Gavalas, D., Konstantopoulos, C. and Pantziou, G., 2016. Design and management of
vehicle-sharing systems: a survey of algorithmic approaches. In Smart Cities and Homes
(pp. 261-289).
6. Hammond, J.S., Keeney, R.L. and Raiffa, H., 2015. Smart choices: A practical guide to
making better decisions. Harvard Business Review Press.
7. Lei, N. and Moon, S.K., 2015. A Decision Support System for market-driven product
positioning and design. Decision Support Systems, 69, pp.82-91.
8. Marr, B., 2015. Big Data: Using SMART big data, analytics and metrics to make better
decisions and improve performance. John Wiley & Sons.
9. Polo, C. and Prior, M., 2014. Comparison: new Vauxhall Corsa versus Ford Fiesta and VW
Polo | Autocar. [online] Autocar.co.uk. Available at: https://www.autocar.co.uk/car-
news/new-cars/comparison-new-vauxhall-corsa-versus-ford-fiesta-and-vw-polo
[Accessed 28 Jul. 2018].
10. Rathore, M.M., Ahmad, A., Paul, A. and Jeon, G., 2015, November. Efficient graph-
oriented smart transportation using internet of things generated big data. In 2015 11th
International Conference on Signal-Image Technology & Internet-Based Systems (SITIS)
(pp. 512-519). IEEE.
⊘ This is a preview!⊘
Do you want full access?
Subscribe today to unlock all pages.
Trusted by 1+ million students worldwide
1 out of 13

Your All-in-One AI-Powered Toolkit for Academic Success.
+13062052269
info@desklib.com
Available 24*7 on WhatsApp / Email
![[object Object]](/_next/static/media/star-bottom.7253800d.svg)
Unlock your academic potential
Copyright © 2020–2026 A2Z Services. All Rights Reserved. Developed and managed by ZUCOL.