Management Accounting Report: Performance Analysis of Smart Looks Ltd
VerifiedAdded on 2020/07/22
|24
|5191
|500
Report
AI Summary
This report provides a comprehensive analysis of management accounting principles applied to Smart Looks Ltd. It begins with a classification of costs into fixed, variable, and semi-variable categories, followed by an examination of other cost classification methods. The report then delves into cost analysis, including the computation of total costs and cost per unit at different production levels, along with graphical presentations. Inventory costing methods (FIFO, LIFO, and Average Cost) are compared, and COGS reports are prepared for each. The report also explores Critical Success Factors (CSF) and Key Performance Indicators (KPI), along with cost reduction strategies and value/quality enhancement methods. Furthermore, it covers budgeting, including sales, production, raw material, labor, and cash budgets. Finally, the report analyzes variances, comparing budgeted and actual profits, and concludes with recommendations for Smart Looks Ltd's financial performance improvement.
MANAGEMENT
ACCOUNTING
ACCOUNTING
Paraphrase This Document
Need a fresh take? Get an instant paraphrase of this document with our AI Paraphraser
Lindholm, A., and et.al., 2017Table of Contents
INTRODUCTION...........................................................................................................................1
TASK 1............................................................................................................................................1
Q1................................................................................................................................................1
a) Classify costs into fixed, variable and semi-variable costs.....................................................1
b) Other ways of classifying costs..............................................................................................2
Q2................................................................................................................................................4
a) Compute the total cost and cost per unit at different level of unit..........................................4
b) Analyse cost using graphical presentation..............................................................................4
Q3................................................................................................................................................6
1. FIFO........................................................................................................................................6
2. LIFO........................................................................................................................................7
3. Average cost............................................................................................................................7
Q4 Prepare COGS report for FIFO, LIFO and Average cost.....................................................7
.....................................................................................................................................................9
Q5................................................................................................................................................9
CSF and KPI...............................................................................................................................9
b) ..............................................................................................................................................10
Ways to reduce Costs................................................................................................................10
Value and quality enhancement................................................................................................10
TASK 2..........................................................................................................................................10
Q6..............................................................................................................................................10
Define budget............................................................................................................................10
Budget purpose..........................................................................................................................11
Methods of budgeting...............................................................................................................12
Q7..............................................................................................................................................13
a) Sales budget..........................................................................................................................13
b) Production budget.................................................................................................................14
c) Raw material budget.............................................................................................................14
d) Labour budget.......................................................................................................................14
Q8 Cash budget.........................................................................................................................15

TASK 3..........................................................................................................................................16
Q9..............................................................................................................................................16
a) Budget profit.........................................................................................................................16
b) Actual profit .........................................................................................................................17
c) Material and labour sub variances........................................................................................18
d) Operating statement for reconciling budgeted and actual profit...........................................18
Q10 Recommendation...............................................................................................................19
CONCLUSION..............................................................................................................................19
⊘ This is a preview!⊘
Do you want full access?
Subscribe today to unlock all pages.
Trusted by 1+ million students worldwide
Index of Tables
Table 1: Classification of costs........................................................................................................1
Table 2: Cost per unit and total cost................................................................................................4
Table 3: Closing stock of FIFO.......................................................................................................6
Table 4: Closing stock of LIFO.......................................................................................................7
Table 5: Closing inventory of Average cost....................................................................................7
Table 6: COGS report of FIFO method...........................................................................................7
Table 7: COGS report of LIFO method...........................................................................................8
Table 8: COGS report of Average cost method...............................................................................8
Table 9: Sales budget.....................................................................................................................13
Table 10: Production budget..........................................................................................................14
Table 11: Raw material budget......................................................................................................14
Table 12: Labour budget................................................................................................................14
Table 13: Overhead budget............................................................................................................15
Table 14: Cash budget...................................................................................................................15
Table 15: Budgeted Profit..............................................................................................................16
Table 16: Actual profit...................................................................................................................17
Table 17: Reconciliation statement................................................................................................18
Paraphrase This Document
Need a fresh take? Get an instant paraphrase of this document with our AI Paraphraser
INTRODUCTION
Management accounting role has increases with the changes takes places in the external
business environment as this focuses on offering both qualitative and quantitative information to
all its users. Smart Looks Ltd has been selected for the given project report that focuses on using
various management accounting tools in imp[roving the existing conditions of an entity. Current
project emphasises on using various costs such as fixed, variable and semi-variable costs
incurred in a business is required to be identified at initial stage.
TASK 1
Q1
a) Classify costs into fixed, variable and semi-variable costs
Table 1: Classification of costs
Participants Fixed costs Variable costs Semi-variable costs
Material for clothes B
Factory rent A
Power for sewing
machines
C
Factory supervisor's
wages
C
Packaging materials B
Telephone C
Office rates A
Delivery driver's pay C
Factory heating A
1
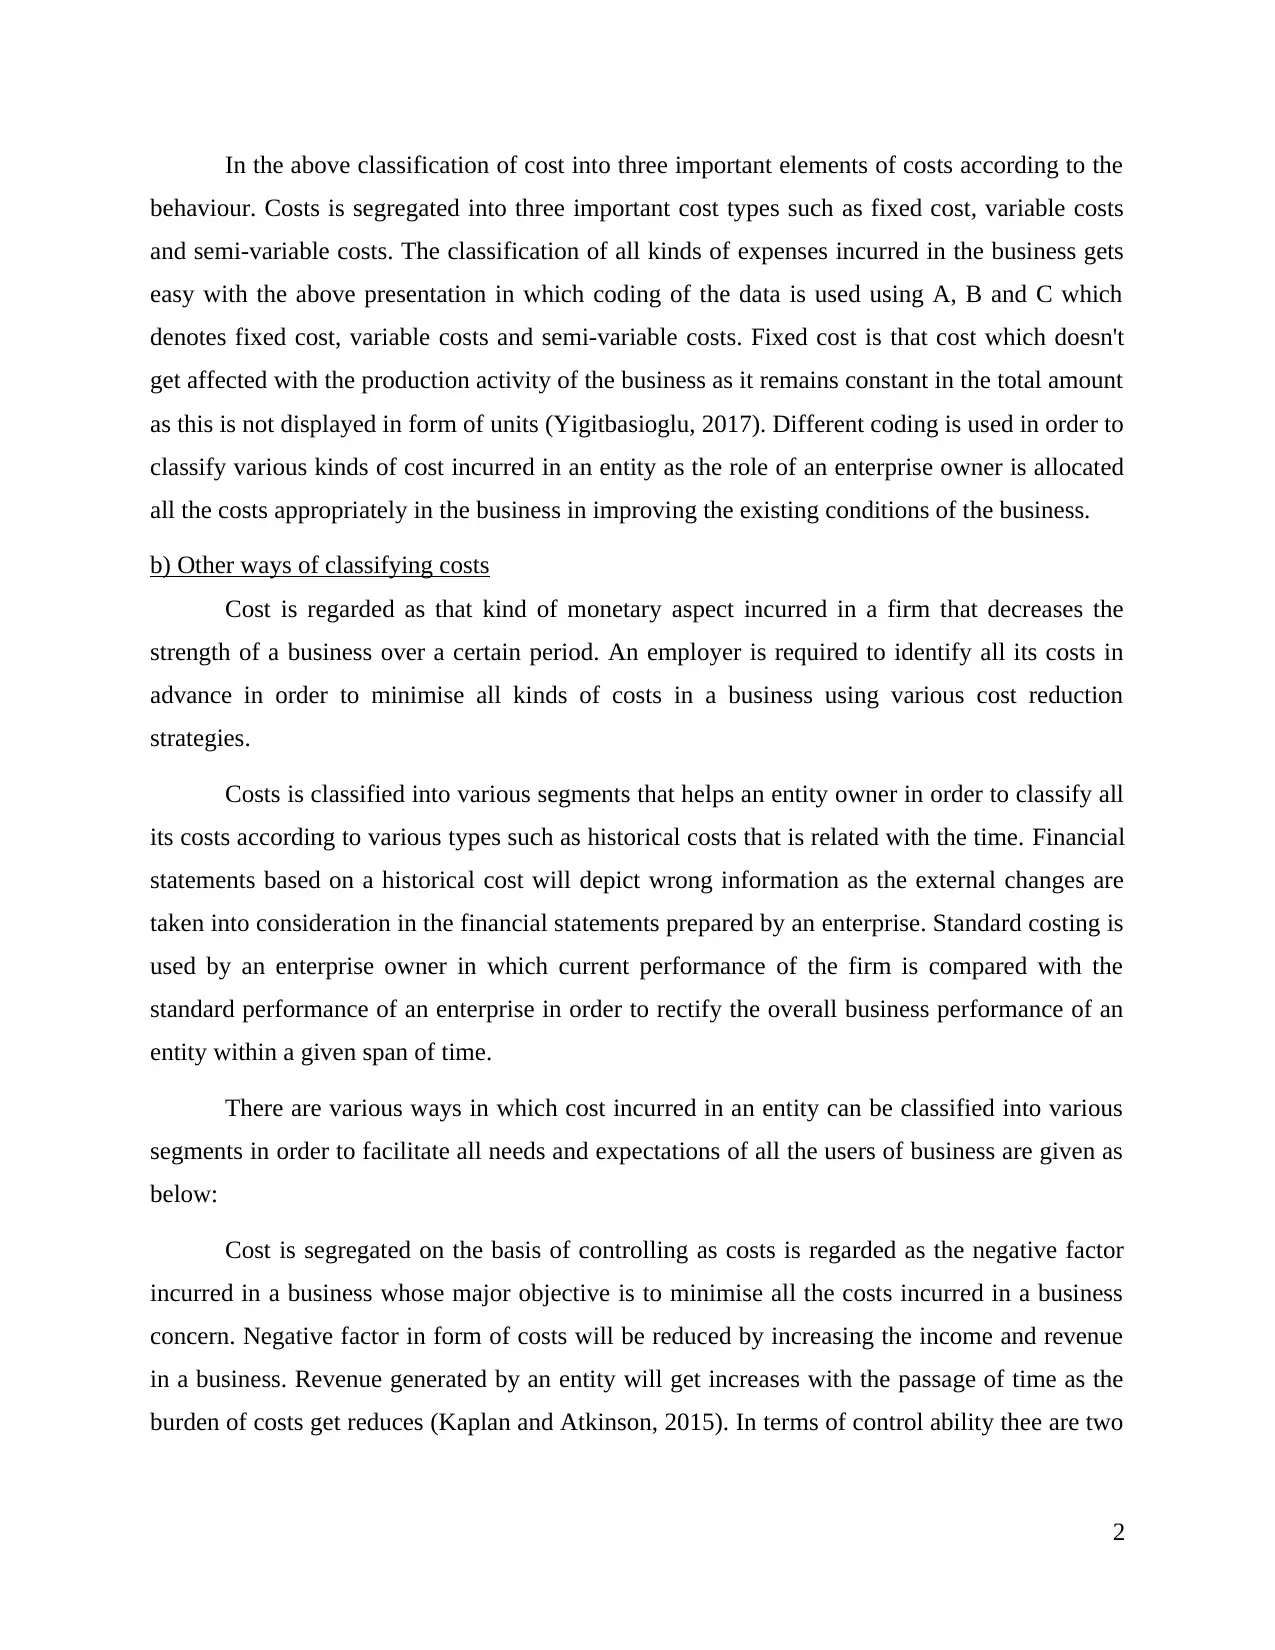
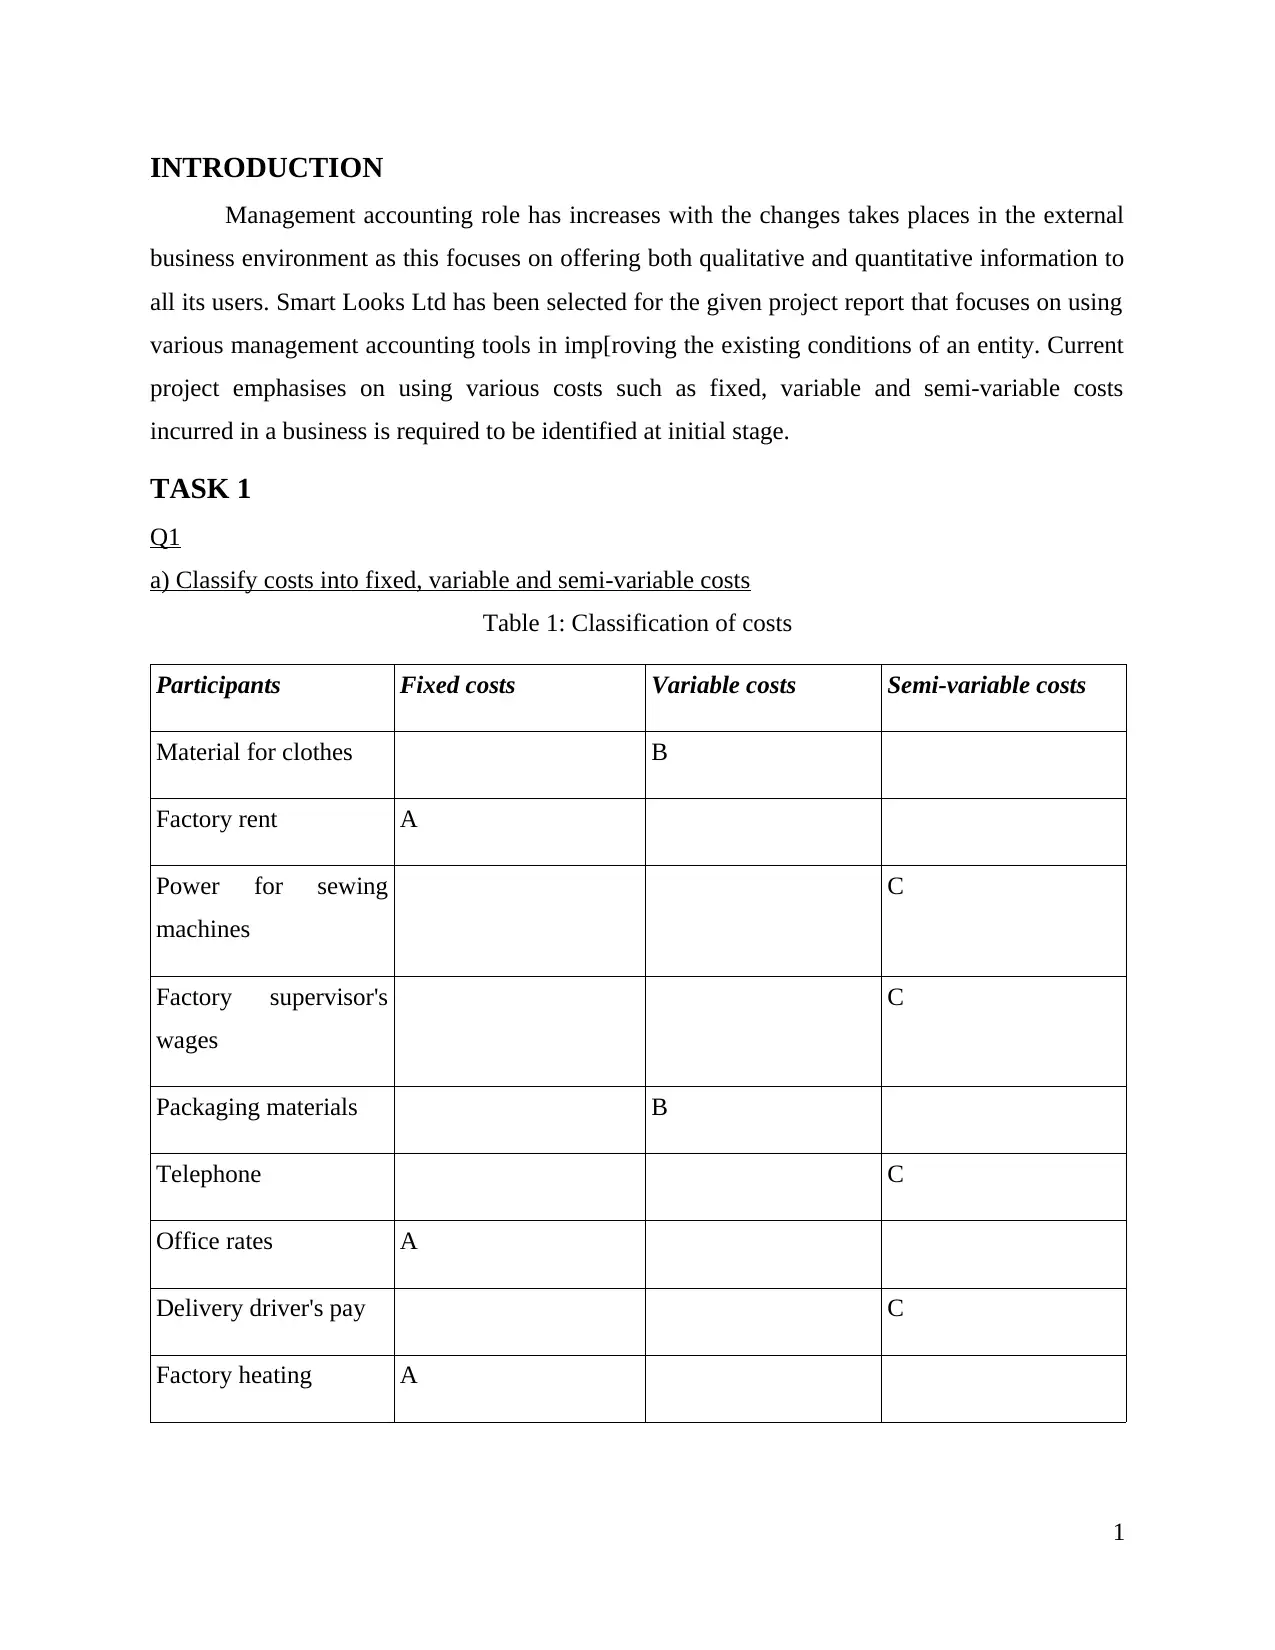
In the above classification of cost into three important elements of costs according to the
behaviour. Costs is segregated into three important cost types such as fixed cost, variable costs
and semi-variable costs. The classification of all kinds of expenses incurred in the business gets
easy with the above presentation in which coding of the data is used using A, B and C which
denotes fixed cost, variable costs and semi-variable costs. Fixed cost is that cost which doesn't
get affected with the production activity of the business as it remains constant in the total amount
as this is not displayed in form of units (Yigitbasioglu, 2017). Different coding is used in order to
classify various kinds of cost incurred in an entity as the role of an enterprise owner is allocated
all the costs appropriately in the business in improving the existing conditions of the business.
b) Other ways of classifying costs
Cost is regarded as that kind of monetary aspect incurred in a firm that decreases the
strength of a business over a certain period. An employer is required to identify all its costs in
advance in order to minimise all kinds of costs in a business using various cost reduction
strategies.
Costs is classified into various segments that helps an entity owner in order to classify all
its costs according to various types such as historical costs that is related with the time. Financial
statements based on a historical cost will depict wrong information as the external changes are
taken into consideration in the financial statements prepared by an enterprise. Standard costing is
used by an enterprise owner in which current performance of the firm is compared with the
standard performance of an enterprise in order to rectify the overall business performance of an
entity within a given span of time.
There are various ways in which cost incurred in an entity can be classified into various
segments in order to facilitate all needs and expectations of all the users of business are given as
below:
Cost is segregated on the basis of controlling as costs is regarded as the negative factor
incurred in a business whose major objective is to minimise all the costs incurred in a business
concern. Negative factor in form of costs will be reduced by increasing the income and revenue
in a business. Revenue generated by an entity will get increases with the passage of time as the
burden of costs get reduces (Kaplan and Atkinson, 2015). In terms of control ability thee are two
2
⊘ This is a preview!⊘
Do you want full access?
Subscribe today to unlock all pages.
Trusted by 1+ million students worldwide
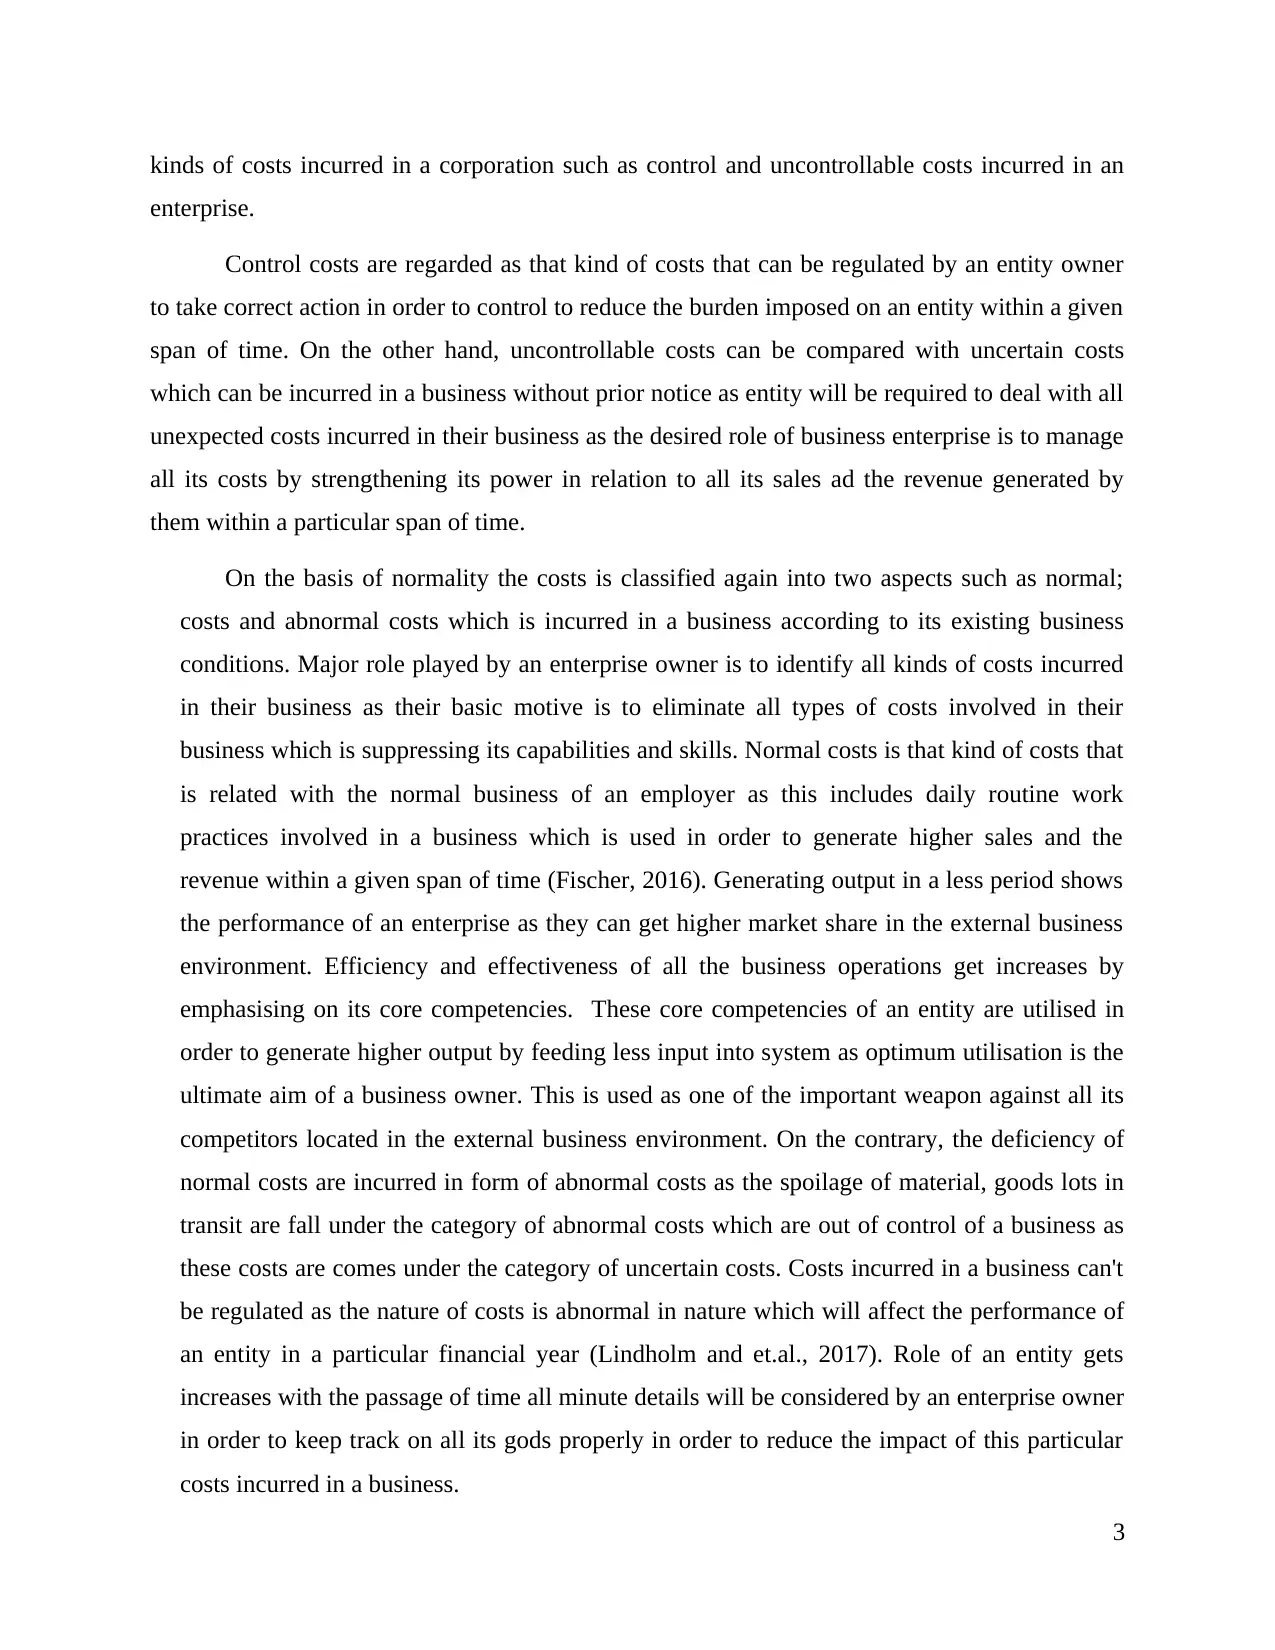
kinds of costs incurred in a corporation such as control and uncontrollable costs incurred in an
enterprise.
Control costs are regarded as that kind of costs that can be regulated by an entity owner
to take correct action in order to control to reduce the burden imposed on an entity within a given
span of time. On the other hand, uncontrollable costs can be compared with uncertain costs
which can be incurred in a business without prior notice as entity will be required to deal with all
unexpected costs incurred in their business as the desired role of business enterprise is to manage
all its costs by strengthening its power in relation to all its sales ad the revenue generated by
them within a particular span of time.
On the basis of normality the costs is classified again into two aspects such as normal;
costs and abnormal costs which is incurred in a business according to its existing business
conditions. Major role played by an enterprise owner is to identify all kinds of costs incurred
in their business as their basic motive is to eliminate all types of costs involved in their
business which is suppressing its capabilities and skills. Normal costs is that kind of costs that
is related with the normal business of an employer as this includes daily routine work
practices involved in a business which is used in order to generate higher sales and the
revenue within a given span of time (Fischer, 2016). Generating output in a less period shows
the performance of an enterprise as they can get higher market share in the external business
environment. Efficiency and effectiveness of all the business operations get increases by
emphasising on its core competencies. These core competencies of an entity are utilised in
order to generate higher output by feeding less input into system as optimum utilisation is the
ultimate aim of a business owner. This is used as one of the important weapon against all its
competitors located in the external business environment. On the contrary, the deficiency of
normal costs are incurred in form of abnormal costs as the spoilage of material, goods lots in
transit are fall under the category of abnormal costs which are out of control of a business as
these costs are comes under the category of uncertain costs. Costs incurred in a business can't
be regulated as the nature of costs is abnormal in nature which will affect the performance of
an entity in a particular financial year (Lindholm and et.al., 2017). Role of an entity gets
increases with the passage of time all minute details will be considered by an enterprise owner
in order to keep track on all its gods properly in order to reduce the impact of this particular
costs incurred in a business.
3
Paraphrase This Document
Need a fresh take? Get an instant paraphrase of this document with our AI Paraphraser
Classification of costs is based on the basis of tie in which segregation of costs in an
entity on the basis of time factor as this shows the importance of time in an entity. Historical
costs is the basic costs of a particular product restricts a particular product by excluding
external changes takes places in a business enterprise. The financial performance of an
enterprise gets affected with poor use of costs information as this deflates an entity's
performance over a particular span of time. Consideration of costs is regarded as one of the
important factor in an entity as this will directly affects its overall performance that requires
external boosting. External boosters will be used by an entity owner by analysing its current
strength in order to generate higher sales and the revenue in capturing higher market share in
the external business environment (Kaplan and Atkinson, 2015). It is important for a business
user in considering the effect of all the external market users in the current business
performance as minute changes takes places in its external environment will directly affected
its overall market share. Costs will be properly monitored as the higher costs incurred in a
business higher will be its overall sale and the revenue generate by them in a particular span
of time.
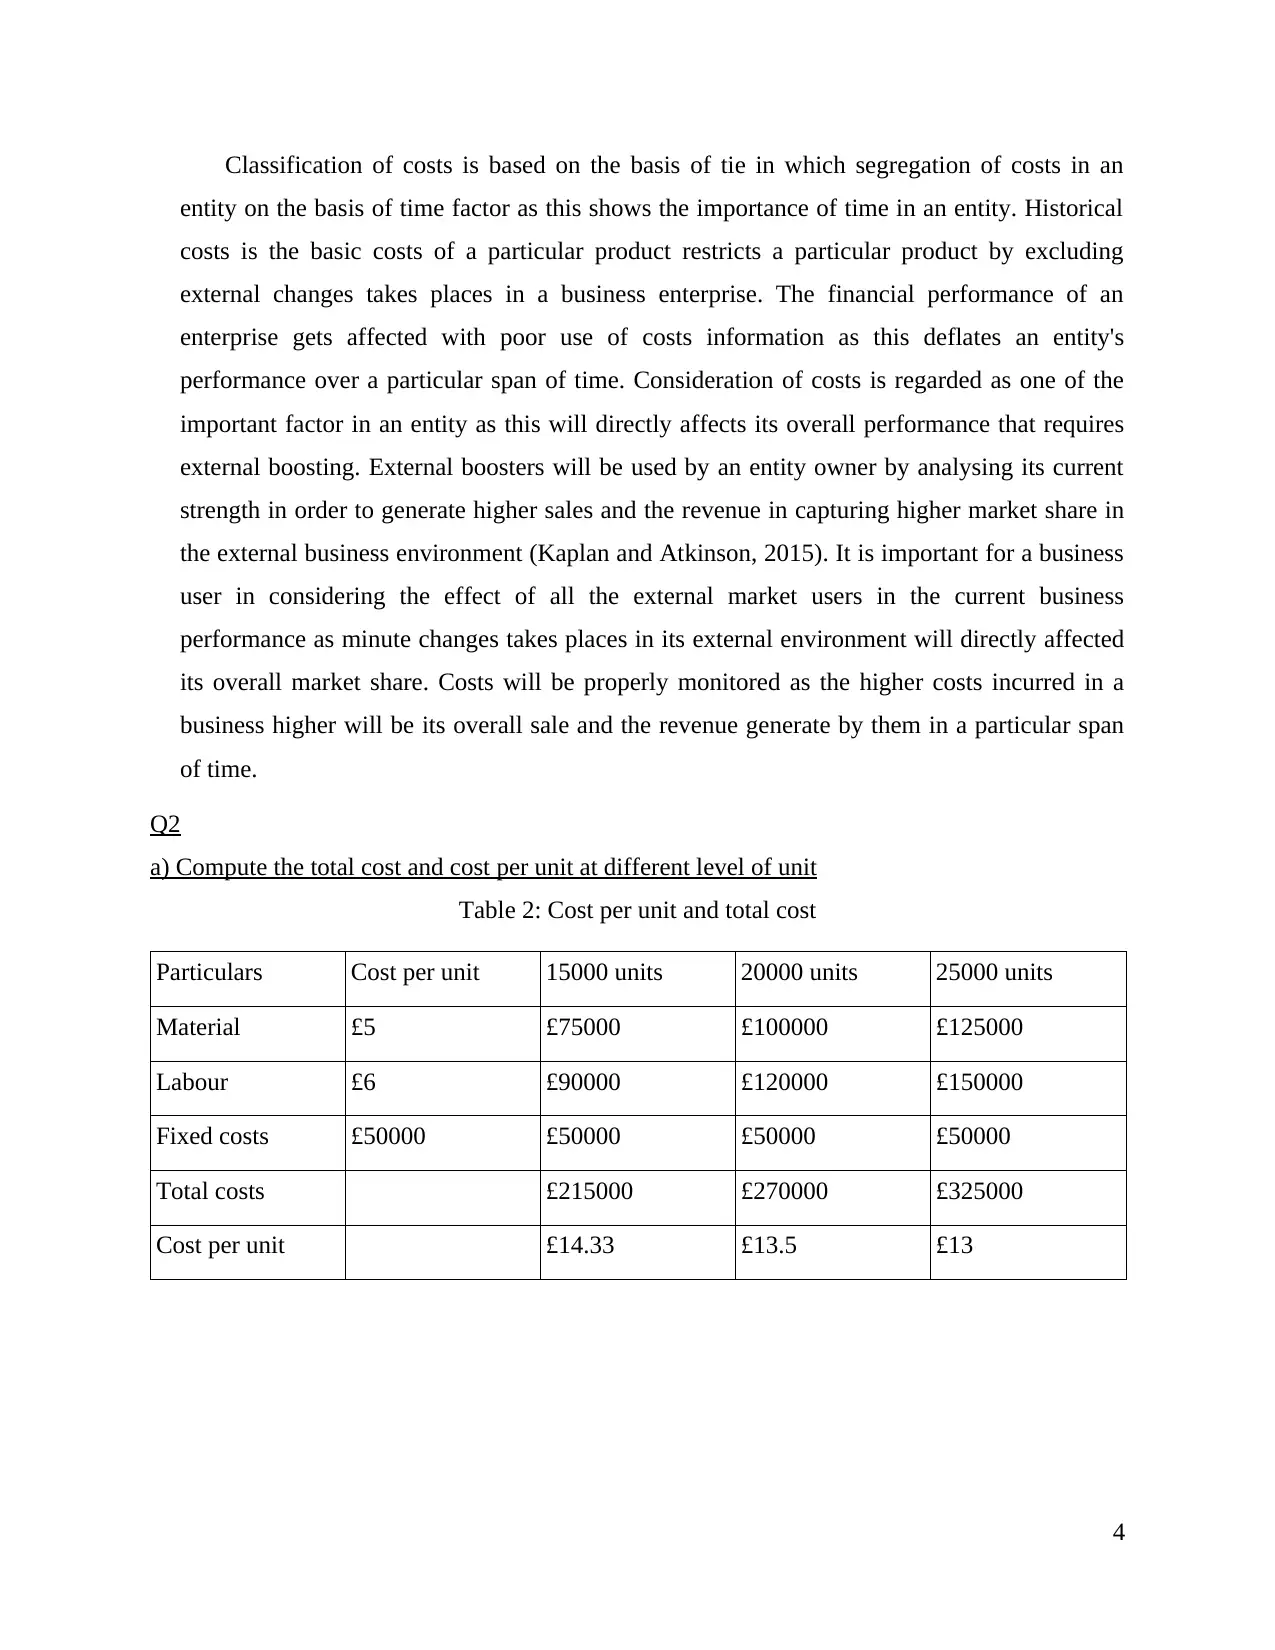
Q2
a) Compute the total cost and cost per unit at different level of unit
Table 2: Cost per unit and total cost
Particulars Cost per unit 15000 units 20000 units 25000 units
Material £5 £75000 £100000 £125000
Labour £6 £90000 £120000 £150000
Fixed costs £50000 £50000 £50000 £50000
Total costs £215000 £270000 £325000
Cost per unit £14.33 £13.5 £13
4
entity on the basis of time factor as this shows the importance of time in an entity. Historical
costs is the basic costs of a particular product restricts a particular product by excluding
external changes takes places in a business enterprise. The financial performance of an
enterprise gets affected with poor use of costs information as this deflates an entity's
performance over a particular span of time. Consideration of costs is regarded as one of the
important factor in an entity as this will directly affects its overall performance that requires
external boosting. External boosters will be used by an entity owner by analysing its current
strength in order to generate higher sales and the revenue in capturing higher market share in
the external business environment (Kaplan and Atkinson, 2015). It is important for a business
user in considering the effect of all the external market users in the current business
performance as minute changes takes places in its external environment will directly affected
its overall market share. Costs will be properly monitored as the higher costs incurred in a
business higher will be its overall sale and the revenue generate by them in a particular span
of time.
Q2
a) Compute the total cost and cost per unit at different level of unit
Table 2: Cost per unit and total cost
Particulars Cost per unit 15000 units 20000 units 25000 units
Material £5 £75000 £100000 £125000
Labour £6 £90000 £120000 £150000
Fixed costs £50000 £50000 £50000 £50000
Total costs £215000 £270000 £325000
Cost per unit £14.33 £13.5 £13
4
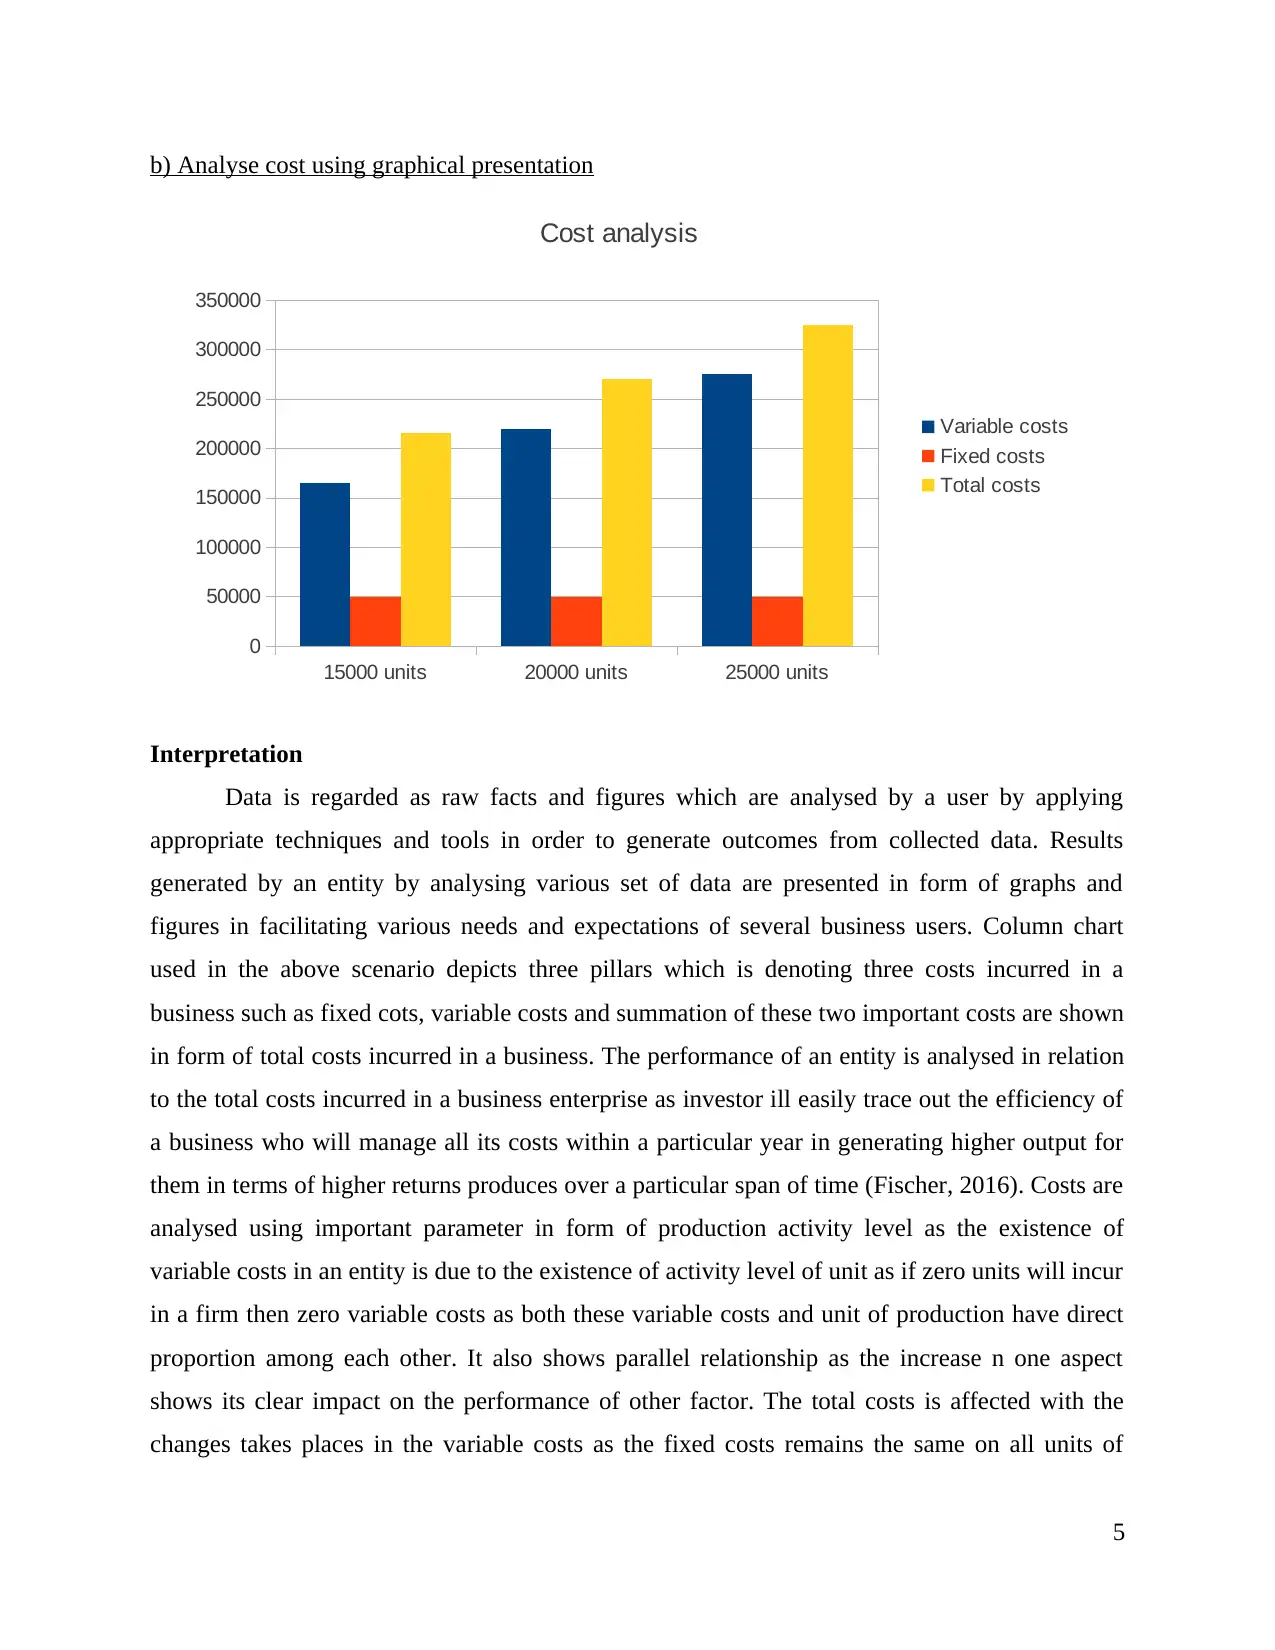
b) Analyse cost using graphical presentation
15000 units 20000 units 25000 units
0
50000
100000
150000
200000
250000
300000
350000
Cost analysis
Variable costs
Fixed costs
Total costs
Interpretation
Data is regarded as raw facts and figures which are analysed by a user by applying
appropriate techniques and tools in order to generate outcomes from collected data. Results
generated by an entity by analysing various set of data are presented in form of graphs and
figures in facilitating various needs and expectations of several business users. Column chart
used in the above scenario depicts three pillars which is denoting three costs incurred in a
business such as fixed cots, variable costs and summation of these two important costs are shown
in form of total costs incurred in a business. The performance of an entity is analysed in relation
to the total costs incurred in a business enterprise as investor ill easily trace out the efficiency of
a business who will manage all its costs within a particular year in generating higher output for
them in terms of higher returns produces over a particular span of time (Fischer, 2016). Costs are
analysed using important parameter in form of production activity level as the existence of
variable costs in an entity is due to the existence of activity level of unit as if zero units will incur
in a firm then zero variable costs as both these variable costs and unit of production have direct
proportion among each other. It also shows parallel relationship as the increase n one aspect
shows its clear impact on the performance of other factor. The total costs is affected with the
changes takes places in the variable costs as the fixed costs remains the same on all units of
5
⊘ This is a preview!⊘
Do you want full access?
Subscribe today to unlock all pages.
Trusted by 1+ million students worldwide
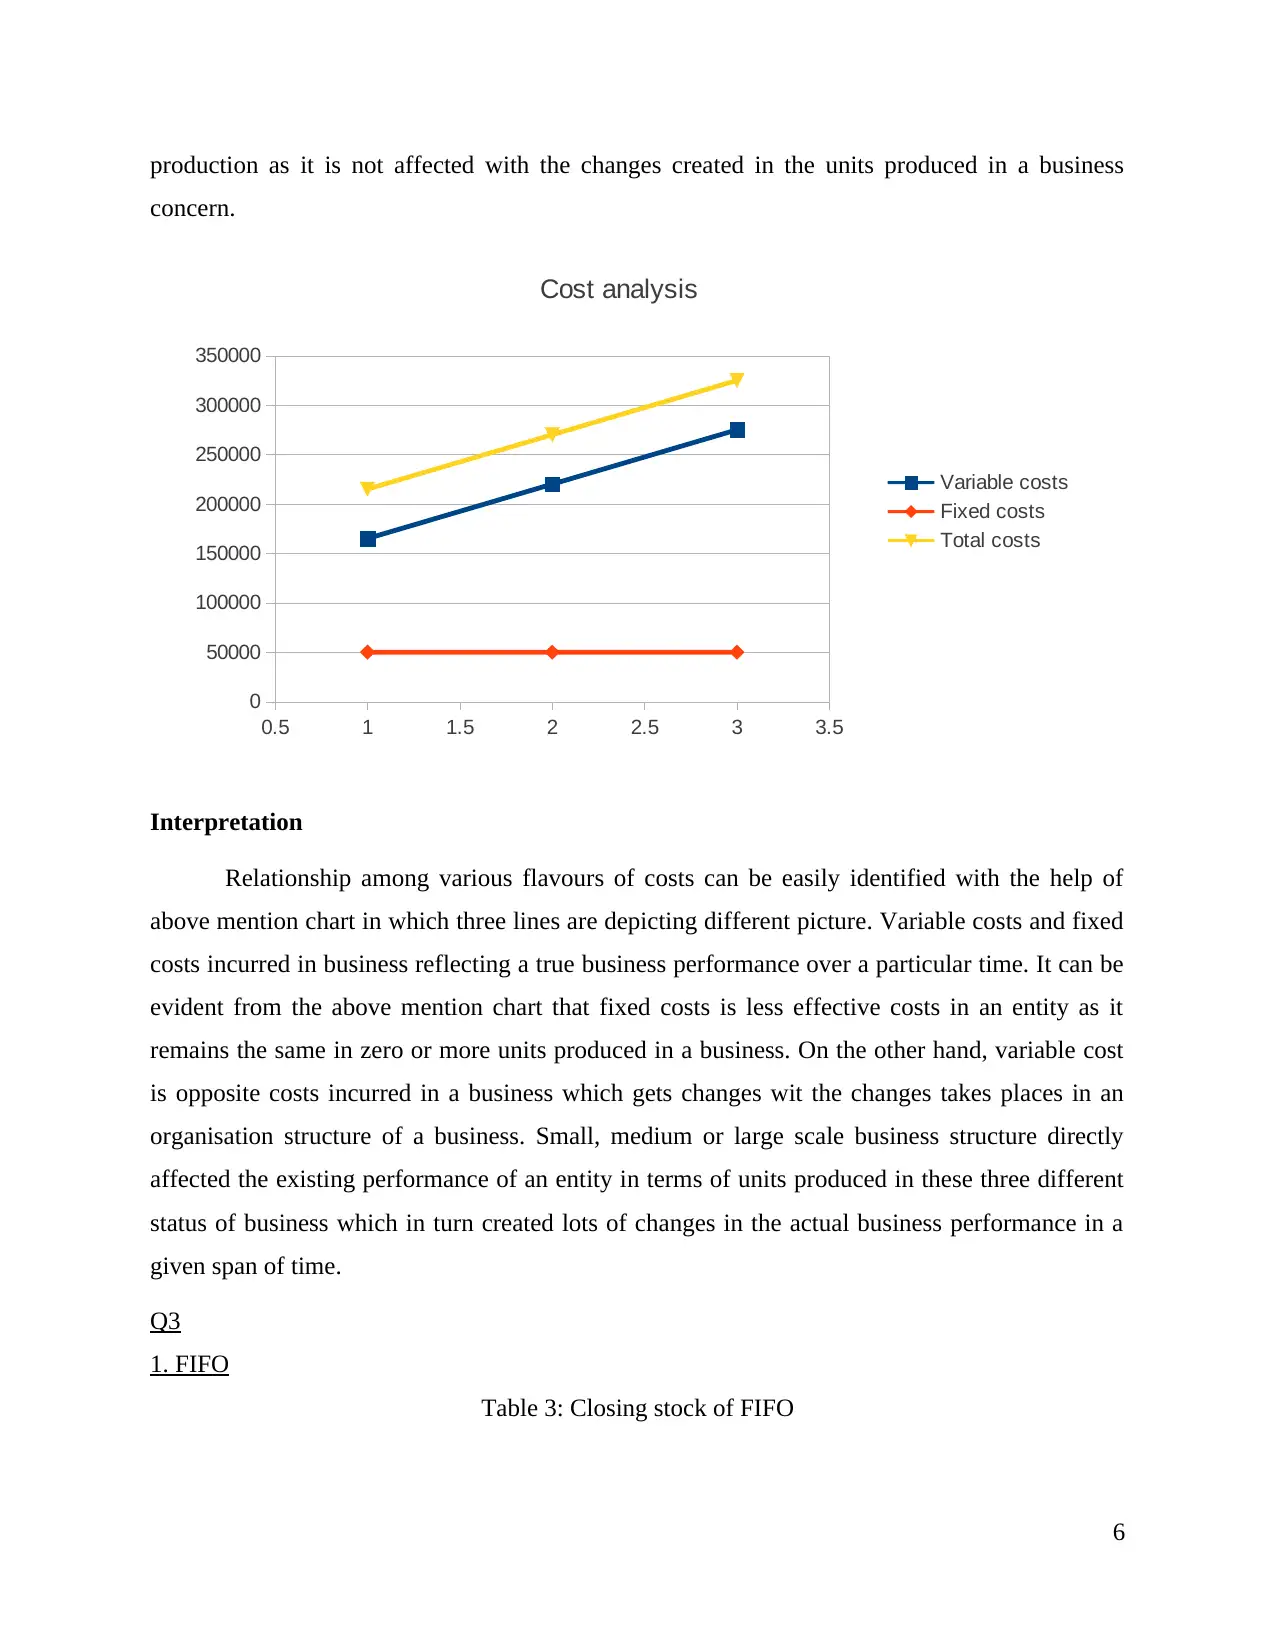
production as it is not affected with the changes created in the units produced in a business
concern.
0.5 1 1.5 2 2.5 3 3.5
0
50000
100000
150000
200000
250000
300000
350000
Cost analysis
Variable costs
Fixed costs
Total costs
Interpretation
Relationship among various flavours of costs can be easily identified with the help of
above mention chart in which three lines are depicting different picture. Variable costs and fixed
costs incurred in business reflecting a true business performance over a particular time. It can be
evident from the above mention chart that fixed costs is less effective costs in an entity as it
remains the same in zero or more units produced in a business. On the other hand, variable cost
is opposite costs incurred in a business which gets changes wit the changes takes places in an
organisation structure of a business. Small, medium or large scale business structure directly
affected the existing performance of an entity in terms of units produced in these three different
status of business which in turn created lots of changes in the actual business performance in a
given span of time.
Q3
1. FIFO
Table 3: Closing stock of FIFO
6
Paraphrase This Document
Need a fresh take? Get an instant paraphrase of this document with our AI Paraphraser
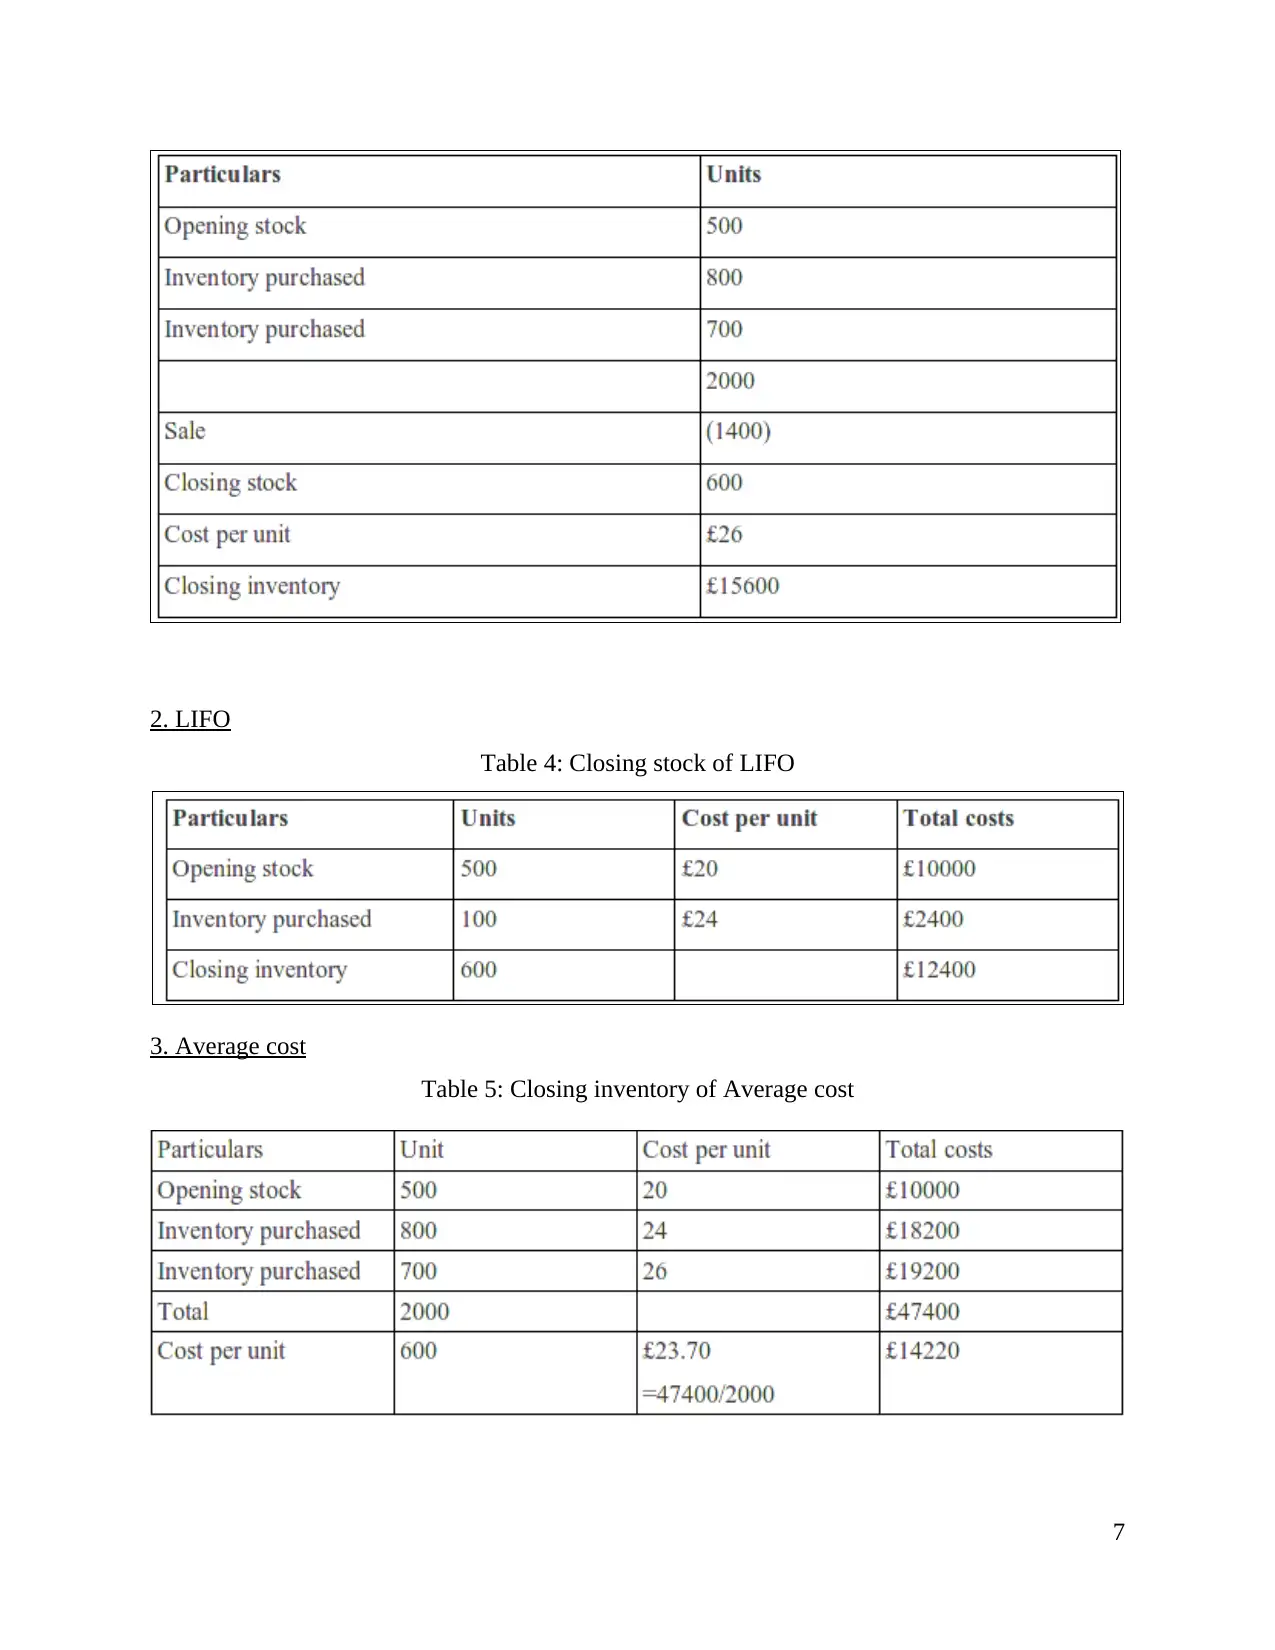
2. LIFO
Table 4: Closing stock of LIFO
3. Average cost
Table 5: Closing inventory of Average cost
7
Table 4: Closing stock of LIFO
3. Average cost
Table 5: Closing inventory of Average cost
7
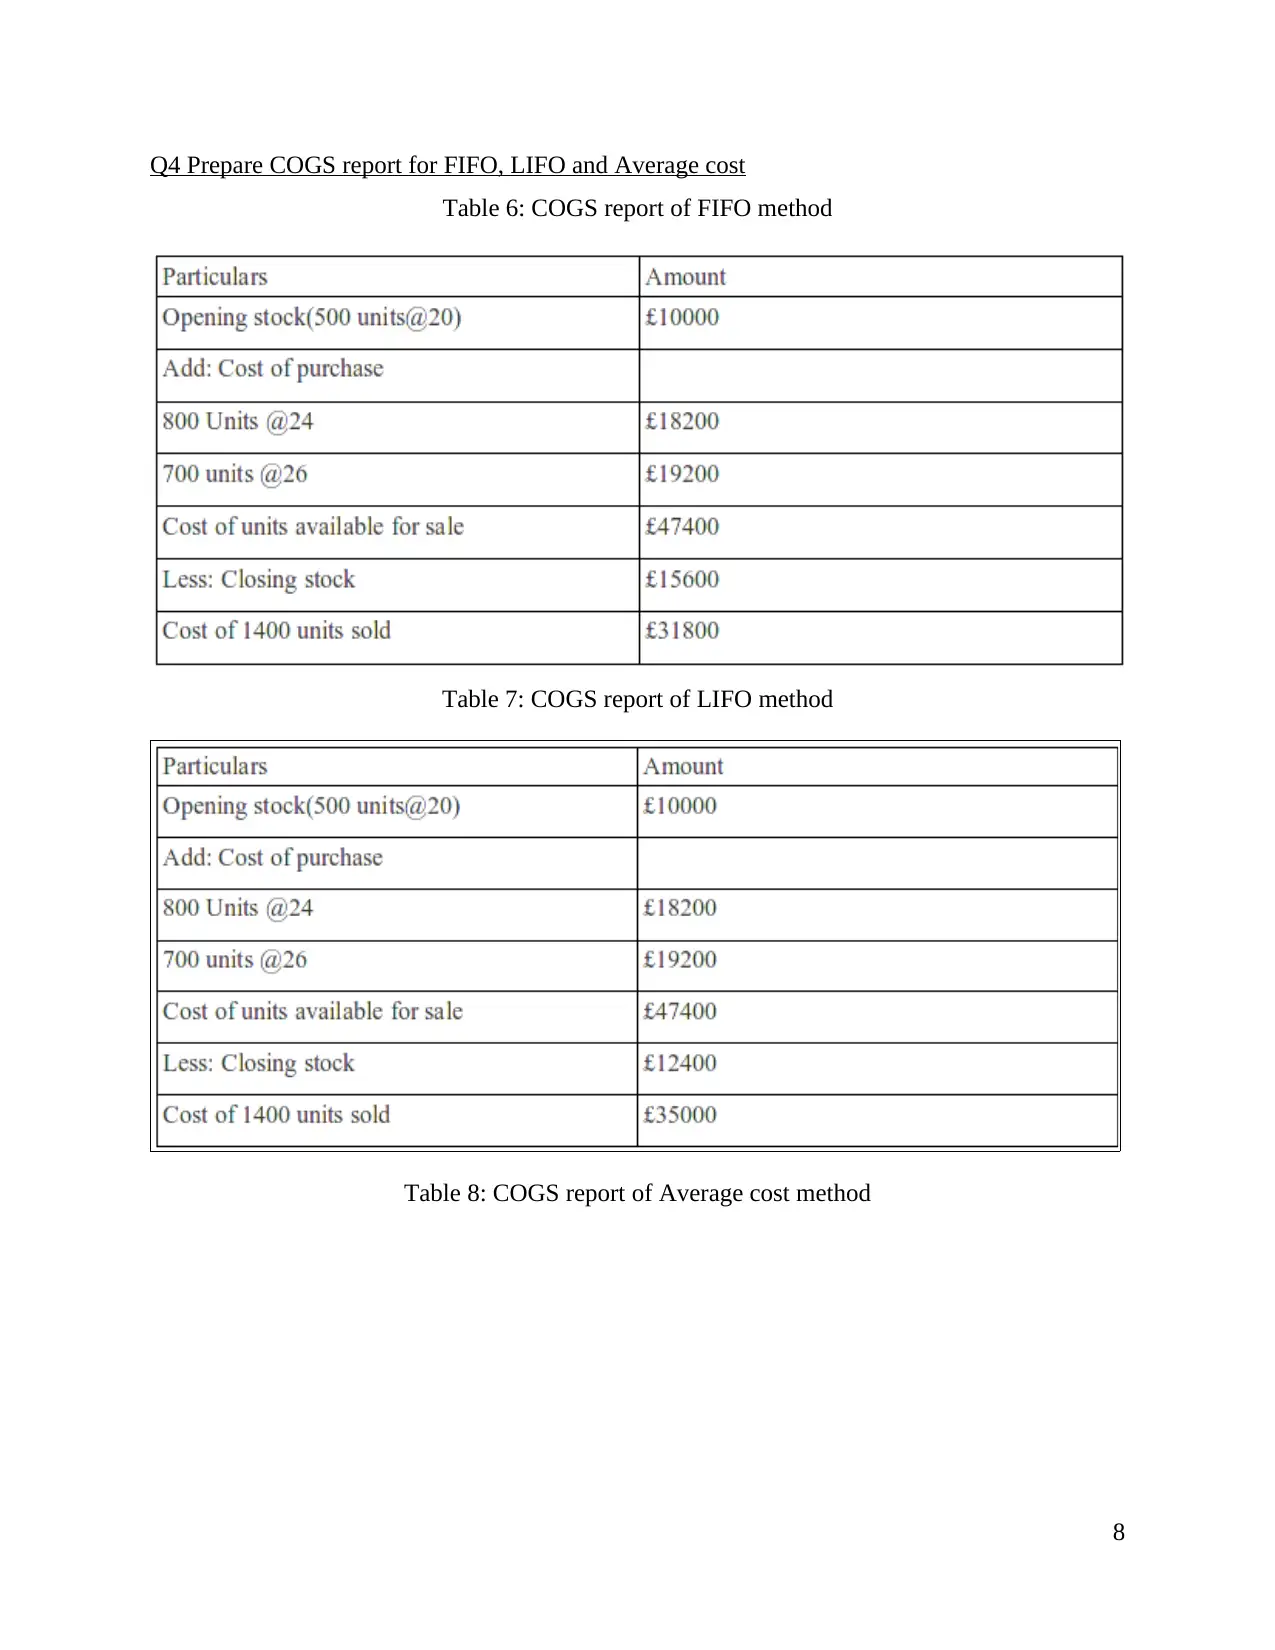
Q4 Prepare COGS report for FIFO, LIFO and Average cost
Table 6: COGS report of FIFO method
Table 7: COGS report of LIFO method
Table 8: COGS report of Average cost method
8
Table 6: COGS report of FIFO method
Table 7: COGS report of LIFO method
Table 8: COGS report of Average cost method
8
⊘ This is a preview!⊘
Do you want full access?
Subscribe today to unlock all pages.
Trusted by 1+ million students worldwide
1 out of 24
Related Documents


Your All-in-One AI-Powered Toolkit for Academic Success.
+13062052269
info@desklib.com
Available 24*7 on WhatsApp / Email
![[object Object]](/_next/static/media/star-bottom.7253800d.svg)
Unlock your academic potential
Copyright © 2020–2026 A2Z Services. All Rights Reserved. Developed and managed by ZUCOL.