Dissertation: Smartphone Advertising and Fashion Purchase Decisions
VerifiedAdded on 2020/02/03
|33
|8145
|62
Thesis and Dissertation
AI Summary
This dissertation delves into the impact of smartphone advertising on fashion purchase decision-making in Chiang Mai, Thailand. Employing quantitative methods, the study analyzes data collected to assess the influence of factors such as age, income, and the marketing mix (product, price, place, and promotion). Data analysis includes T-tests, One Way ANOVA, and factor analysis to evaluate hypotheses. Findings reveal the significance of factors like price, accessibility, and promotional elements in shaping consumer behavior. The research highlights the importance of understanding demographic aspects and tailoring marketing strategies to effectively influence fashion purchase decisions through smartphone advertising. The dissertation concludes with a discussion of the results, implications, and recommendations for fashion organizations seeking to optimize their smartphone marketing efforts.
Dissertation- Data Analysis
and Discussion
Smartphone Advertising: The
Impact on Fashion Purchase
Decision Making in Chiang
Mai, Thailand
and Discussion
Smartphone Advertising: The
Impact on Fashion Purchase
Decision Making in Chiang
Mai, Thailand
Paraphrase This Document
Need a fresh take? Get an instant paraphrase of this document with our AI Paraphraser
INTRODUCTION
Current chapter is all about exploring the key aspects that relates with the smart phone
advertising. In this chapter the data analysis and discussion about the subject will be provided so
that better findings can be attained. After research methodology, data analysis is the next section
in the dissertation. This deals with evaluation and appraisal of the data that has been collected by
the researcher. In addition to this, it can be said that the chapter provides findings of responses
that are collected by citizens. It will assist in drawing final conclusion so that objectives of the
study can be accomplished in appreciate manner. Present study is based on smartphone
advertising and its Impact on Fashion Purchase Decision Making in Chiang Mai, Thailand.
Quantitative methods will be used by researcher to have effective evaluation of information
gathered so that issues can be overcome effectively. Along with this, the hypothesis will also be
designed as per consideration of literature review so that objectives of the study can be
accomplished effectively. In addition to this, it can be stated that the literature review indicates
the information about impact of age factor on the fashion purchase decision making in relation to
the smart phone advertising so hypothesis 1 has been designed as per consideration of literature
review. Information gathered in literature review also focuses on significance of marketing mix
so it is one of key reason that the hypothesis 3 is related to product, price, place and promotion. It
clearly indicates that there is link between the hypotheses and the literature review.
DATA ANALYSIS
Hypothesis
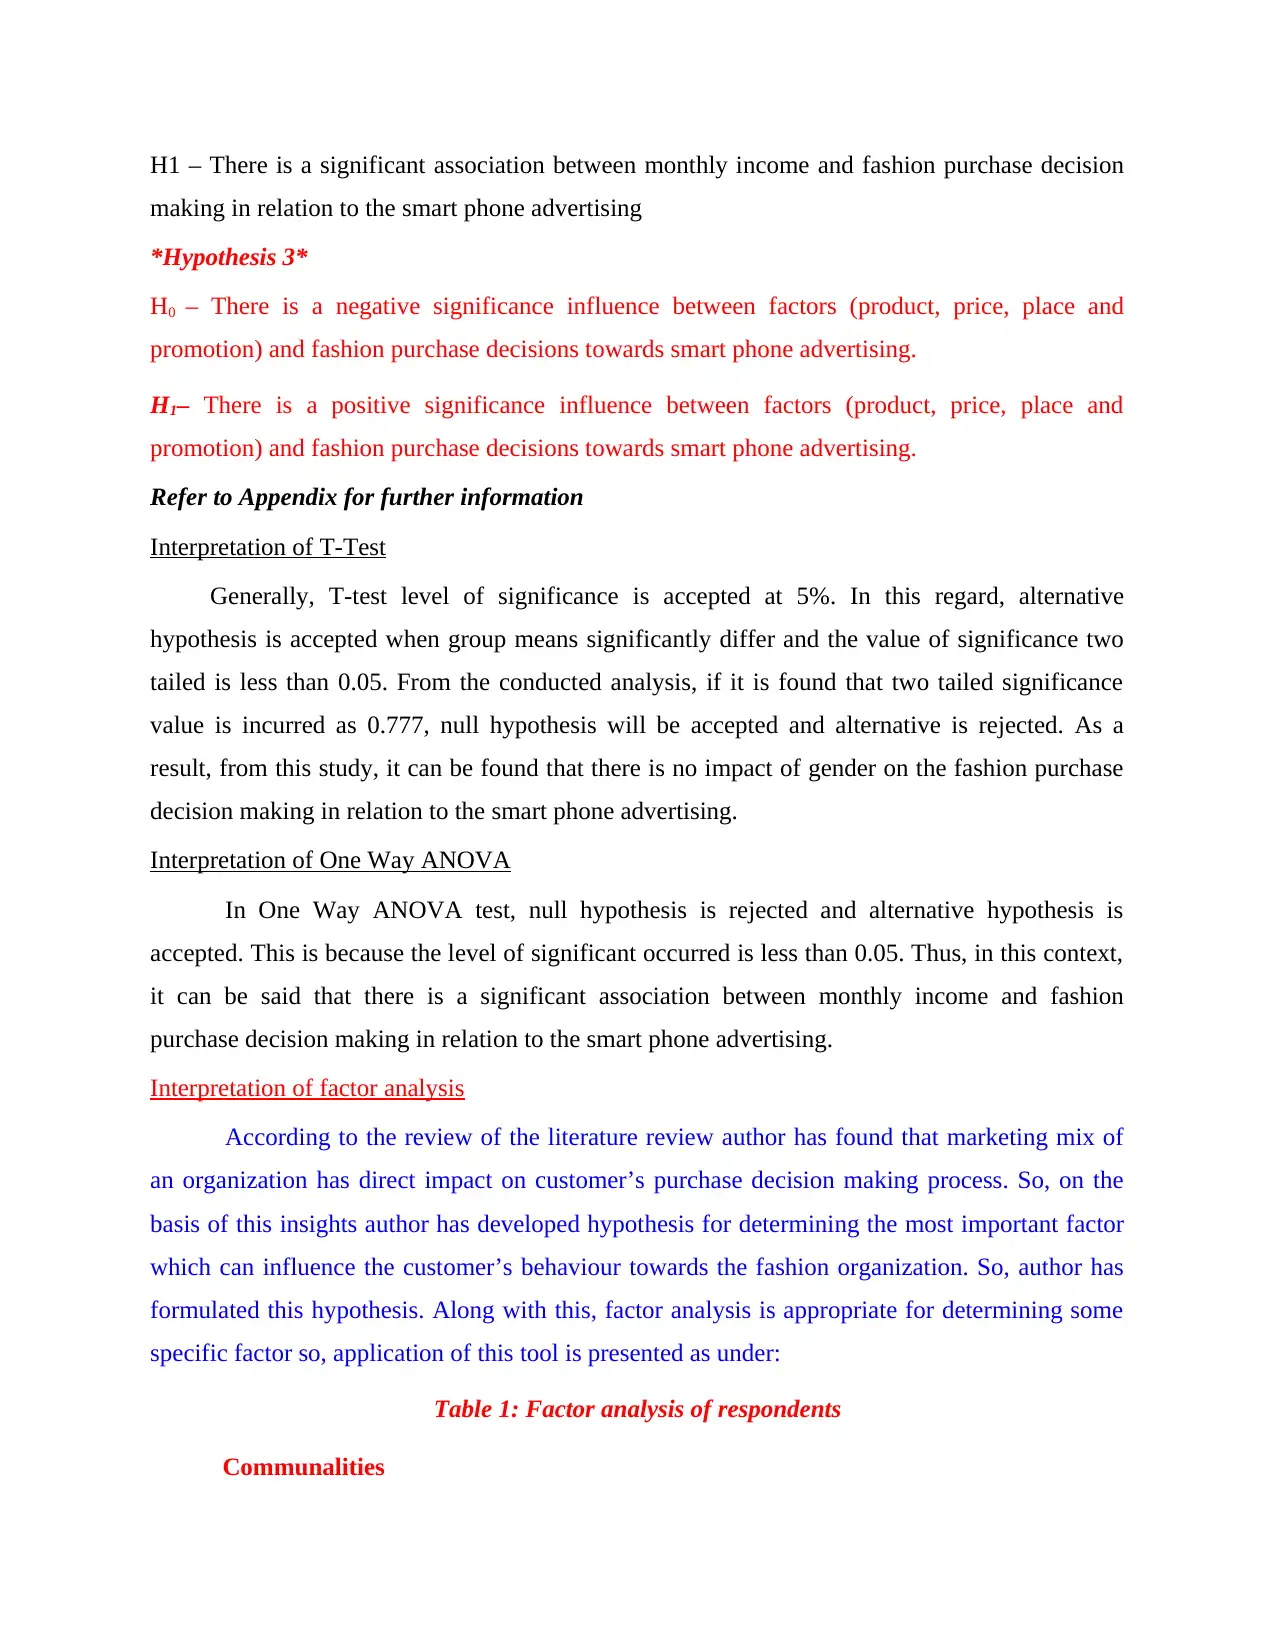
*Hypothesis 1*
H0 – There is no impact of age on the fashion purchase decision making in relation to the smart
phone advertising
H1 – There is an impact of age on the fashion purchase decision making in relation to the smart
phone advertising
*Hypothesis 2*
H0 – There is no significant association between monthly income and fashion purchase decision
making in relation to the smart phone advertising
Current chapter is all about exploring the key aspects that relates with the smart phone
advertising. In this chapter the data analysis and discussion about the subject will be provided so
that better findings can be attained. After research methodology, data analysis is the next section
in the dissertation. This deals with evaluation and appraisal of the data that has been collected by
the researcher. In addition to this, it can be said that the chapter provides findings of responses
that are collected by citizens. It will assist in drawing final conclusion so that objectives of the
study can be accomplished in appreciate manner. Present study is based on smartphone
advertising and its Impact on Fashion Purchase Decision Making in Chiang Mai, Thailand.
Quantitative methods will be used by researcher to have effective evaluation of information
gathered so that issues can be overcome effectively. Along with this, the hypothesis will also be
designed as per consideration of literature review so that objectives of the study can be
accomplished effectively. In addition to this, it can be stated that the literature review indicates
the information about impact of age factor on the fashion purchase decision making in relation to
the smart phone advertising so hypothesis 1 has been designed as per consideration of literature
review. Information gathered in literature review also focuses on significance of marketing mix
so it is one of key reason that the hypothesis 3 is related to product, price, place and promotion. It
clearly indicates that there is link between the hypotheses and the literature review.
DATA ANALYSIS
Hypothesis
*Hypothesis 1*
H0 – There is no impact of age on the fashion purchase decision making in relation to the smart
phone advertising
H1 – There is an impact of age on the fashion purchase decision making in relation to the smart
phone advertising
*Hypothesis 2*
H0 – There is no significant association between monthly income and fashion purchase decision
making in relation to the smart phone advertising
H1 – There is a significant association between monthly income and fashion purchase decision
making in relation to the smart phone advertising
*Hypothesis 3*
H0 – There is a negative significance influence between factors (product, price, place and
promotion) and fashion purchase decisions towards smart phone advertising.
H1– There is a positive significance influence between factors (product, price, place and
promotion) and fashion purchase decisions towards smart phone advertising.
Refer to Appendix for further information
Interpretation of T-Test
Generally, T-test level of significance is accepted at 5%. In this regard, alternative
hypothesis is accepted when group means significantly differ and the value of significance two
tailed is less than 0.05. From the conducted analysis, if it is found that two tailed significance
value is incurred as 0.777, null hypothesis will be accepted and alternative is rejected. As a
result, from this study, it can be found that there is no impact of gender on the fashion purchase
decision making in relation to the smart phone advertising.
Interpretation of One Way ANOVA
In One Way ANOVA test, null hypothesis is rejected and alternative hypothesis is
accepted. This is because the level of significant occurred is less than 0.05. Thus, in this context,
it can be said that there is a significant association between monthly income and fashion
purchase decision making in relation to the smart phone advertising.
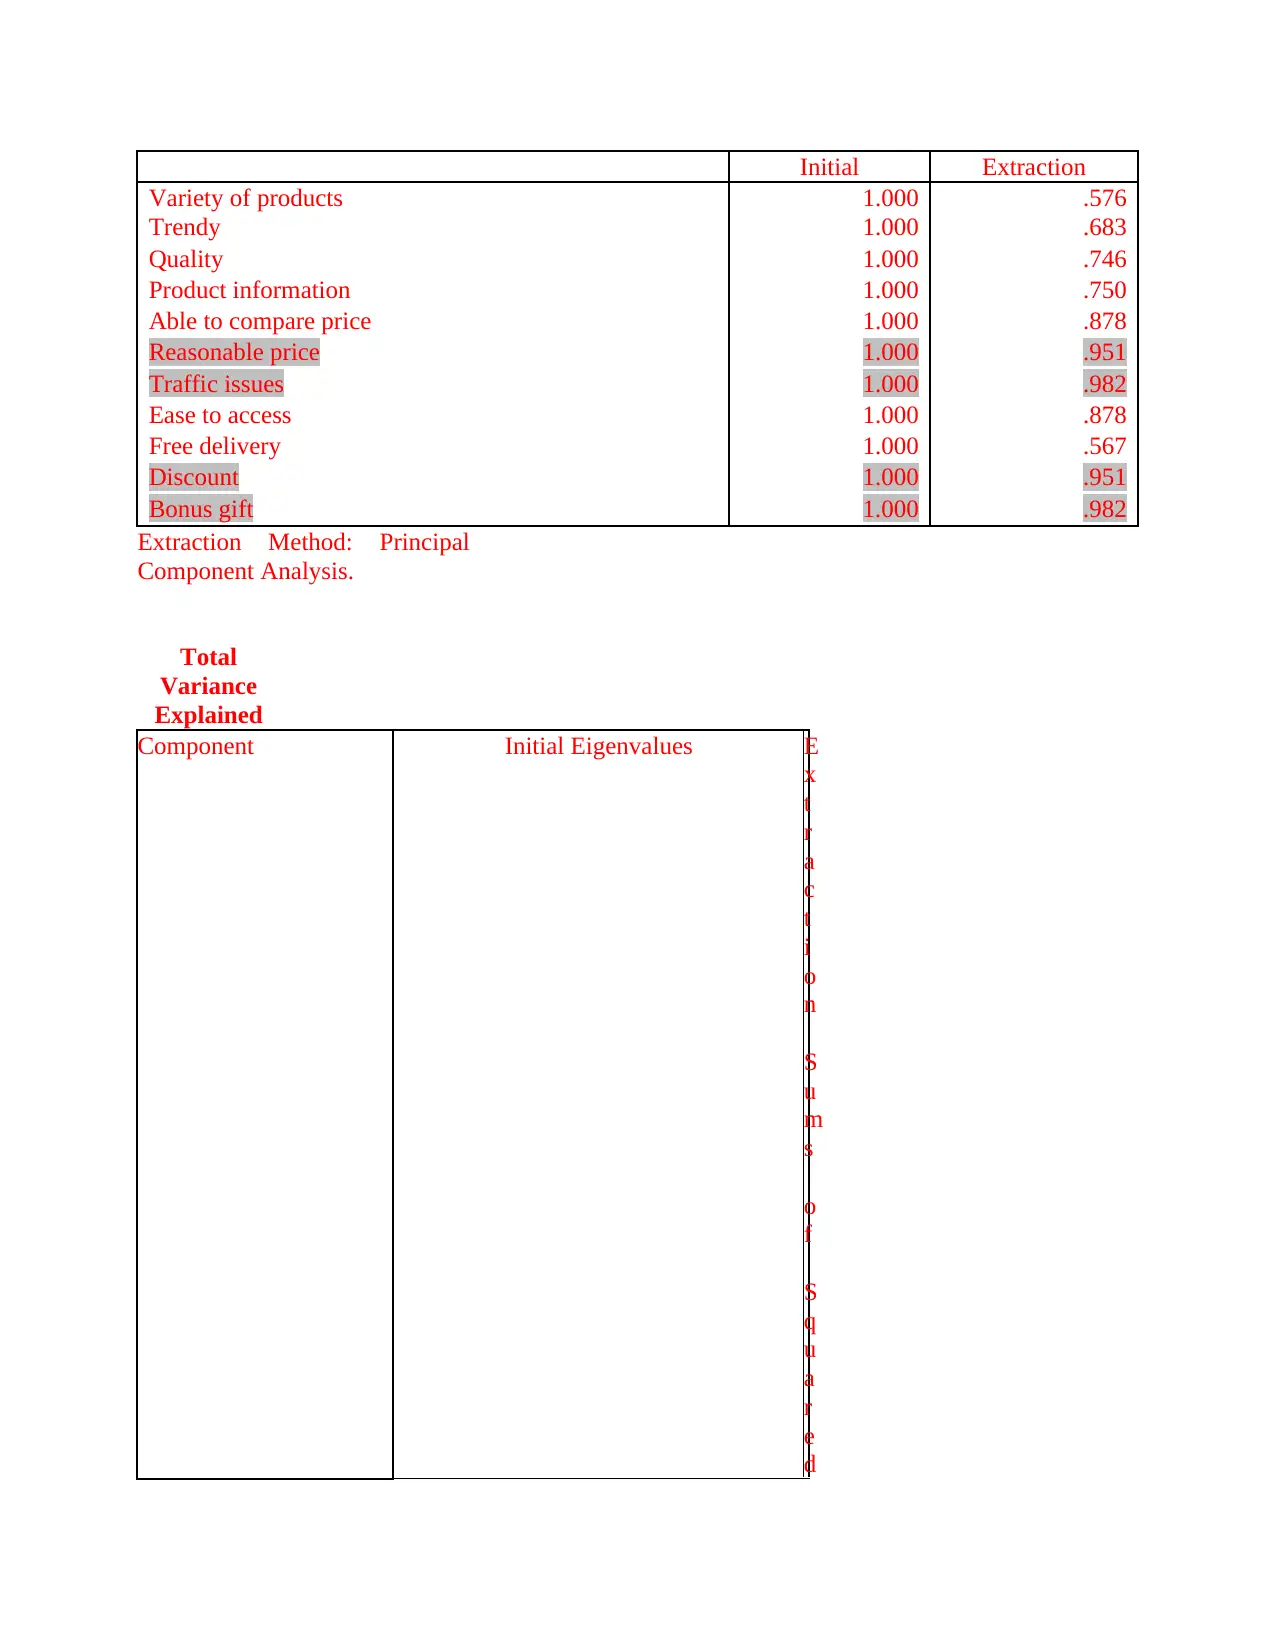
Interpretation of factor analysis
According to the review of the literature review author has found that marketing mix of
an organization has direct impact on customer’s purchase decision making process. So, on the
basis of this insights author has developed hypothesis for determining the most important factor
which can influence the customer’s behaviour towards the fashion organization. So, author has
formulated this hypothesis. Along with this, factor analysis is appropriate for determining some
specific factor so, application of this tool is presented as under:
Table 1: Factor analysis of respondents
Communalities
making in relation to the smart phone advertising
*Hypothesis 3*
H0 – There is a negative significance influence between factors (product, price, place and
promotion) and fashion purchase decisions towards smart phone advertising.
H1– There is a positive significance influence between factors (product, price, place and
promotion) and fashion purchase decisions towards smart phone advertising.
Refer to Appendix for further information
Interpretation of T-Test
Generally, T-test level of significance is accepted at 5%. In this regard, alternative
hypothesis is accepted when group means significantly differ and the value of significance two
tailed is less than 0.05. From the conducted analysis, if it is found that two tailed significance
value is incurred as 0.777, null hypothesis will be accepted and alternative is rejected. As a
result, from this study, it can be found that there is no impact of gender on the fashion purchase
decision making in relation to the smart phone advertising.
Interpretation of One Way ANOVA
In One Way ANOVA test, null hypothesis is rejected and alternative hypothesis is
accepted. This is because the level of significant occurred is less than 0.05. Thus, in this context,
it can be said that there is a significant association between monthly income and fashion
purchase decision making in relation to the smart phone advertising.
Interpretation of factor analysis
According to the review of the literature review author has found that marketing mix of
an organization has direct impact on customer’s purchase decision making process. So, on the
basis of this insights author has developed hypothesis for determining the most important factor
which can influence the customer’s behaviour towards the fashion organization. So, author has
formulated this hypothesis. Along with this, factor analysis is appropriate for determining some
specific factor so, application of this tool is presented as under:
Table 1: Factor analysis of respondents
Communalities
⊘ This is a preview!⊘
Do you want full access?
Subscribe today to unlock all pages.
Trusted by 1+ million students worldwide
Initial Extraction
Variety of products 1.000 .576
Trendy 1.000 .683
Quality 1.000 .746
Product information 1.000 .750
Able to compare price 1.000 .878
Reasonable price 1.000 .951
Traffic issues 1.000 .982
Ease to access 1.000 .878
Free delivery 1.000 .567
Discount 1.000 .951
Bonus gift 1.000 .982
Extraction Method: Principal
Component Analysis.
Total
Variance
Explained
Component Initial Eigenvalues E
x
t
r
a
c
t
i
o
n
S
u
m
s
o
f
S
q
u
a
r
e
d
Paraphrase This Document
Need a fresh take? Get an instant paraphrase of this document with our AI Paraphraser
L
o
a
d
i
n
g
s
Total
% of
Variance
Cumulative
% Total
% of
Variance
Cumulative
%
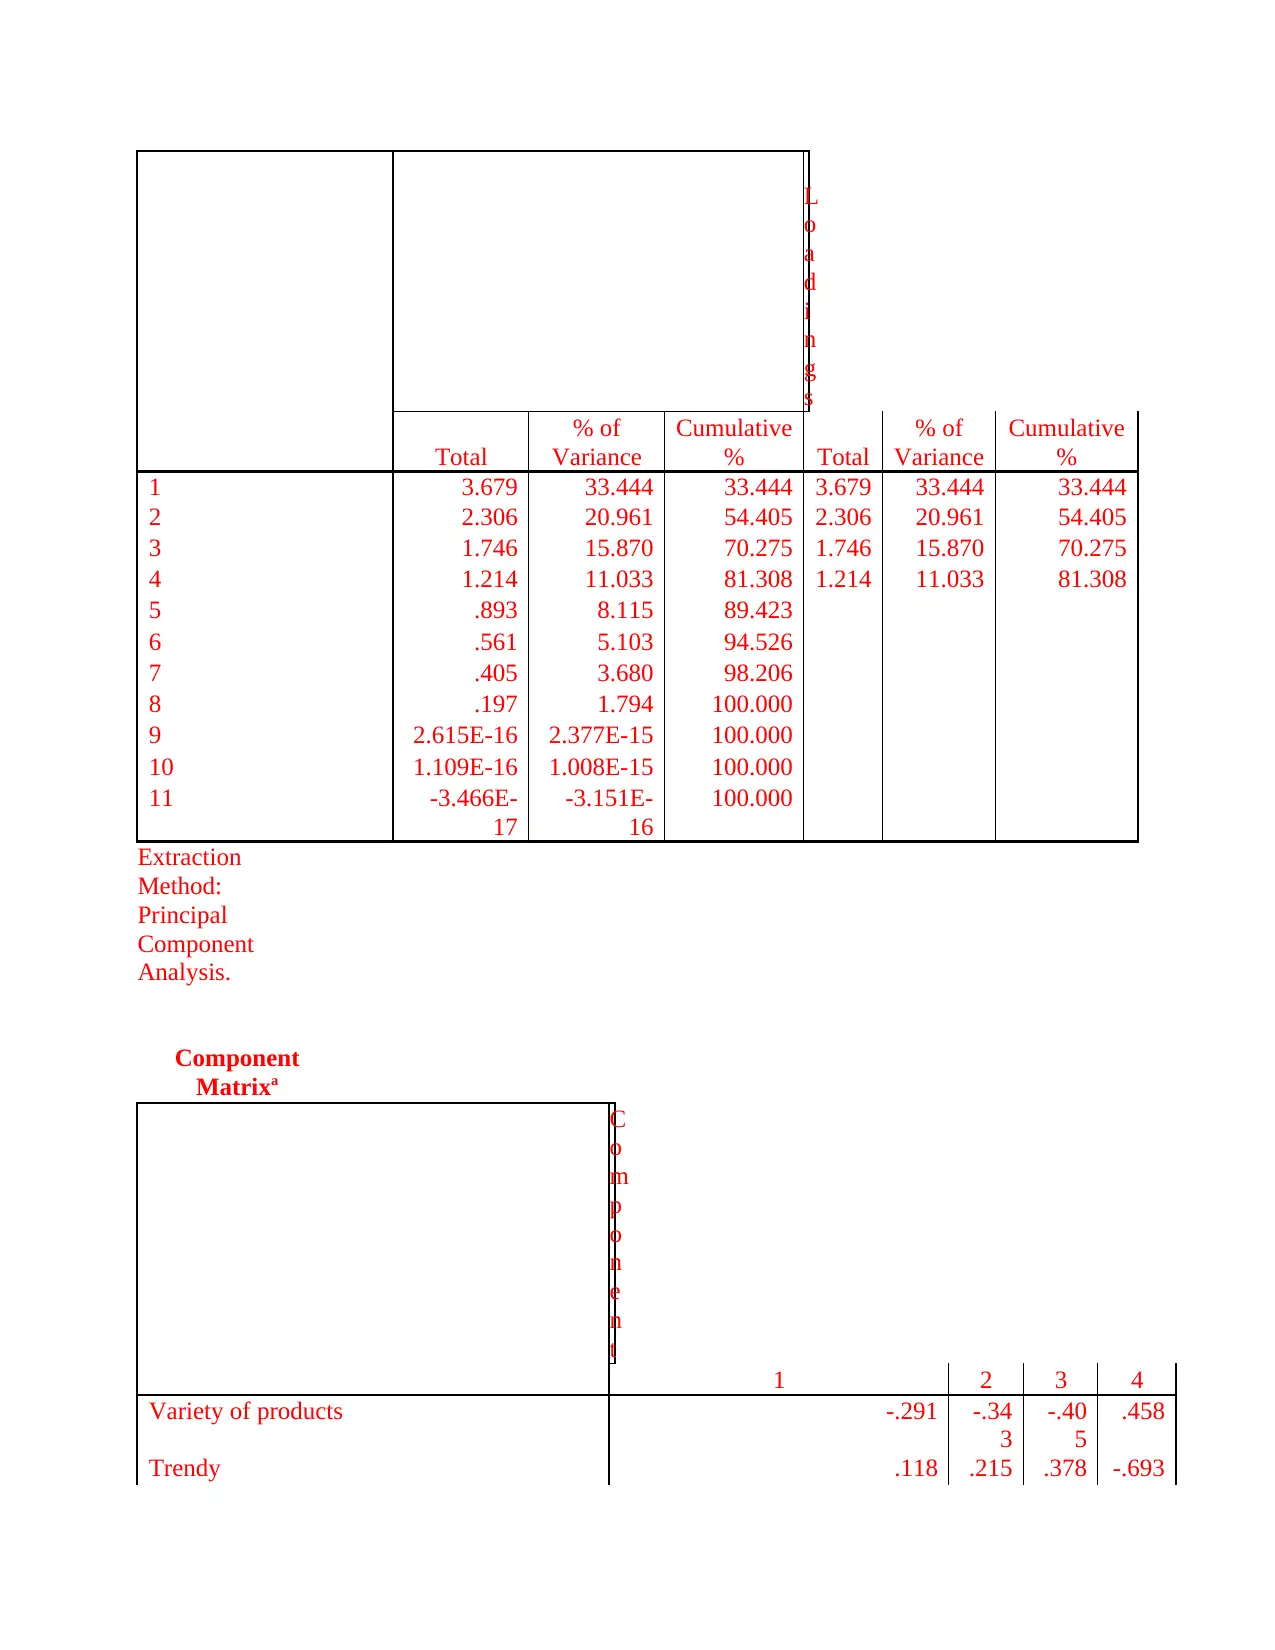
1 3.679 33.444 33.444 3.679 33.444 33.444
2 2.306 20.961 54.405 2.306 20.961 54.405
3 1.746 15.870 70.275 1.746 15.870 70.275
4 1.214 11.033 81.308 1.214 11.033 81.308
5 .893 8.115 89.423
6 .561 5.103 94.526
7 .405 3.680 98.206
8 .197 1.794 100.000
9 2.615E-16 2.377E-15 100.000
10 1.109E-16 1.008E-15 100.000
11 -3.466E-
17
-3.151E-
16
100.000
Extraction
Method:
Principal
Component
Analysis.
Component
Matrixa
C
o
m
p
o
n
e
n
t
1 2 3 4
Variety of products -.291 -.34
3
-.40
5
.458
Trendy .118 .215 .378 -.693
o
a
d
i
n
g
s
Total
% of
Variance
Cumulative
% Total
% of
Variance
Cumulative
%
1 3.679 33.444 33.444 3.679 33.444 33.444
2 2.306 20.961 54.405 2.306 20.961 54.405
3 1.746 15.870 70.275 1.746 15.870 70.275
4 1.214 11.033 81.308 1.214 11.033 81.308
5 .893 8.115 89.423
6 .561 5.103 94.526
7 .405 3.680 98.206
8 .197 1.794 100.000
9 2.615E-16 2.377E-15 100.000
10 1.109E-16 1.008E-15 100.000
11 -3.466E-
17
-3.151E-
16
100.000
Extraction
Method:
Principal
Component
Analysis.
Component
Matrixa
C
o
m
p
o
n
e
n
t
1 2 3 4
Variety of products -.291 -.34
3
-.40
5
.458
Trendy .118 .215 .378 -.693
Quality .807 -.05
8
.229 .197
Product information .529 .489 -.22
4
-.425
Able to compare price -.771 -.19
4
.494 -.048
Reasonable price .701 -.36
1
.551 .158
Traffic issues -.191 .856 .321 .331
Ease to access -.771 -.19
4
.494 -.048
Free delivery .636 .312 -.18
4
.176
Discount .701 -.36
1
.551 .158
Bonus gift -.191 .856 .321 .331
Extraction Method:
Principal
Component
Analysis.
a. 4 components
extracted.
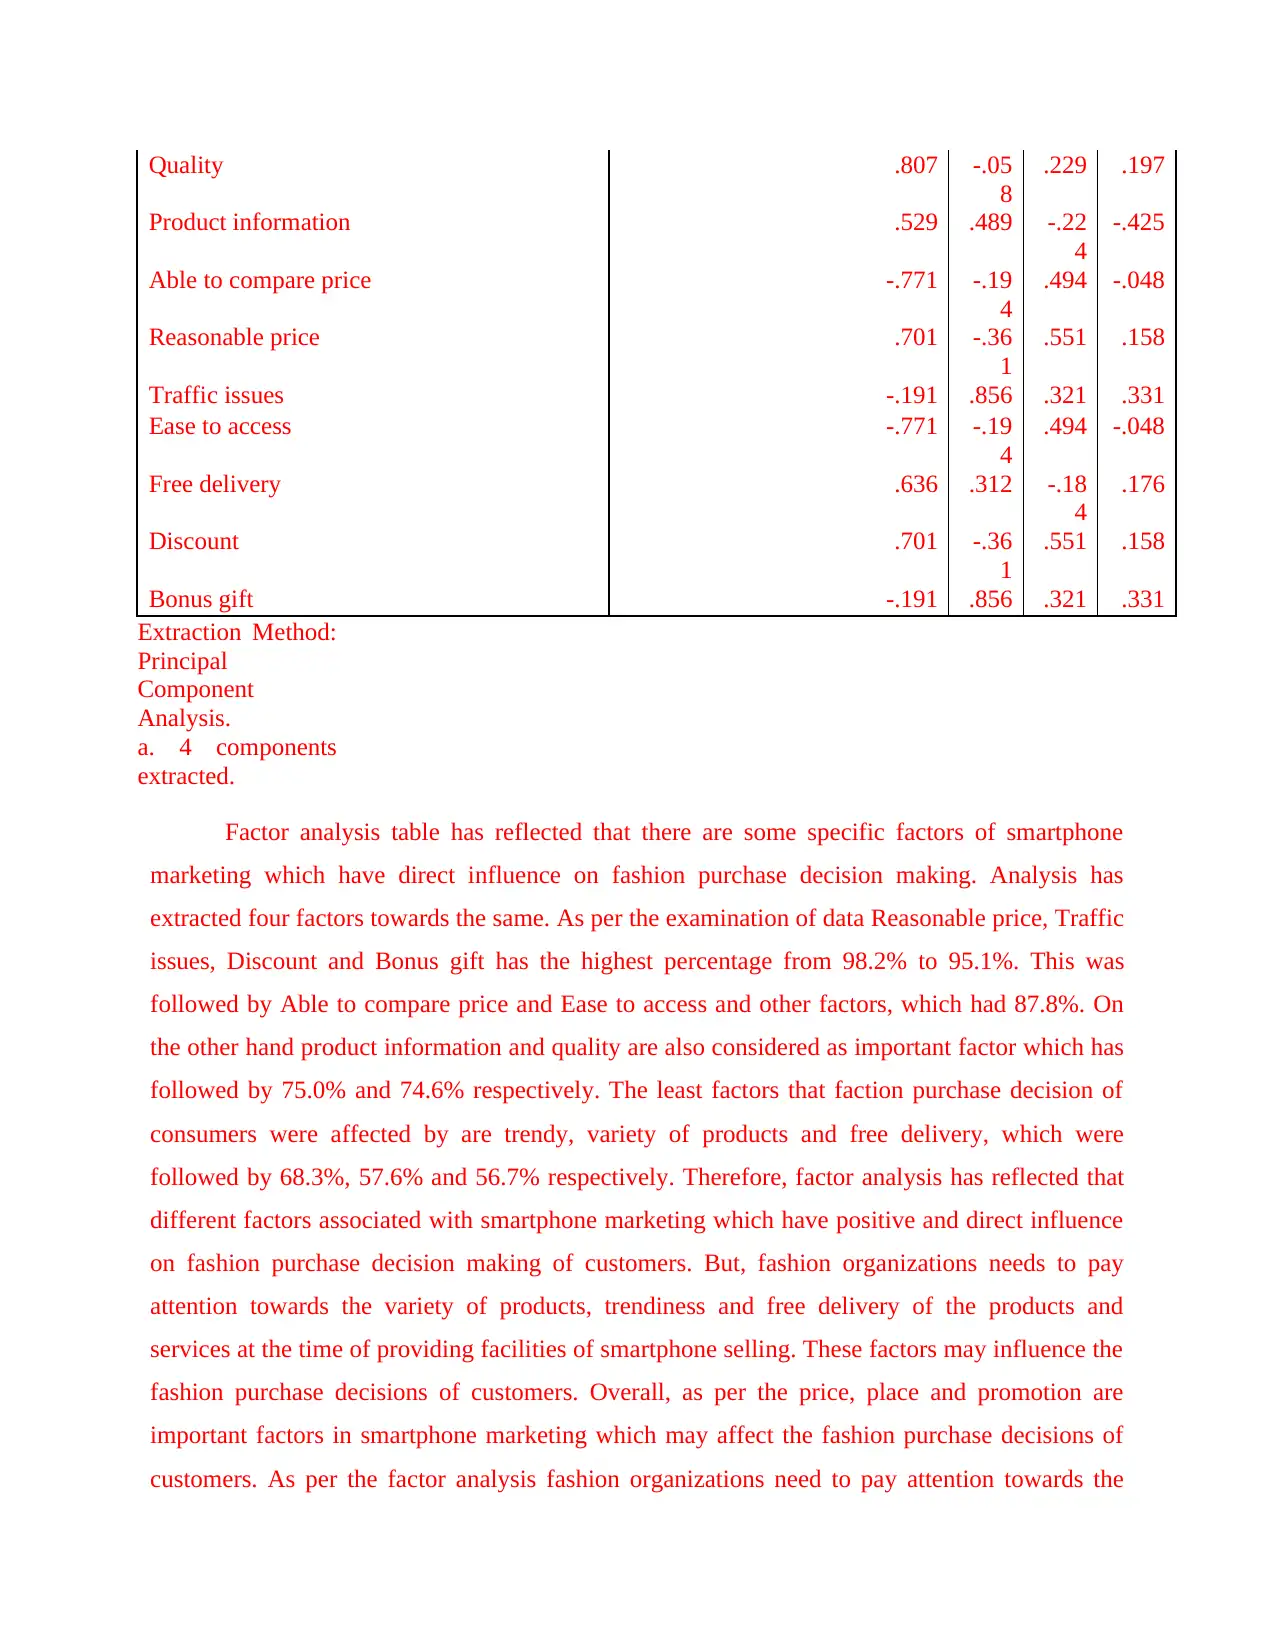
Factor analysis table has reflected that there are some specific factors of smartphone
marketing which have direct influence on fashion purchase decision making. Analysis has
extracted four factors towards the same. As per the examination of data Reasonable price, Traffic
issues, Discount and Bonus gift has the highest percentage from 98.2% to 95.1%. This was
followed by Able to compare price and Ease to access and other factors, which had 87.8%. On
the other hand product information and quality are also considered as important factor which has
followed by 75.0% and 74.6% respectively. The least factors that faction purchase decision of
consumers were affected by are trendy, variety of products and free delivery, which were
followed by 68.3%, 57.6% and 56.7% respectively. Therefore, factor analysis has reflected that
different factors associated with smartphone marketing which have positive and direct influence
on fashion purchase decision making of customers. But, fashion organizations needs to pay
attention towards the variety of products, trendiness and free delivery of the products and
services at the time of providing facilities of smartphone selling. These factors may influence the
fashion purchase decisions of customers. Overall, as per the price, place and promotion are
important factors in smartphone marketing which may affect the fashion purchase decisions of
customers. As per the factor analysis fashion organizations need to pay attention towards the
8
.229 .197
Product information .529 .489 -.22
4
-.425
Able to compare price -.771 -.19
4
.494 -.048
Reasonable price .701 -.36
1
.551 .158
Traffic issues -.191 .856 .321 .331
Ease to access -.771 -.19
4
.494 -.048
Free delivery .636 .312 -.18
4
.176
Discount .701 -.36
1
.551 .158
Bonus gift -.191 .856 .321 .331
Extraction Method:
Principal
Component
Analysis.
a. 4 components
extracted.
Factor analysis table has reflected that there are some specific factors of smartphone
marketing which have direct influence on fashion purchase decision making. Analysis has
extracted four factors towards the same. As per the examination of data Reasonable price, Traffic
issues, Discount and Bonus gift has the highest percentage from 98.2% to 95.1%. This was
followed by Able to compare price and Ease to access and other factors, which had 87.8%. On
the other hand product information and quality are also considered as important factor which has
followed by 75.0% and 74.6% respectively. The least factors that faction purchase decision of
consumers were affected by are trendy, variety of products and free delivery, which were
followed by 68.3%, 57.6% and 56.7% respectively. Therefore, factor analysis has reflected that
different factors associated with smartphone marketing which have positive and direct influence
on fashion purchase decision making of customers. But, fashion organizations needs to pay
attention towards the variety of products, trendiness and free delivery of the products and
services at the time of providing facilities of smartphone selling. These factors may influence the
fashion purchase decisions of customers. Overall, as per the price, place and promotion are
important factors in smartphone marketing which may affect the fashion purchase decisions of
customers. As per the factor analysis fashion organizations need to pay attention towards the
⊘ This is a preview!⊘
Do you want full access?
Subscribe today to unlock all pages.
Trusted by 1+ million students worldwide
improving products for changing buying behaviour of consumers. So, vefrification of hypothesis
has reflected that researcher needs to accept the alternative hypothesis and reject the null.
Therefore, factor analysis has reflected that there is a positive significance influence between
factors (product, price, place and promotion) and fashion purchase decisions towards smart
phone advertising.
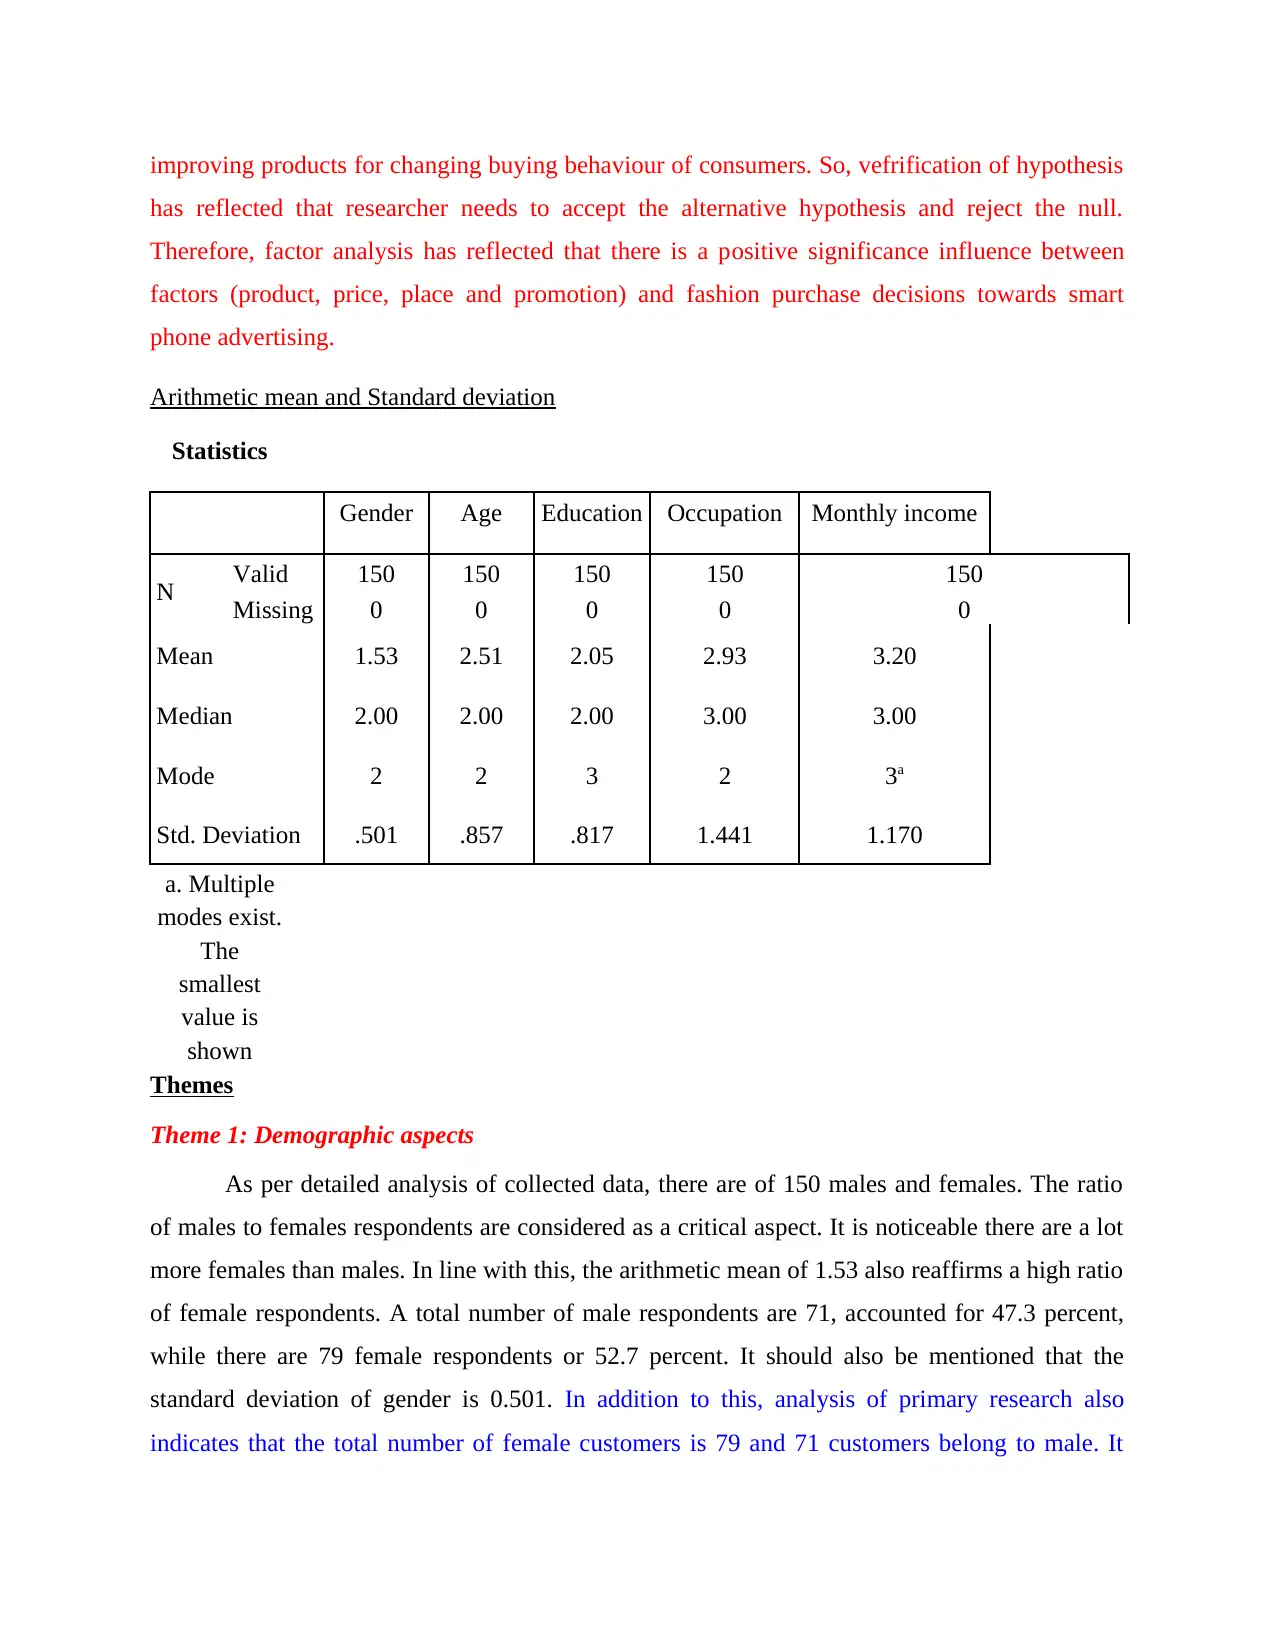
Arithmetic mean and Standard deviation
Statistics
Gender Age Education Occupation Monthly income
N Valid 150 150 150 150 150
Missing 0 0 0 0 0
Mean 1.53 2.51 2.05 2.93 3.20
Median 2.00 2.00 2.00 3.00 3.00
Mode 2 2 3 2 3a
Std. Deviation .501 .857 .817 1.441 1.170
a. Multiple
modes exist.
The
smallest
value is
shown
Themes
Theme 1: Demographic aspects
As per detailed analysis of collected data, there are of 150 males and females. The ratio
of males to females respondents are considered as a critical aspect. It is noticeable there are a lot
more females than males. In line with this, the arithmetic mean of 1.53 also reaffirms a high ratio
of female respondents. A total number of male respondents are 71, accounted for 47.3 percent,
while there are 79 female respondents or 52.7 percent. It should also be mentioned that the
standard deviation of gender is 0.501. In addition to this, analysis of primary research also
indicates that the total number of female customers is 79 and 71 customers belong to male. It
has reflected that researcher needs to accept the alternative hypothesis and reject the null.
Therefore, factor analysis has reflected that there is a positive significance influence between
factors (product, price, place and promotion) and fashion purchase decisions towards smart
phone advertising.
Arithmetic mean and Standard deviation
Statistics
Gender Age Education Occupation Monthly income
N Valid 150 150 150 150 150
Missing 0 0 0 0 0
Mean 1.53 2.51 2.05 2.93 3.20
Median 2.00 2.00 2.00 3.00 3.00
Mode 2 2 3 2 3a
Std. Deviation .501 .857 .817 1.441 1.170
a. Multiple
modes exist.
The
smallest
value is
shown
Themes
Theme 1: Demographic aspects
As per detailed analysis of collected data, there are of 150 males and females. The ratio
of males to females respondents are considered as a critical aspect. It is noticeable there are a lot
more females than males. In line with this, the arithmetic mean of 1.53 also reaffirms a high ratio
of female respondents. A total number of male respondents are 71, accounted for 47.3 percent,
while there are 79 female respondents or 52.7 percent. It should also be mentioned that the
standard deviation of gender is 0.501. In addition to this, analysis of primary research also
indicates that the total number of female customers is 79 and 71 customers belong to male. It
Paraphrase This Document
Need a fresh take? Get an instant paraphrase of this document with our AI Paraphraser
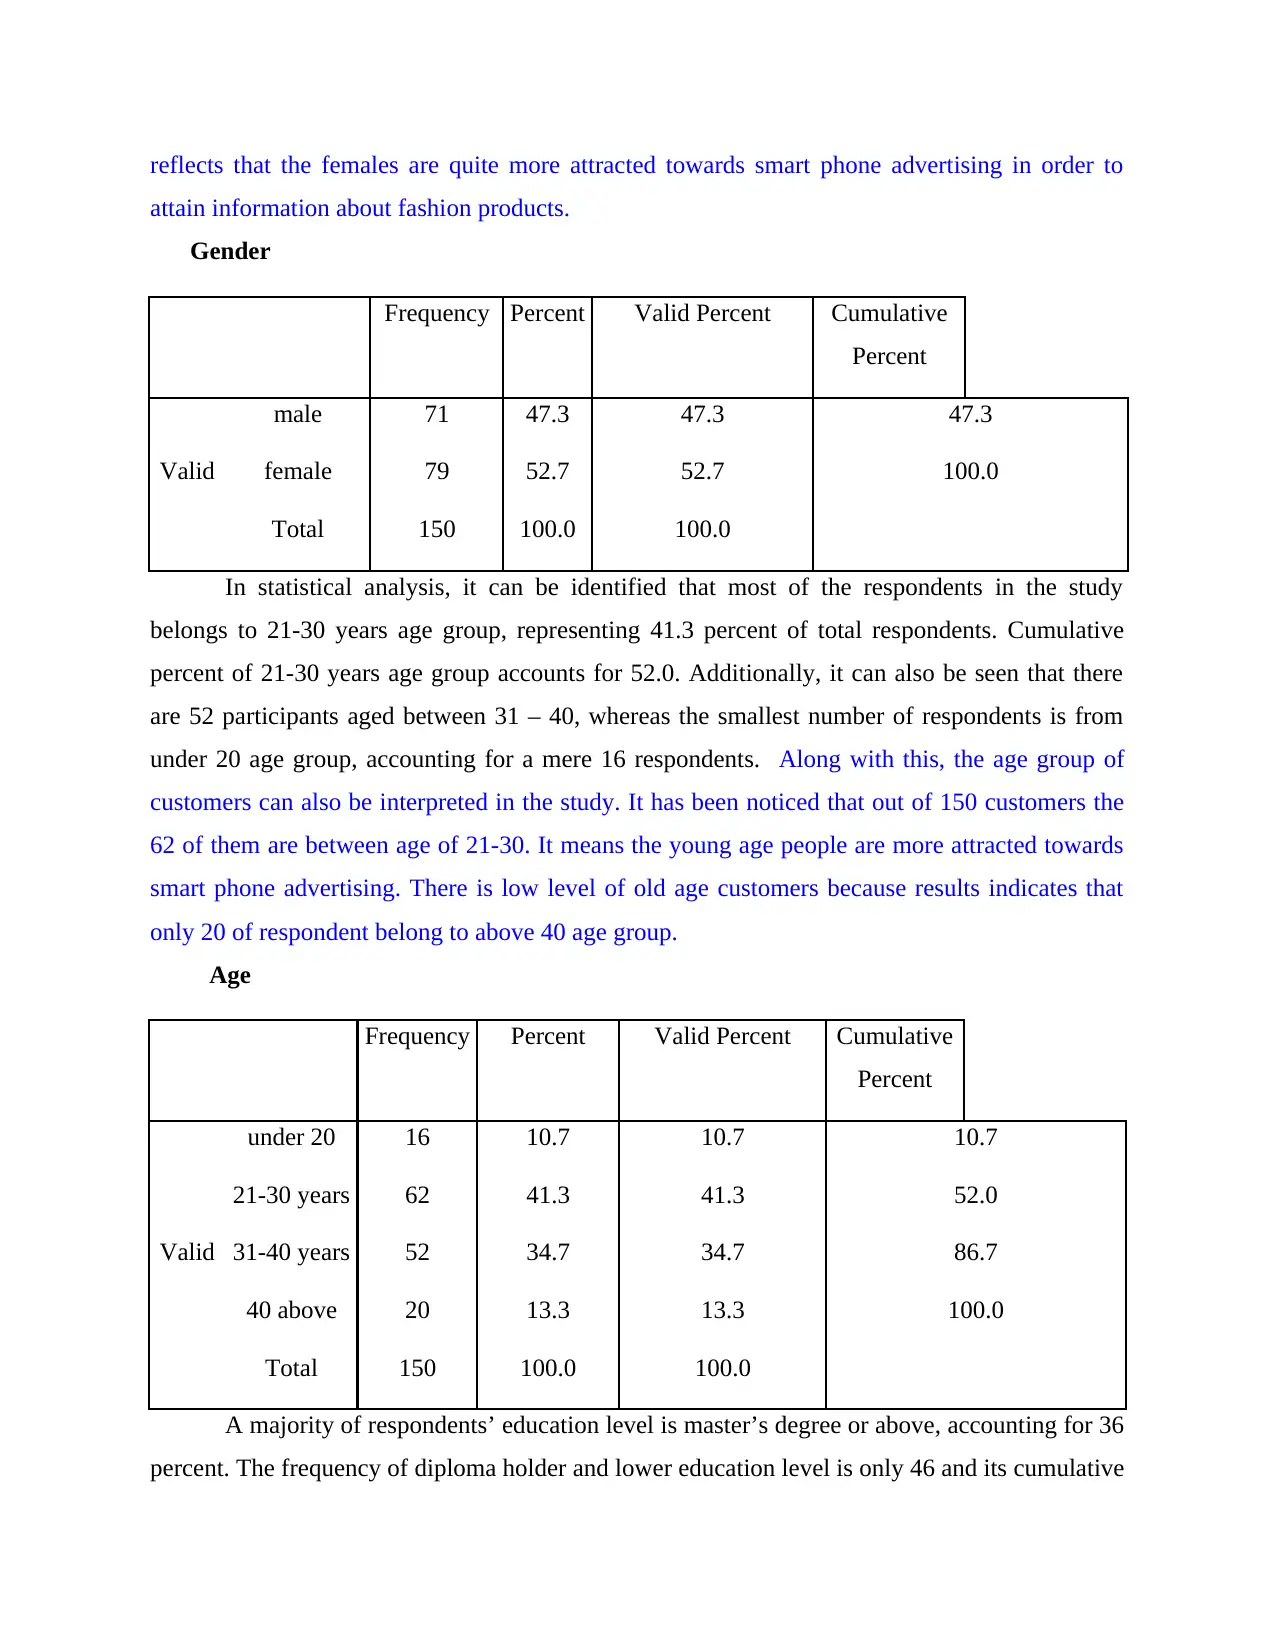
reflects that the females are quite more attracted towards smart phone advertising in order to
attain information about fashion products.
Gender
Frequency Percent Valid Percent Cumulative
Percent
Valid
male 71 47.3 47.3 47.3
female 79 52.7 52.7 100.0
Total 150 100.0 100.0
In statistical analysis, it can be identified that most of the respondents in the study
belongs to 21-30 years age group, representing 41.3 percent of total respondents. Cumulative
percent of 21-30 years age group accounts for 52.0. Additionally, it can also be seen that there
are 52 participants aged between 31 – 40, whereas the smallest number of respondents is from
under 20 age group, accounting for a mere 16 respondents. Along with this, the age group of
customers can also be interpreted in the study. It has been noticed that out of 150 customers the
62 of them are between age of 21-30. It means the young age people are more attracted towards
smart phone advertising. There is low level of old age customers because results indicates that
only 20 of respondent belong to above 40 age group.
Age
Frequency Percent Valid Percent Cumulative
Percent
Valid
under 20 16 10.7 10.7 10.7
21-30 years 62 41.3 41.3 52.0
31-40 years 52 34.7 34.7 86.7
40 above 20 13.3 13.3 100.0
Total 150 100.0 100.0
A majority of respondents’ education level is master’s degree or above, accounting for 36
percent. The frequency of diploma holder and lower education level is only 46 and its cumulative
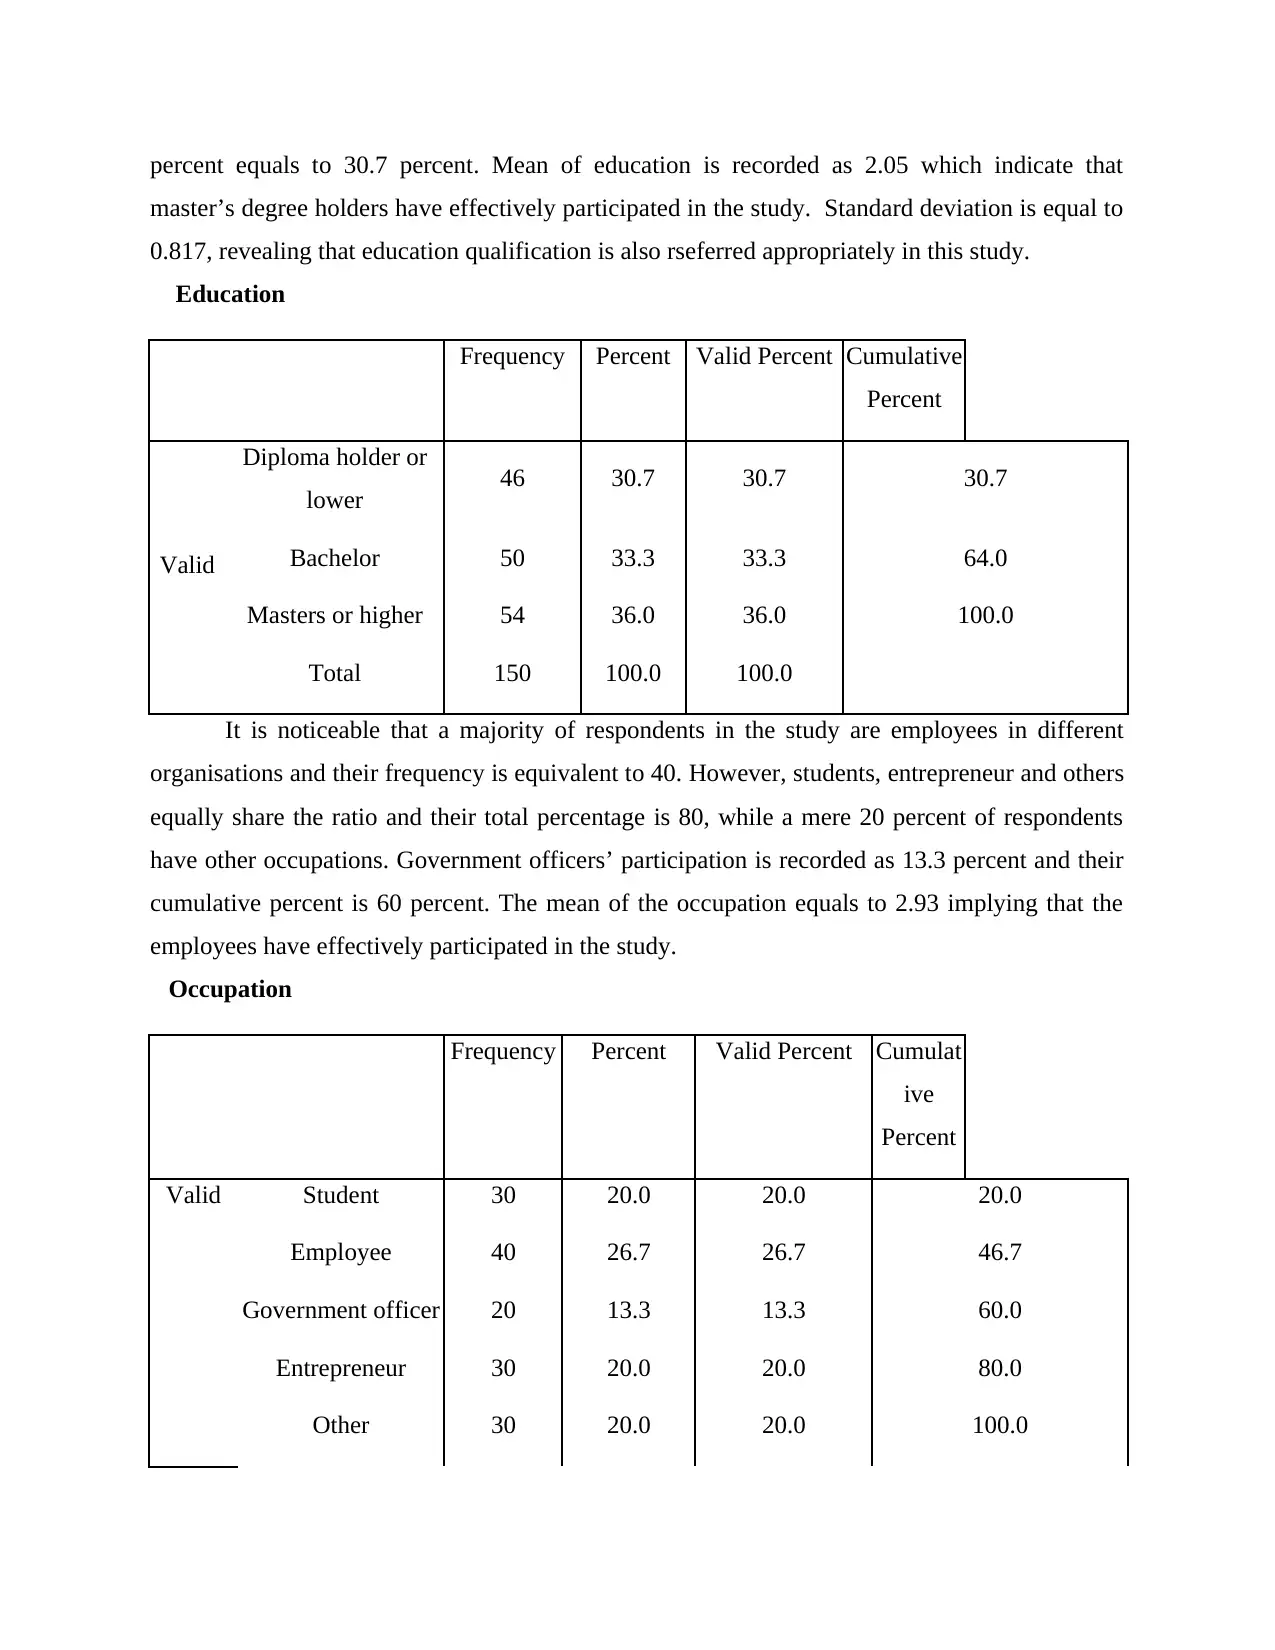
percent equals to 30.7 percent. Mean of education is recorded as 2.05 which indicate that
master’s degree holders have effectively participated in the study. Standard deviation is equal to
0.817, revealing that education qualification is also rseferred appropriately in this study.
Education
Frequency Percent Valid Percent Cumulative
Percent
Valid
Diploma holder or
lower 46 30.7 30.7 30.7
Bachelor 50 33.3 33.3 64.0
Masters or higher 54 36.0 36.0 100.0
Total 150 100.0 100.0
It is noticeable that a majority of respondents in the study are employees in different
organisations and their frequency is equivalent to 40. However, students, entrepreneur and others
equally share the ratio and their total percentage is 80, while a mere 20 percent of respondents
have other occupations. Government officers’ participation is recorded as 13.3 percent and their
cumulative percent is 60 percent. The mean of the occupation equals to 2.93 implying that the
employees have effectively participated in the study.
Occupation
Frequency Percent Valid Percent Cumulat
ive
Percent
Valid Student 30 20.0 20.0 20.0
Employee 40 26.7 26.7 46.7
Government officer 20 13.3 13.3 60.0
Entrepreneur 30 20.0 20.0 80.0
Other 30 20.0 20.0 100.0
⊘ This is a preview!⊘
Do you want full access?
Subscribe today to unlock all pages.
Trusted by 1+ million students worldwide
Total 150 100.0 100.0
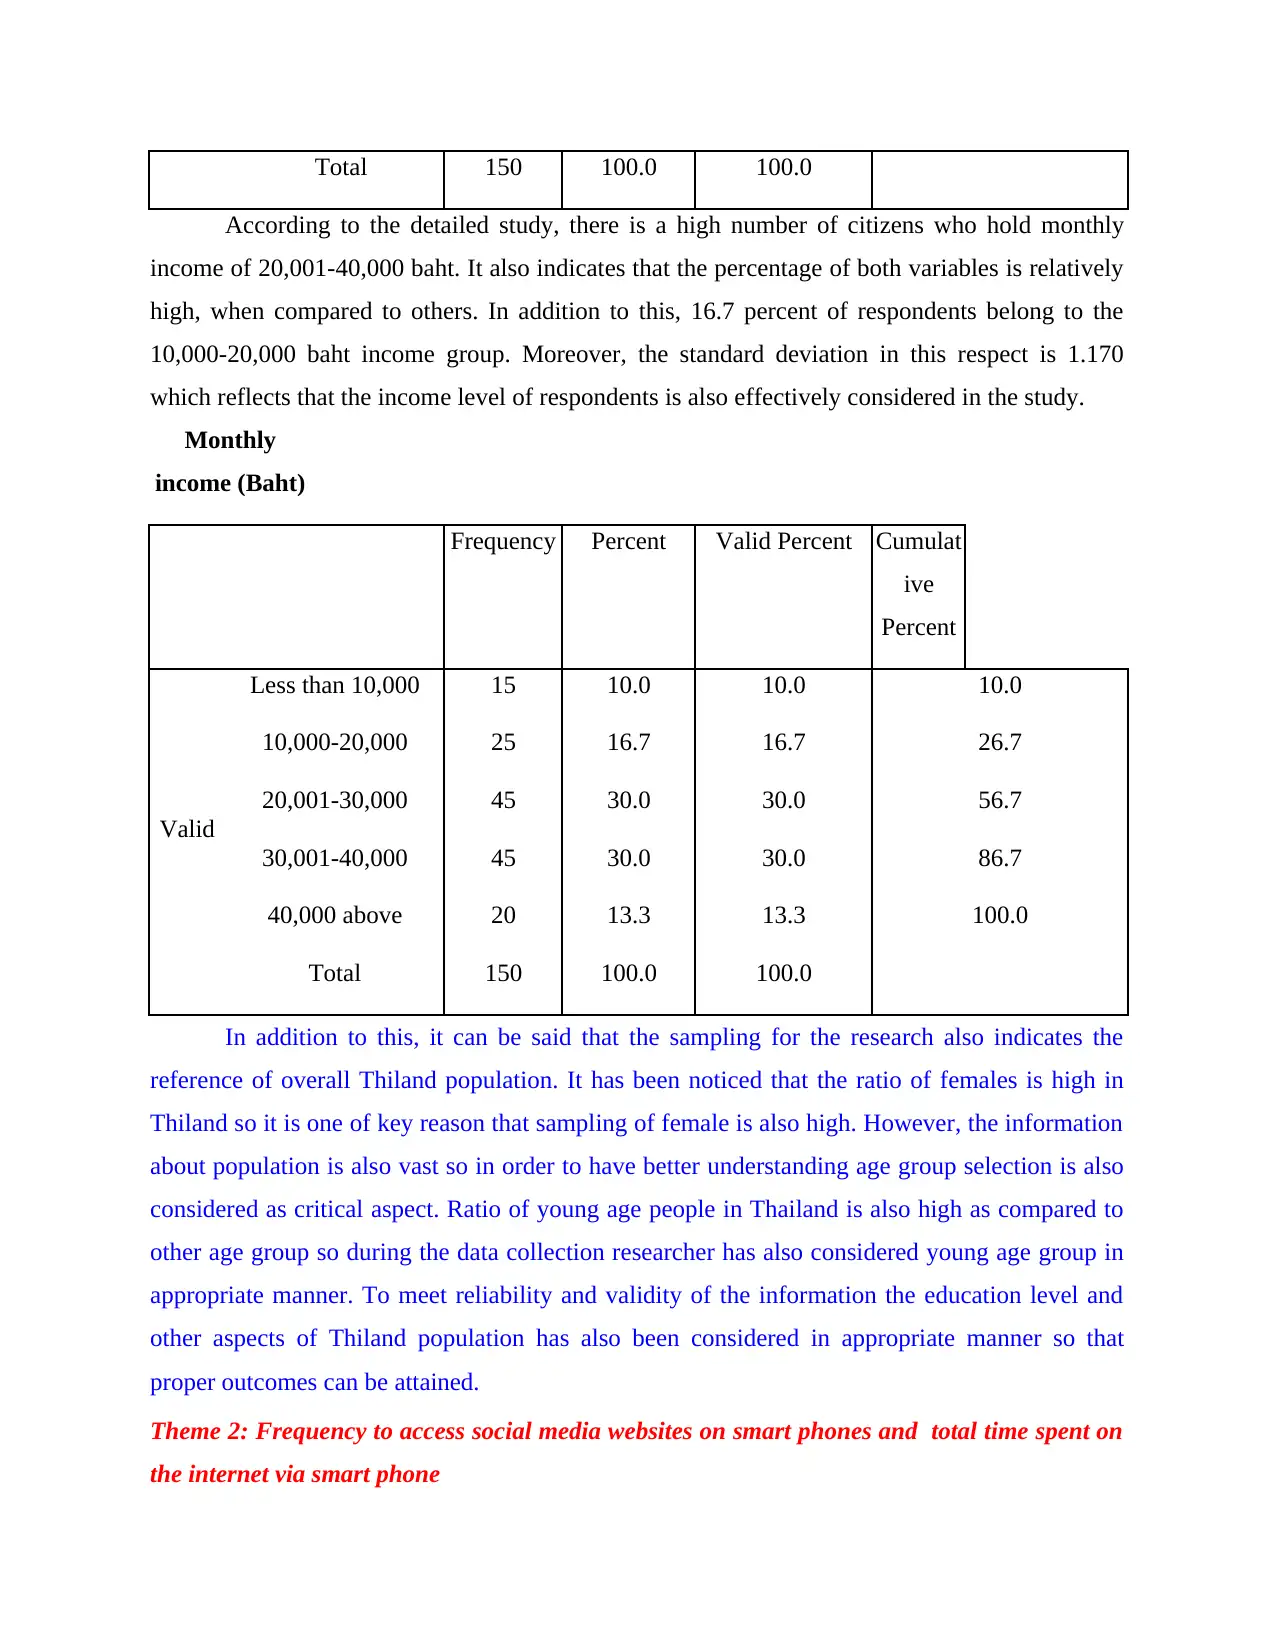
According to the detailed study, there is a high number of citizens who hold monthly
income of 20,001-40,000 baht. It also indicates that the percentage of both variables is relatively
high, when compared to others. In addition to this, 16.7 percent of respondents belong to the
10,000-20,000 baht income group. Moreover, the standard deviation in this respect is 1.170
which reflects that the income level of respondents is also effectively considered in the study.
Monthly
income (Baht)
Frequency Percent Valid Percent Cumulat
ive
Percent
Valid
Less than 10,000 15 10.0 10.0 10.0
10,000-20,000 25 16.7 16.7 26.7
20,001-30,000 45 30.0 30.0 56.7
30,001-40,000 45 30.0 30.0 86.7
40,000 above 20 13.3 13.3 100.0
Total 150 100.0 100.0
In addition to this, it can be said that the sampling for the research also indicates the
reference of overall Thiland population. It has been noticed that the ratio of females is high in
Thiland so it is one of key reason that sampling of female is also high. However, the information
about population is also vast so in order to have better understanding age group selection is also
considered as critical aspect. Ratio of young age people in Thailand is also high as compared to
other age group so during the data collection researcher has also considered young age group in
appropriate manner. To meet reliability and validity of the information the education level and
other aspects of Thiland population has also been considered in appropriate manner so that
proper outcomes can be attained.
Theme 2: Frequency to access social media websites on smart phones and total time spent on
the internet via smart phone
Paraphrase This Document
Need a fresh take? Get an instant paraphrase of this document with our AI Paraphraser
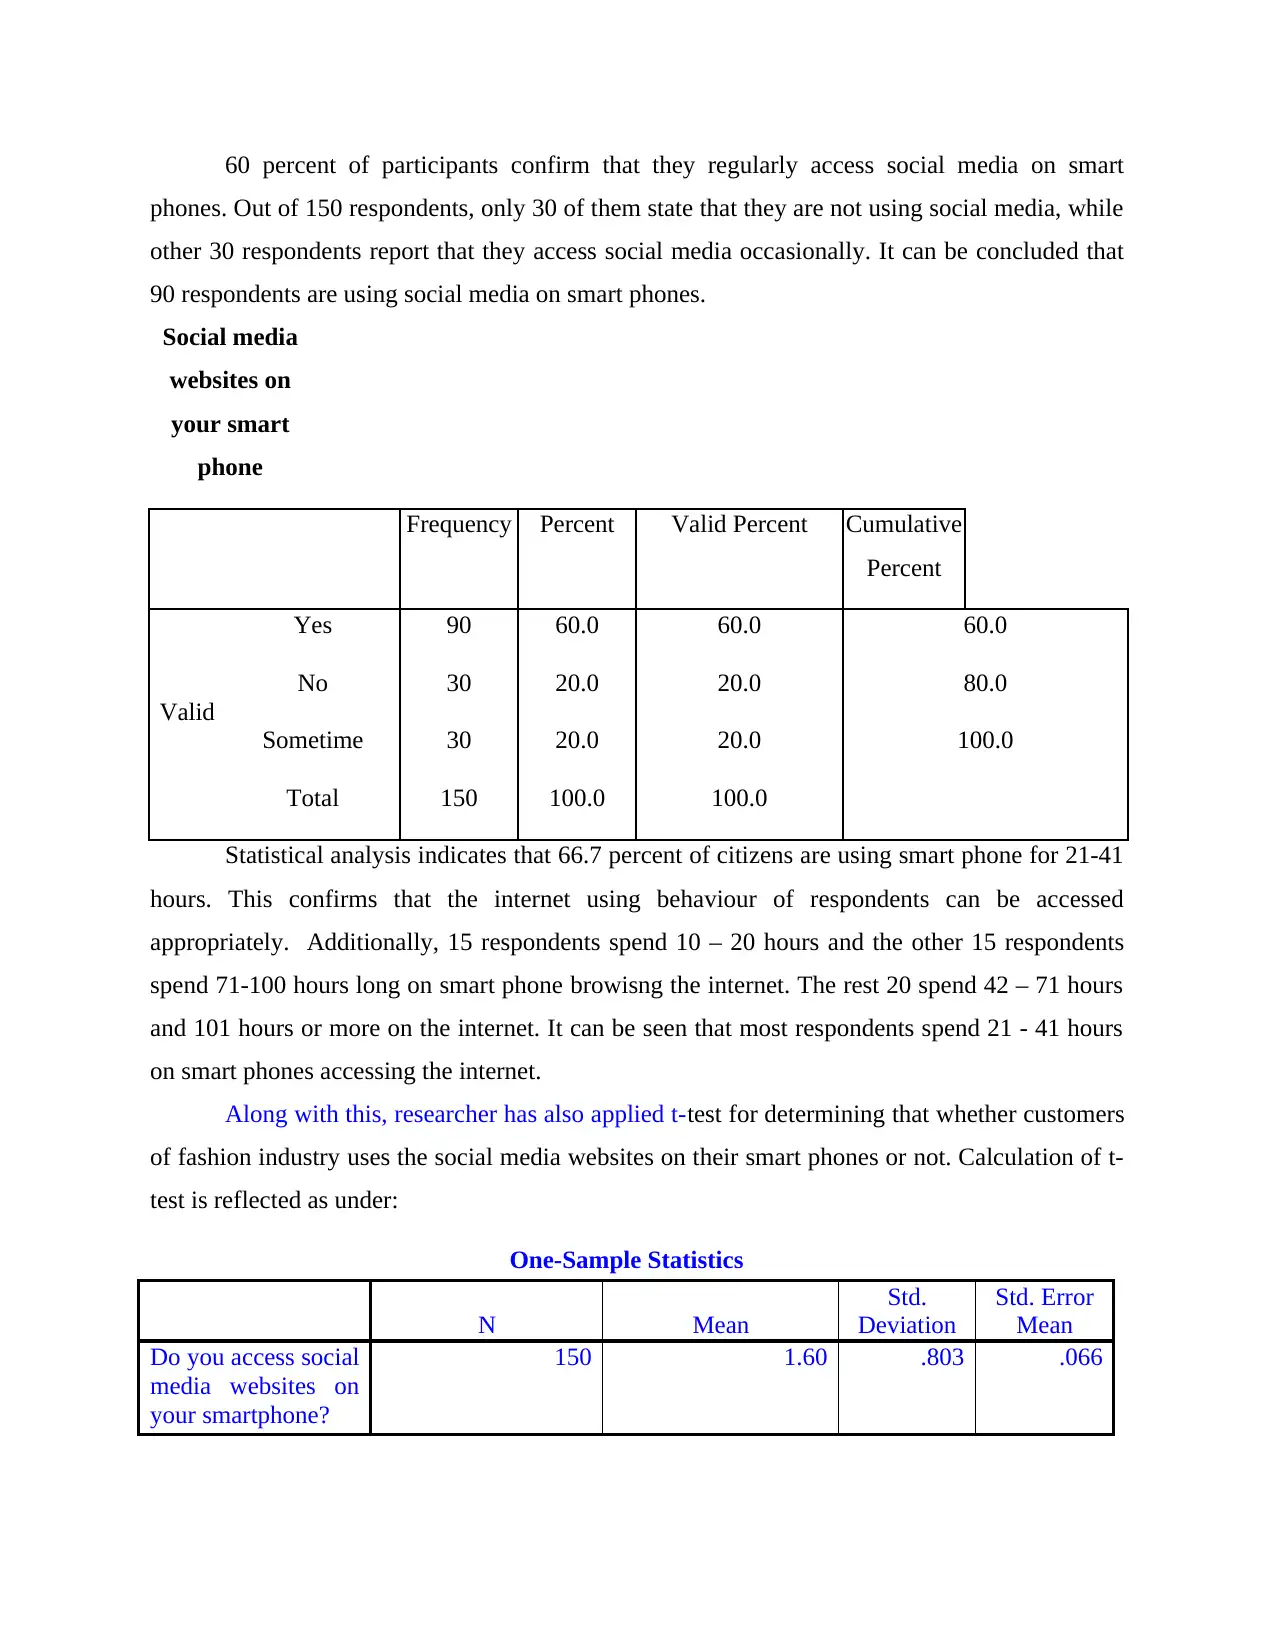
60 percent of participants confirm that they regularly access social media on smart
phones. Out of 150 respondents, only 30 of them state that they are not using social media, while
other 30 respondents report that they access social media occasionally. It can be concluded that
90 respondents are using social media on smart phones.
Social media
websites on
your smart
phone
Frequency Percent Valid Percent Cumulative
Percent
Valid
Yes 90 60.0 60.0 60.0
No 30 20.0 20.0 80.0
Sometime 30 20.0 20.0 100.0
Total 150 100.0 100.0
Statistical analysis indicates that 66.7 percent of citizens are using smart phone for 21-41
hours. This confirms that the internet using behaviour of respondents can be accessed
appropriately. Additionally, 15 respondents spend 10 – 20 hours and the other 15 respondents
spend 71-100 hours long on smart phone browisng the internet. The rest 20 spend 42 – 71 hours
and 101 hours or more on the internet. It can be seen that most respondents spend 21 - 41 hours
on smart phones accessing the internet.
Along with this, researcher has also applied t-test for determining that whether customers
of fashion industry uses the social media websites on their smart phones or not. Calculation of t-
test is reflected as under:
One-Sample Statistics
N Mean
Std.
Deviation
Std. Error
Mean
Do you access social
media websites on
your smartphone?
150 1.60 .803 .066
One-Sample Test
Test Value = 0
t df
Sig. (2-
tailed)
Mean
Differenc
e
95% Confidence
Interval of the
Difference
Lower Upper
Do you access
social media
websites on
your
smartphone?
24.413 149 .000 1.600 1.47 1.73
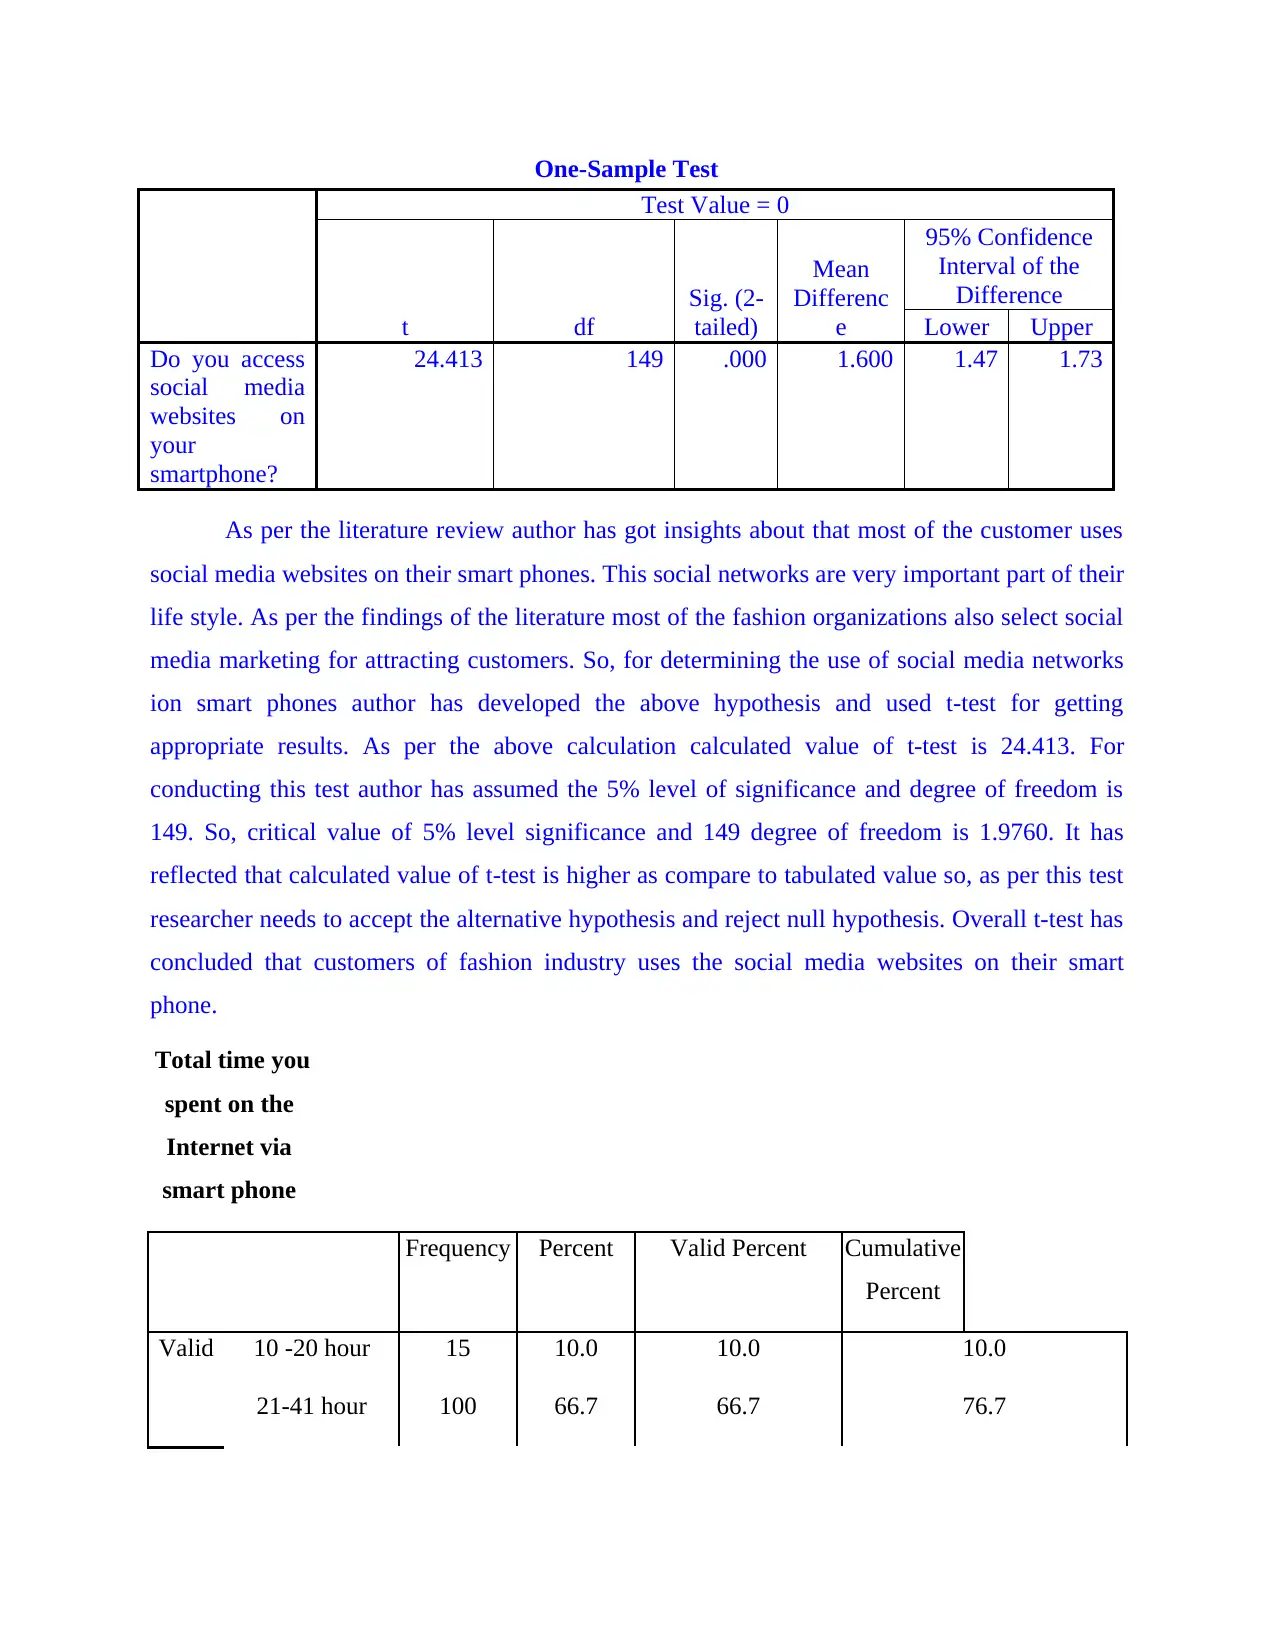
As per the literature review author has got insights about that most of the customer uses
social media websites on their smart phones. This social networks are very important part of their
life style. As per the findings of the literature most of the fashion organizations also select social
media marketing for attracting customers. So, for determining the use of social media networks
ion smart phones author has developed the above hypothesis and used t-test for getting
appropriate results. As per the above calculation calculated value of t-test is 24.413. For
conducting this test author has assumed the 5% level of significance and degree of freedom is
149. So, critical value of 5% level significance and 149 degree of freedom is 1.9760. It has
reflected that calculated value of t-test is higher as compare to tabulated value so, as per this test
researcher needs to accept the alternative hypothesis and reject null hypothesis. Overall t-test has
concluded that customers of fashion industry uses the social media websites on their smart
phone.
Total time you
spent on the
Internet via
smart phone
Frequency Percent Valid Percent Cumulative
Percent
Valid 10 -20 hour 15 10.0 10.0 10.0
21-41 hour 100 66.7 66.7 76.7
Test Value = 0
t df
Sig. (2-
tailed)
Mean
Differenc
e
95% Confidence
Interval of the
Difference
Lower Upper
Do you access
social media
websites on
your
smartphone?
24.413 149 .000 1.600 1.47 1.73
As per the literature review author has got insights about that most of the customer uses
social media websites on their smart phones. This social networks are very important part of their
life style. As per the findings of the literature most of the fashion organizations also select social
media marketing for attracting customers. So, for determining the use of social media networks
ion smart phones author has developed the above hypothesis and used t-test for getting
appropriate results. As per the above calculation calculated value of t-test is 24.413. For
conducting this test author has assumed the 5% level of significance and degree of freedom is
149. So, critical value of 5% level significance and 149 degree of freedom is 1.9760. It has
reflected that calculated value of t-test is higher as compare to tabulated value so, as per this test
researcher needs to accept the alternative hypothesis and reject null hypothesis. Overall t-test has
concluded that customers of fashion industry uses the social media websites on their smart
phone.
Total time you
spent on the
Internet via
smart phone
Frequency Percent Valid Percent Cumulative
Percent
Valid 10 -20 hour 15 10.0 10.0 10.0
21-41 hour 100 66.7 66.7 76.7
⊘ This is a preview!⊘
Do you want full access?
Subscribe today to unlock all pages.
Trusted by 1+ million students worldwide
1 out of 33
Related Documents


Your All-in-One AI-Powered Toolkit for Academic Success.
+13062052269
info@desklib.com
Available 24*7 on WhatsApp / Email
![[object Object]](/_next/static/media/star-bottom.7253800d.svg)
Unlock your academic potential
Copyright © 2020–2026 A2Z Services. All Rights Reserved. Developed and managed by ZUCOL.