MIS771: Smartphone Usage Analysis Report - Australian Market Insights

Verified

Added on  2023/01/16

|5
|1695
|60
Report
AI Summary
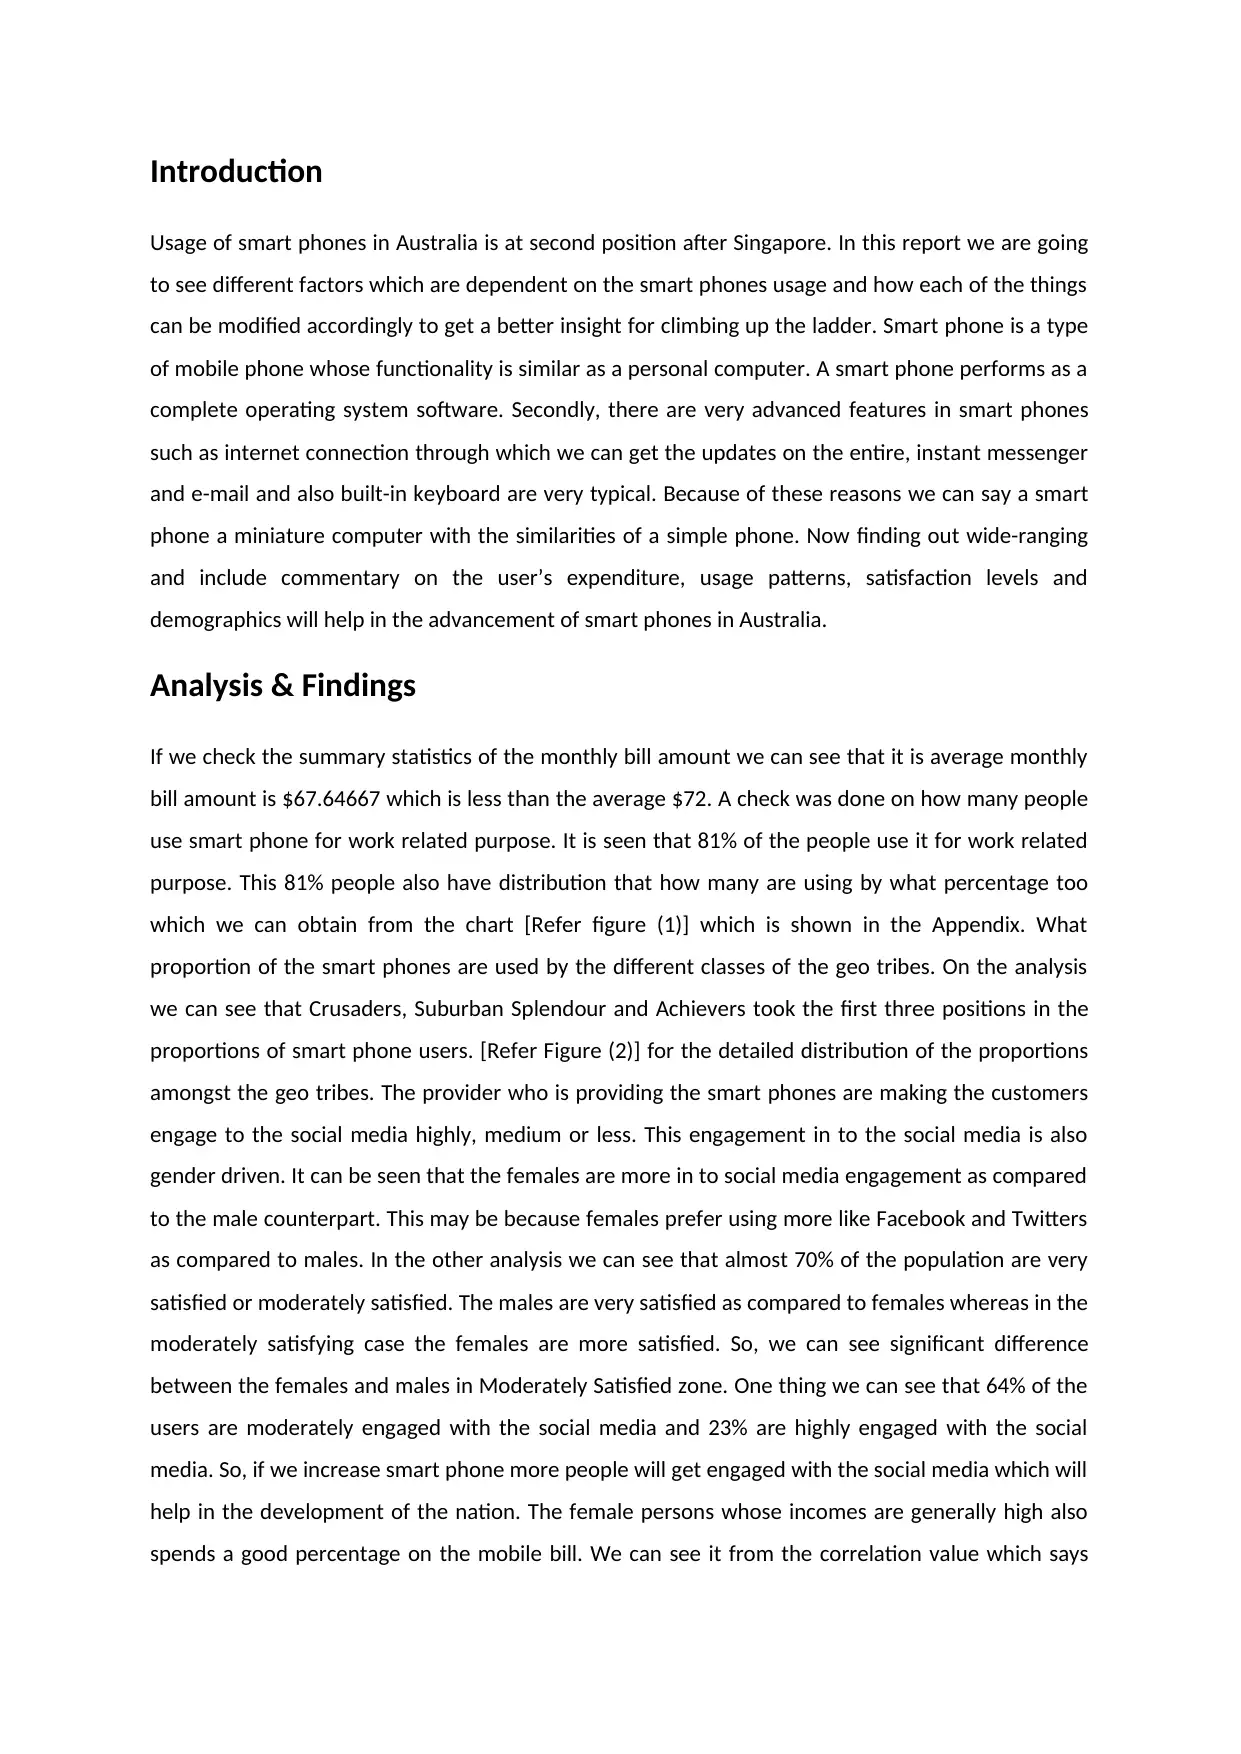
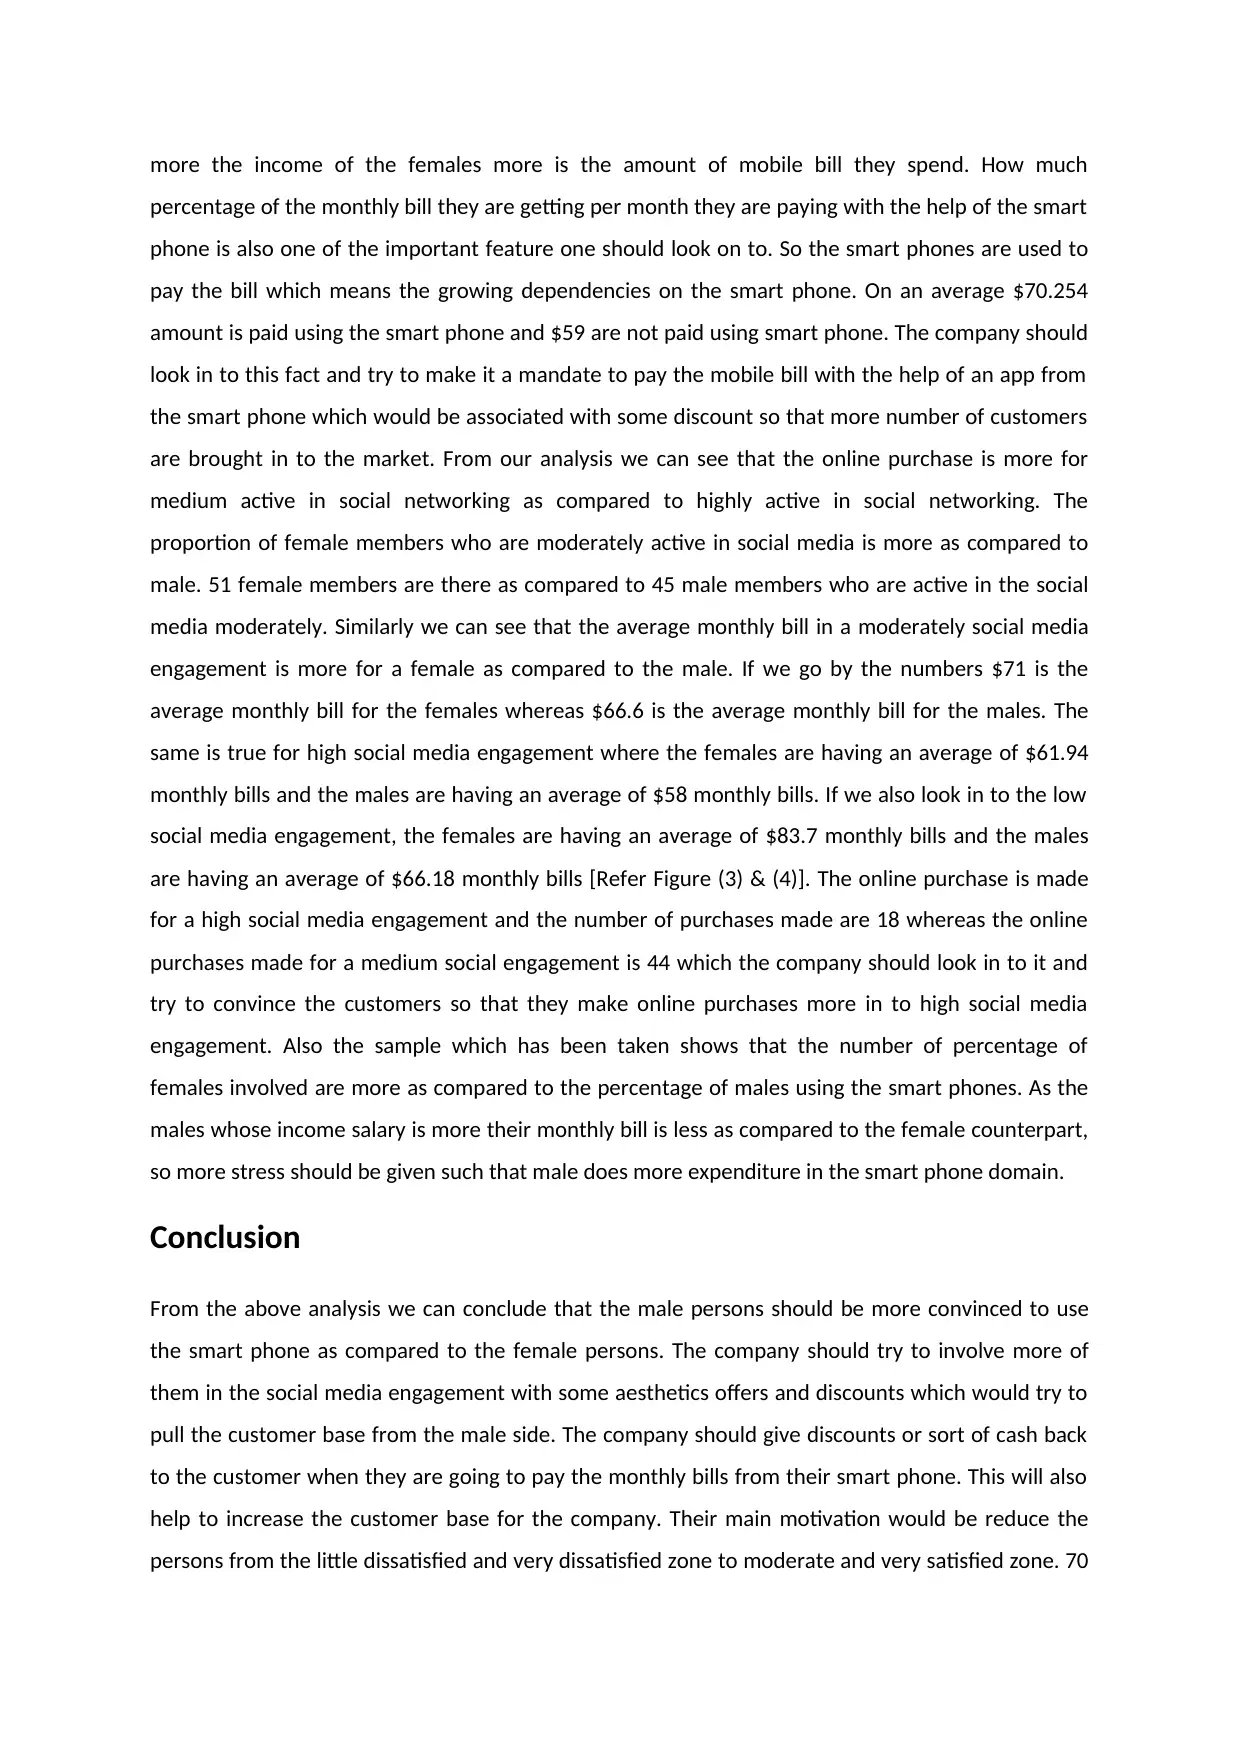
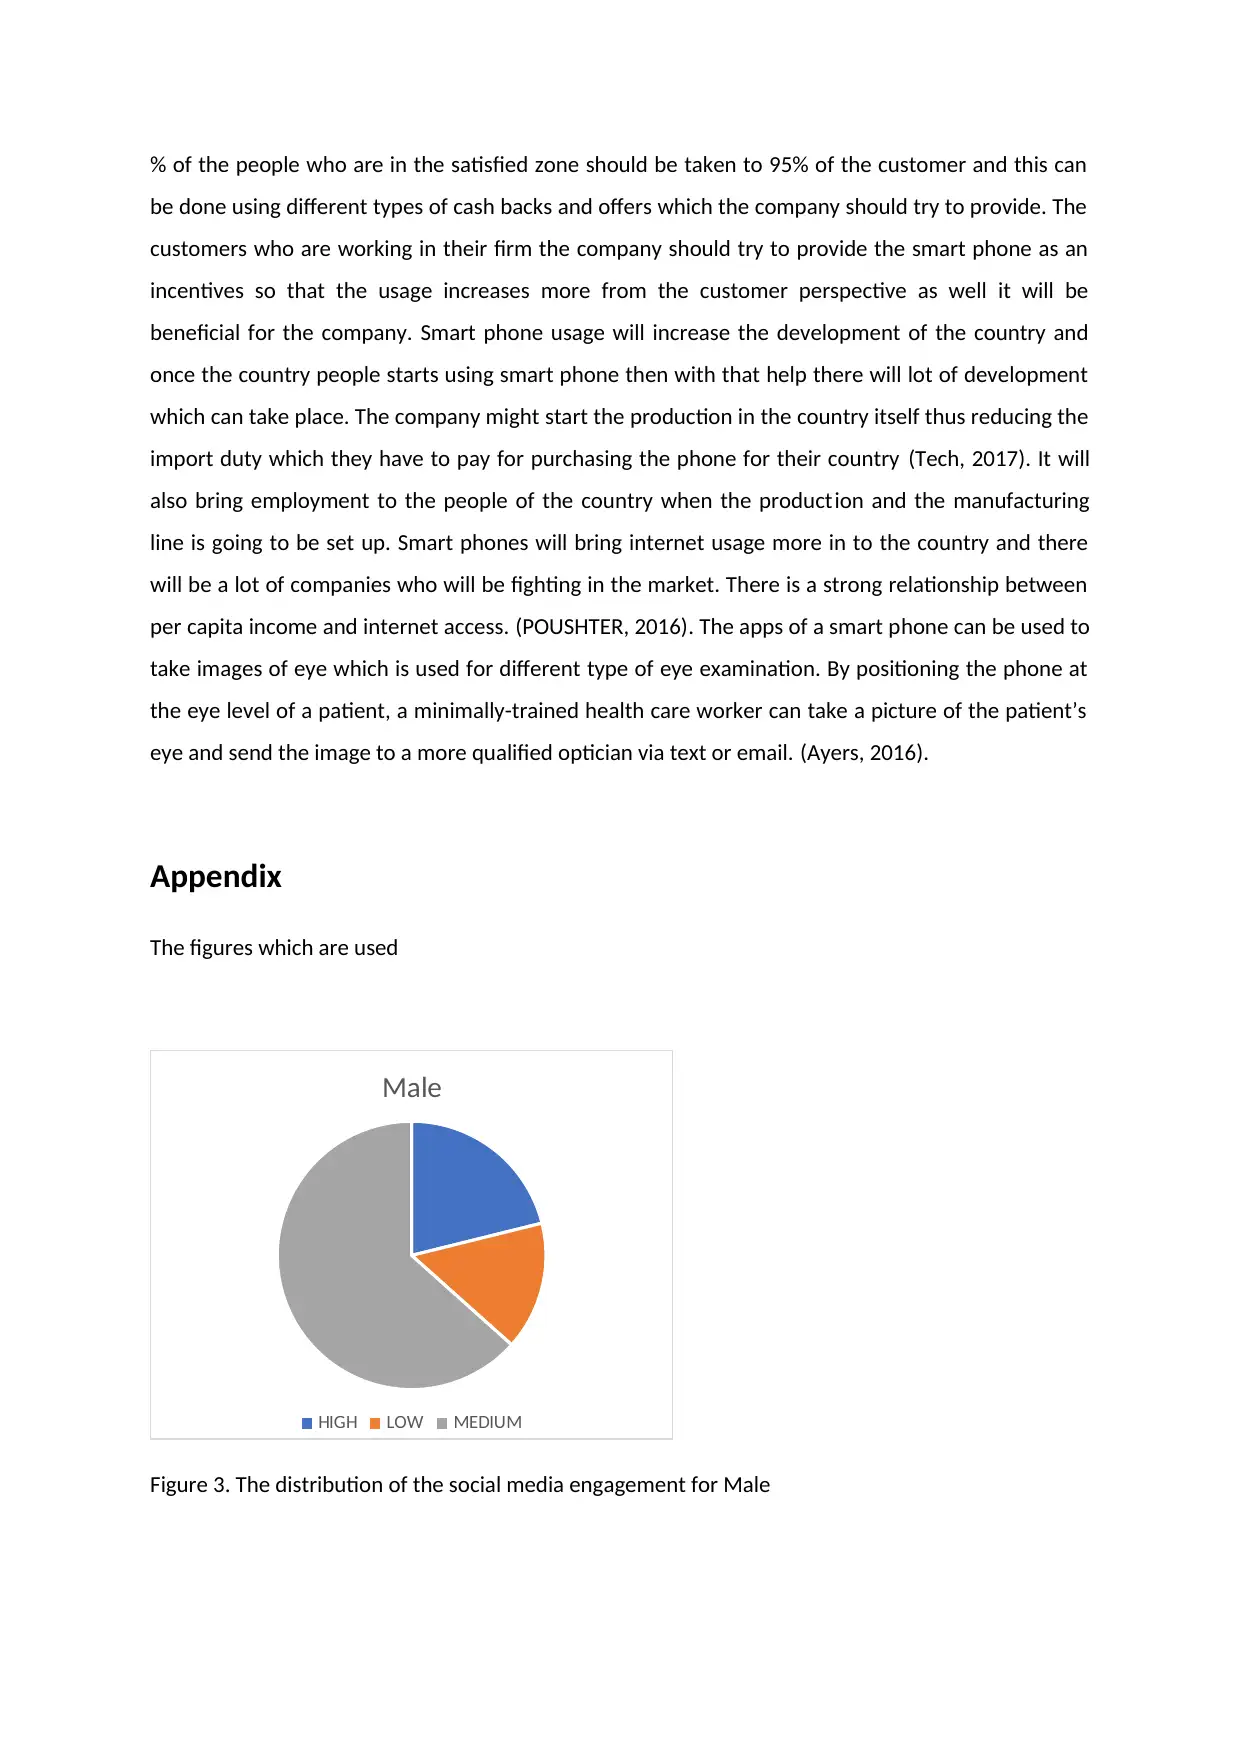
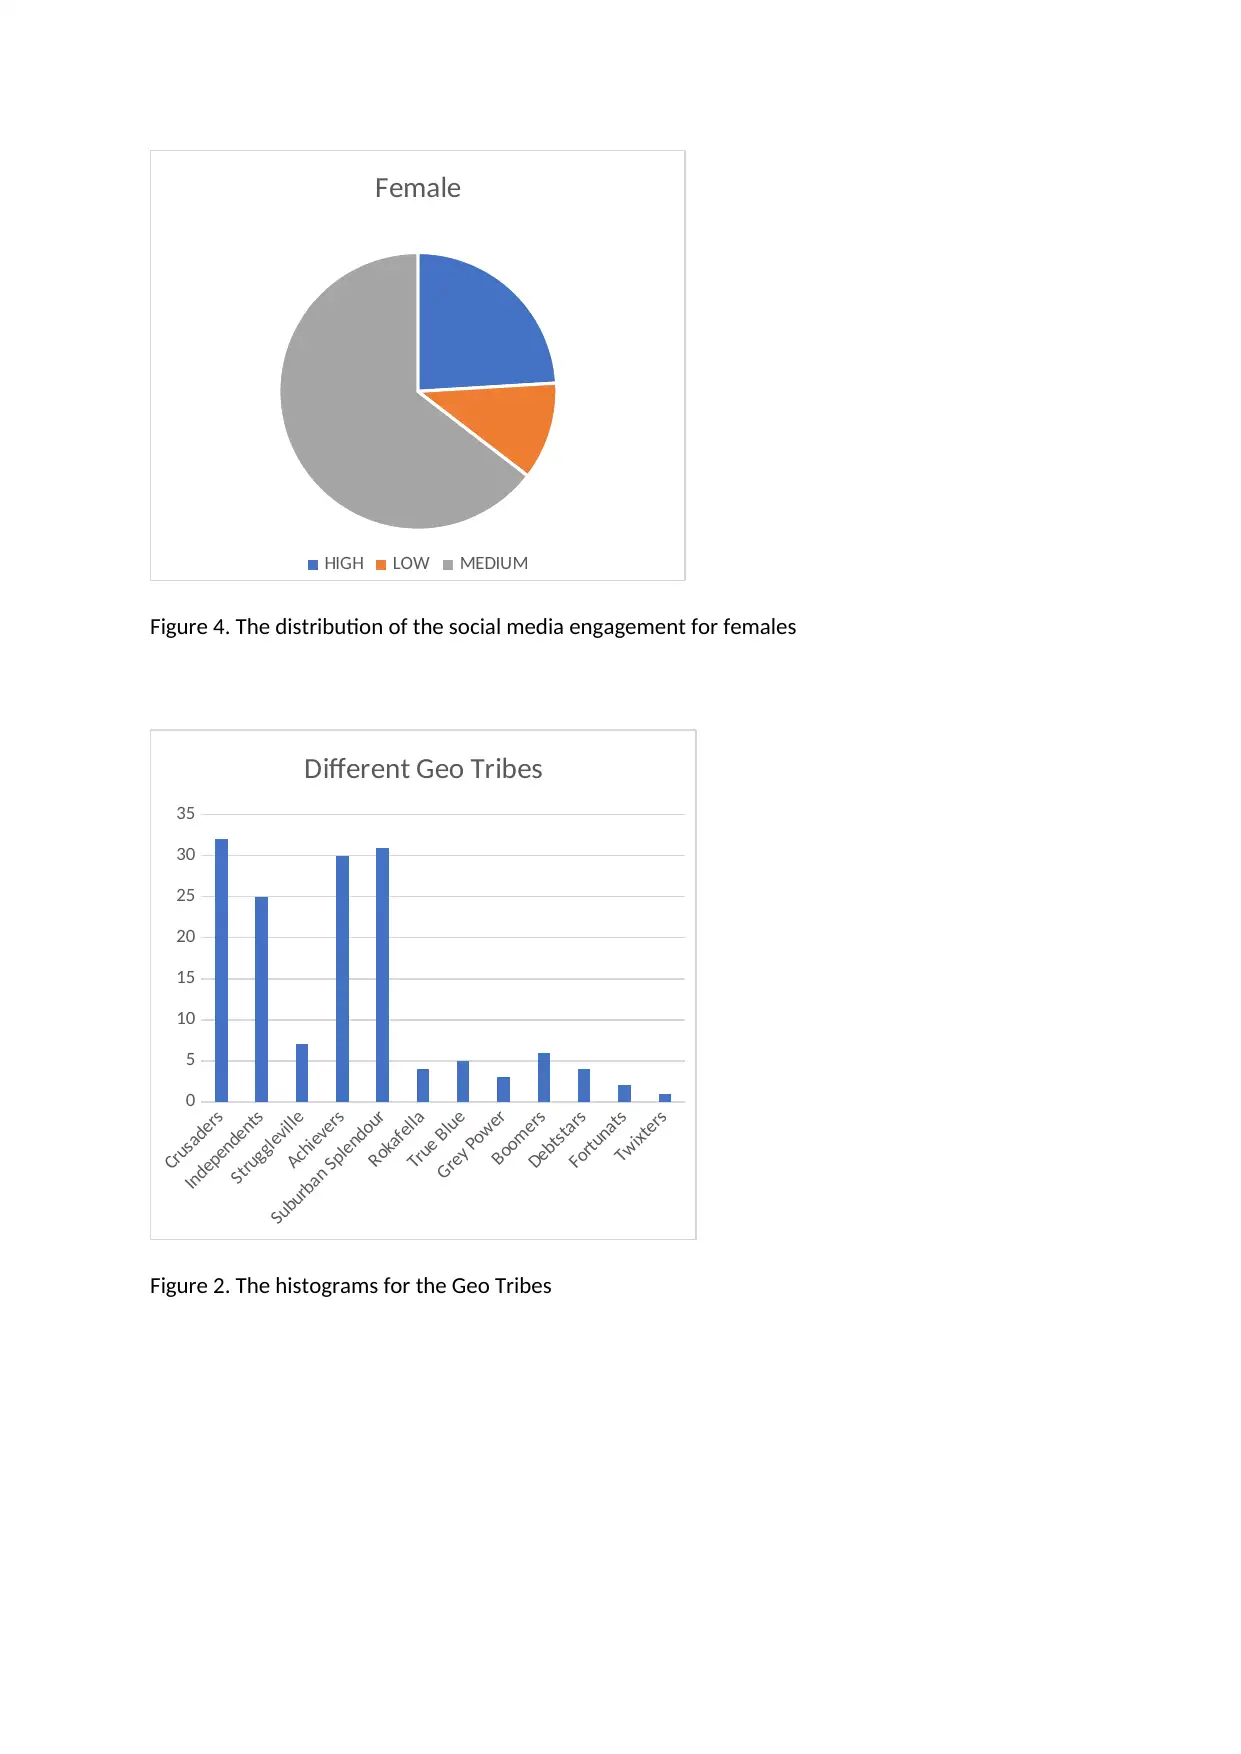
This report analyzes smartphone usage patterns in Australia, examining various factors influencing consumer behavior. The analysis reveals that smartphone usage is high in Australia, with a significant portion of users employing their devices for work-related purposes. The report investigates the correlation between gender, income, and social media engagement, highlighting differences in spending habits and satisfaction levels. Findings indicate that females tend to be more engaged with social media, and income levels correlate with mobile bill expenditures. The report also explores the use of smartphones for online purchases and bill payments, emphasizing the growing dependency on these devices. Key insights include the distribution of smartphone users across different geo tribes and the relationship between social media engagement and online purchasing behavior. The report concludes with recommendations for companies to enhance customer engagement, particularly among male users, and leverage smartphone features to increase revenue and market penetration. The study suggests that increasing smartphone usage can contribute to national development by promoting internet access and facilitating various applications.
Document Page
Introduction
Usage of smart phones in Australia is at second position after Singapore. In this report we are going
to see different factors which are dependent on the smart phones usage and how each of the things
can be modified accordingly to get a better insight for climbing up the ladder. Smart phone is a type
of mobile phone whose functionality is similar as a personal computer. A smart phone performs as a
complete operating system software. Secondly, there are very advanced features in smart phones
such as internet connection through which we can get the updates on the entire, instant messenger
and e-mail and also built-in keyboard are very typical. Because of these reasons we can say a smart
phone a miniature computer with the similarities of a simple phone. Now finding out wide-ranging
and include commentary on the user’s expenditure, usage patterns, satisfaction levels and
demographics will help in the advancement of smart phones in Australia.
Analysis & Findings
If we check the summary statistics of the monthly bill amount we can see that it is average monthly
bill amount is $67.64667 which is less than the average $72. A check was done on how many people
use smart phone for work related purpose. It is seen that 81% of the people use it for work related
purpose. This 81% people also have distribution that how many are using by what percentage too
which we can obtain from the chart [Refer figure (1)] which is shown in the Appendix. What
proportion of the smart phones are used by the different classes of the geo tribes. On the analysis
we can see that Crusaders, Suburban Splendour and Achievers took the first three positions in the
proportions of smart phone users. [Refer Figure (2)] for the detailed distribution of the proportions
amongst the geo tribes. The provider who is providing the smart phones are making the customers
engage to the social media highly, medium or less. This engagement in to the social media is also
gender driven. It can be seen that the females are more in to social media engagement as compared
to the male counterpart. This may be because females prefer using more like Facebook and Twitters
as compared to males. In the other analysis we can see that almost 70% of the population are very
satisfied or moderately satisfied. The males are very satisfied as compared to females whereas in the
moderately satisfying case the females are more satisfied. So, we can see significant difference
between the females and males in Moderately Satisfied zone. One thing we can see that 64% of the
users are moderately engaged with the social media and 23% are highly engaged with the social
media. So, if we increase smart phone more people will get engaged with the social media which will
help in the development of the nation. The female persons whose incomes are generally high also
spends a good percentage on the mobile bill. We can see it from the correlation value which says
tabler-icon-diamond-filled.svg

Secure Best Marks with AI Grader

Need help grading? Try our AI Grader for instant feedback on your assignments.
Document Page
more the income of the females more is the amount of mobile bill they spend. How much
percentage of the monthly bill they are getting per month they are paying with the help of the smart
phone is also one of the important feature one should look on to. So the smart phones are used to
pay the bill which means the growing dependencies on the smart phone. On an average $70.254
amount is paid using the smart phone and $59 are not paid using smart phone. The company should
look in to this fact and try to make it a mandate to pay the mobile bill with the help of an app from
the smart phone which would be associated with some discount so that more number of customers
are brought in to the market. From our analysis we can see that the online purchase is more for
medium active in social networking as compared to highly active in social networking. The
proportion of female members who are moderately active in social media is more as compared to
male. 51 female members are there as compared to 45 male members who are active in the social
media moderately. Similarly we can see that the average monthly bill in a moderately social media
engagement is more for a female as compared to the male. If we go by the numbers $71 is the
average monthly bill for the females whereas $66.6 is the average monthly bill for the males. The
same is true for high social media engagement where the females are having an average of $61.94
monthly bills and the males are having an average of $58 monthly bills. If we also look in to the low
social media engagement, the females are having an average of $83.7 monthly bills and the males
are having an average of $66.18 monthly bills [Refer Figure (3) & (4)]. The online purchase is made
for a high social media engagement and the number of purchases made are 18 whereas the online
purchases made for a medium social engagement is 44 which the company should look in to it and
try to convince the customers so that they make online purchases more in to high social media
engagement. Also the sample which has been taken shows that the number of percentage of
females involved are more as compared to the percentage of males using the smart phones. As the
males whose income salary is more their monthly bill is less as compared to the female counterpart,
so more stress should be given such that male does more expenditure in the smart phone domain.
Conclusion
From the above analysis we can conclude that the male persons should be more convinced to use
the smart phone as compared to the female persons. The company should try to involve more of
them in the social media engagement with some aesthetics offers and discounts which would try to
pull the customer base from the male side. The company should give discounts or sort of cash back
to the customer when they are going to pay the monthly bills from their smart phone. This will also
help to increase the customer base for the company. Their main motivation would be reduce the
persons from the little dissatisfied and very dissatisfied zone to moderate and very satisfied zone. 70
Document Page
% of the people who are in the satisfied zone should be taken to 95% of the customer and this can
be done using different types of cash backs and offers which the company should try to provide. The
customers who are working in their firm the company should try to provide the smart phone as an
incentives so that the usage increases more from the customer perspective as well it will be
beneficial for the company. Smart phone usage will increase the development of the country and
once the country people starts using smart phone then with that help there will lot of development
which can take place. The company might start the production in the country itself thus reducing the
import duty which they have to pay for purchasing the phone for their country (Tech, 2017). It will
also bring employment to the people of the country when the production and the manufacturing
line is going to be set up. Smart phones will bring internet usage more in to the country and there
will be a lot of companies who will be fighting in the market. There is a strong relationship between
per capita income and internet access. (POUSHTER, 2016). The apps of a smart phone can be used to
take images of eye which is used for different type of eye examination. By positioning the phone at
the eye level of a patient, a minimally-trained health care worker can take a picture of the patient’s
eye and send the image to a more qualified optician via text or email. (Ayers, 2016).
Appendix
The figures which are used
Male
HIGH LOW MEDIUM
Figure 3. The distribution of the social media engagement for Male
Document Page
Female
HIGH LOW MEDIUM
Figure 4. The distribution of the social media engagement for females
Crusaders
Independents
Struggleville
Achievers
Suburban Splendour
Rokafella
True Blue
Grey Power
Boomers
Debtstars
Fortunats
Twixters
0
5
10
15
20
25
30
35
Different Geo Tribes
Figure 2. The histograms for the Geo Tribes
tabler-icon-diamond-filled.svg

Secure Best Marks with AI Grader

Need help grading? Try our AI Grader for instant feedback on your assignments.
Document Page
0 5 10 15 20 25 35 40 45 50 60
0
5
10
15
20
25
30
35
Total
Total
Figure 1. The histogram for count of people using smart phones for work
References
Ayers, J., 2016. Smartphone Usage Is On the Rise in Developing Countries. [Online]
Available at: https://www.appmakr.com/blog/smartphone-usage-rise-developing-countries/
[Accessed 05 04 2019].
POUSHTER, J., 2016. Smartphone Ownership and Internet Usage Continues to Climb in Emerging
Economies. [Online]
Available at: https://www.pewglobal.org/2016/02/22/smartphone-ownership-and-internet-usage-
continues-to-climb-in-emerging-economies/
[Accessed 06 04 2019].
Tech, W. L., 2017. Bridging the Gap – Smartphones n Third World Countries. [Online]
Available at: https://womenlovetech.com/bridging-the-gap-smartphones-in-third-world-countries/
[Accessed 06 04 2019].
chevron_up_icon
1 out of 5
circle_padding
hide_on_mobile
zoom_out_icon
[object Object]