Project Management: Smartsheet, Snapshots, Flowcharts, and Analysis

Verified

Added on  2023/06/01

|6
|797
|210
Project
AI Summary
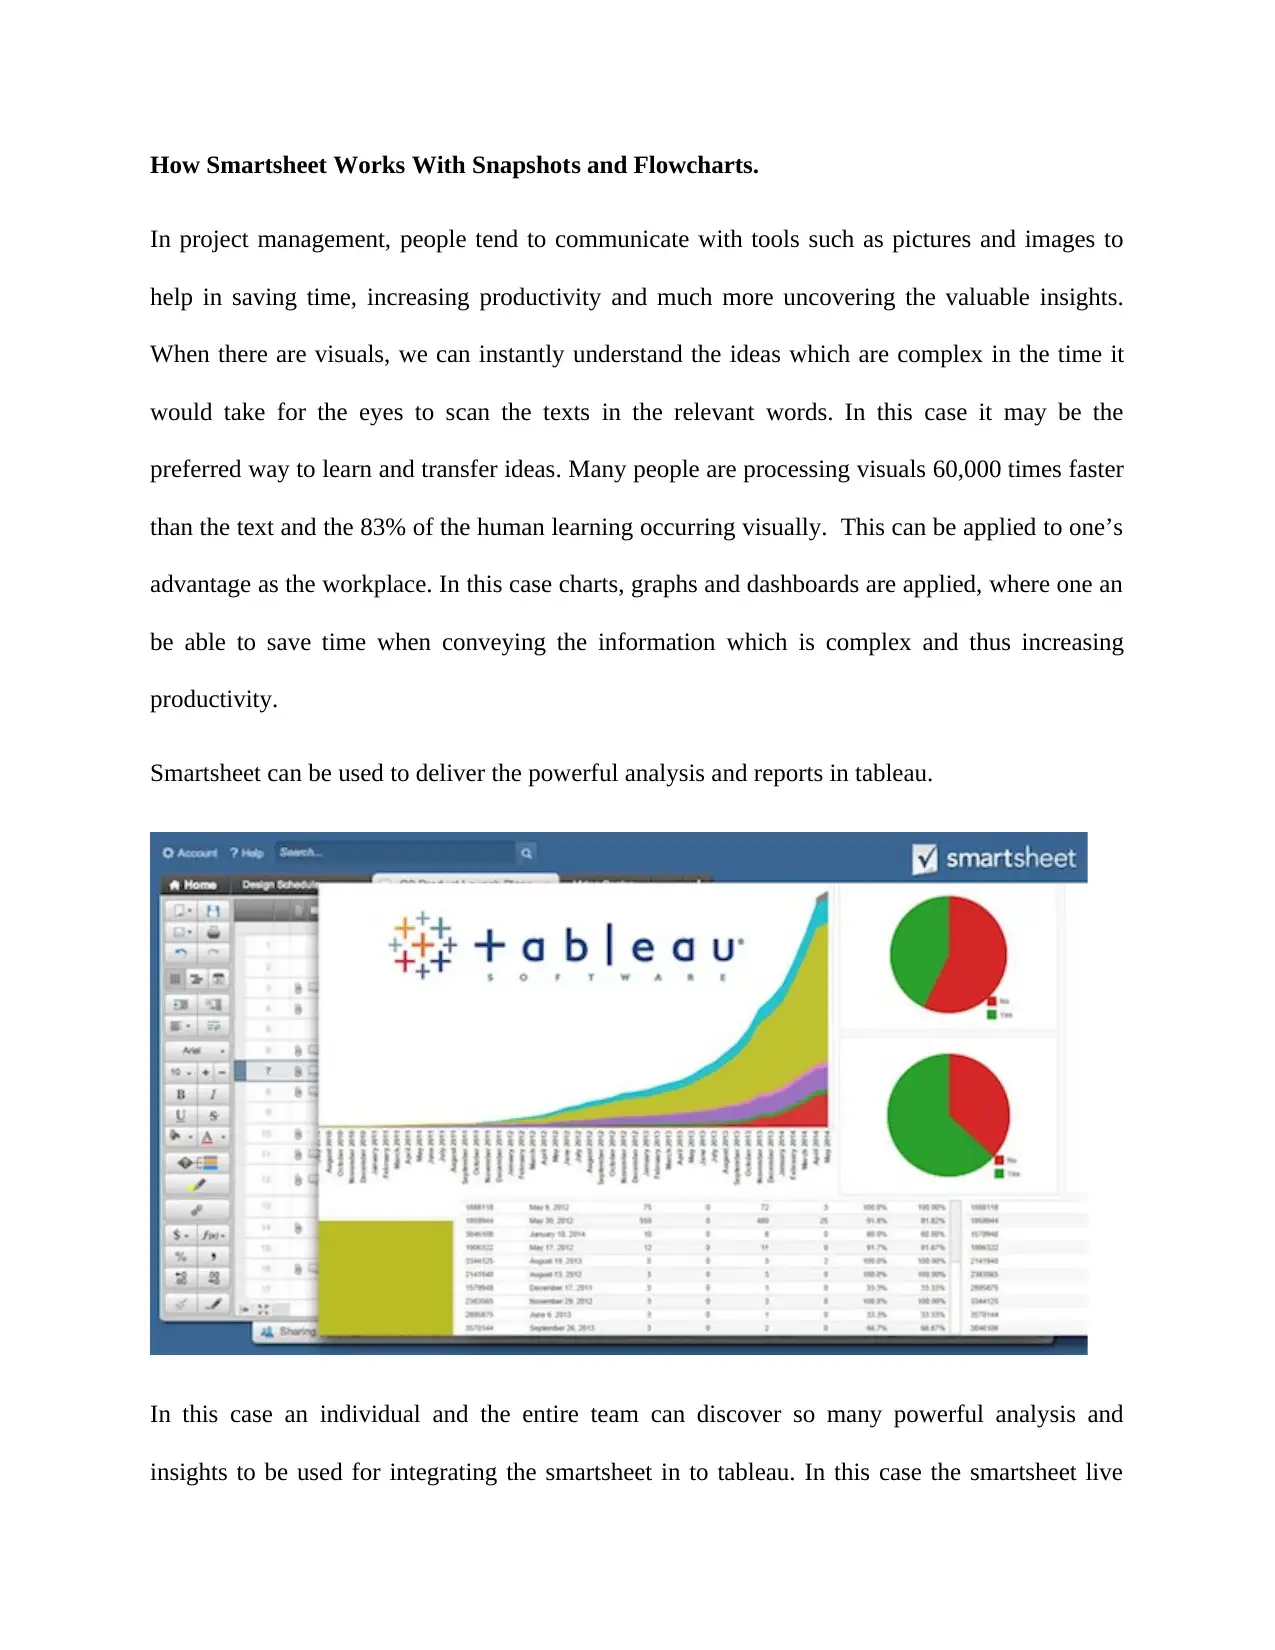
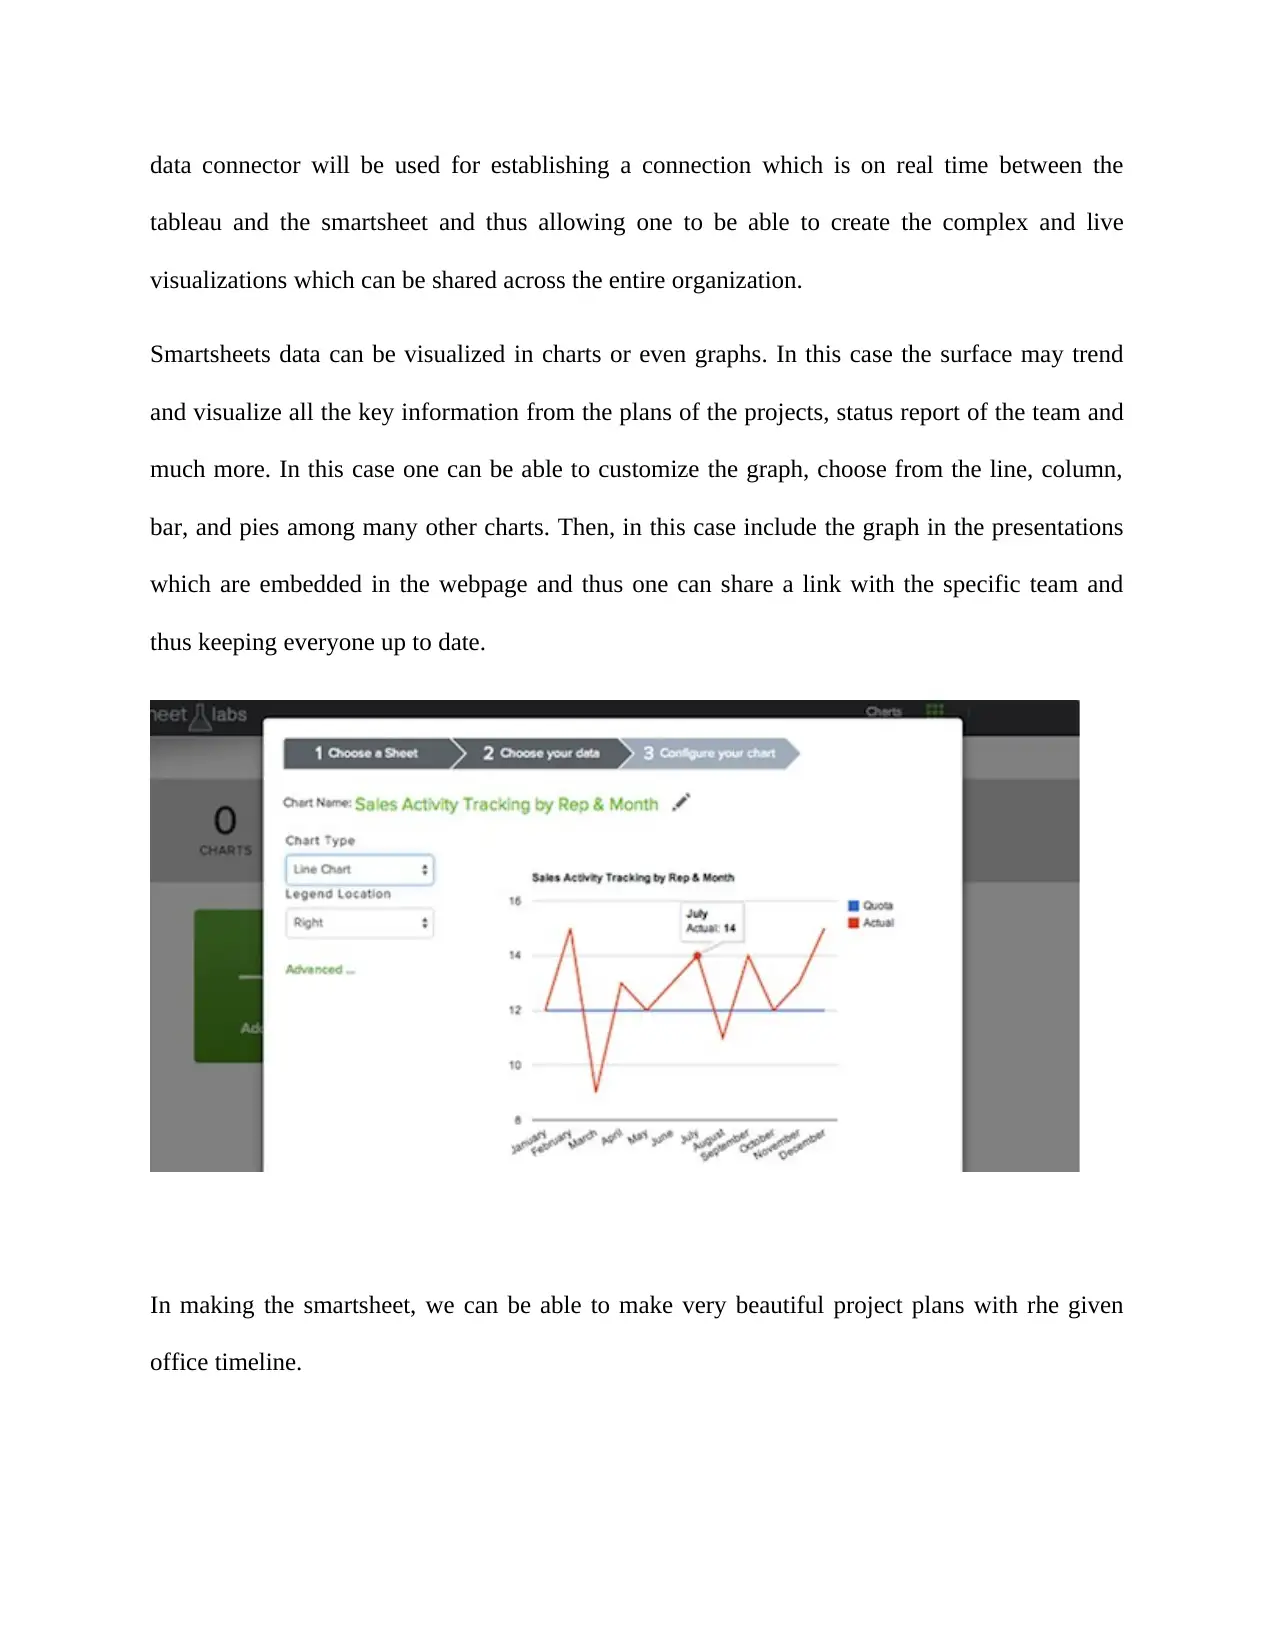
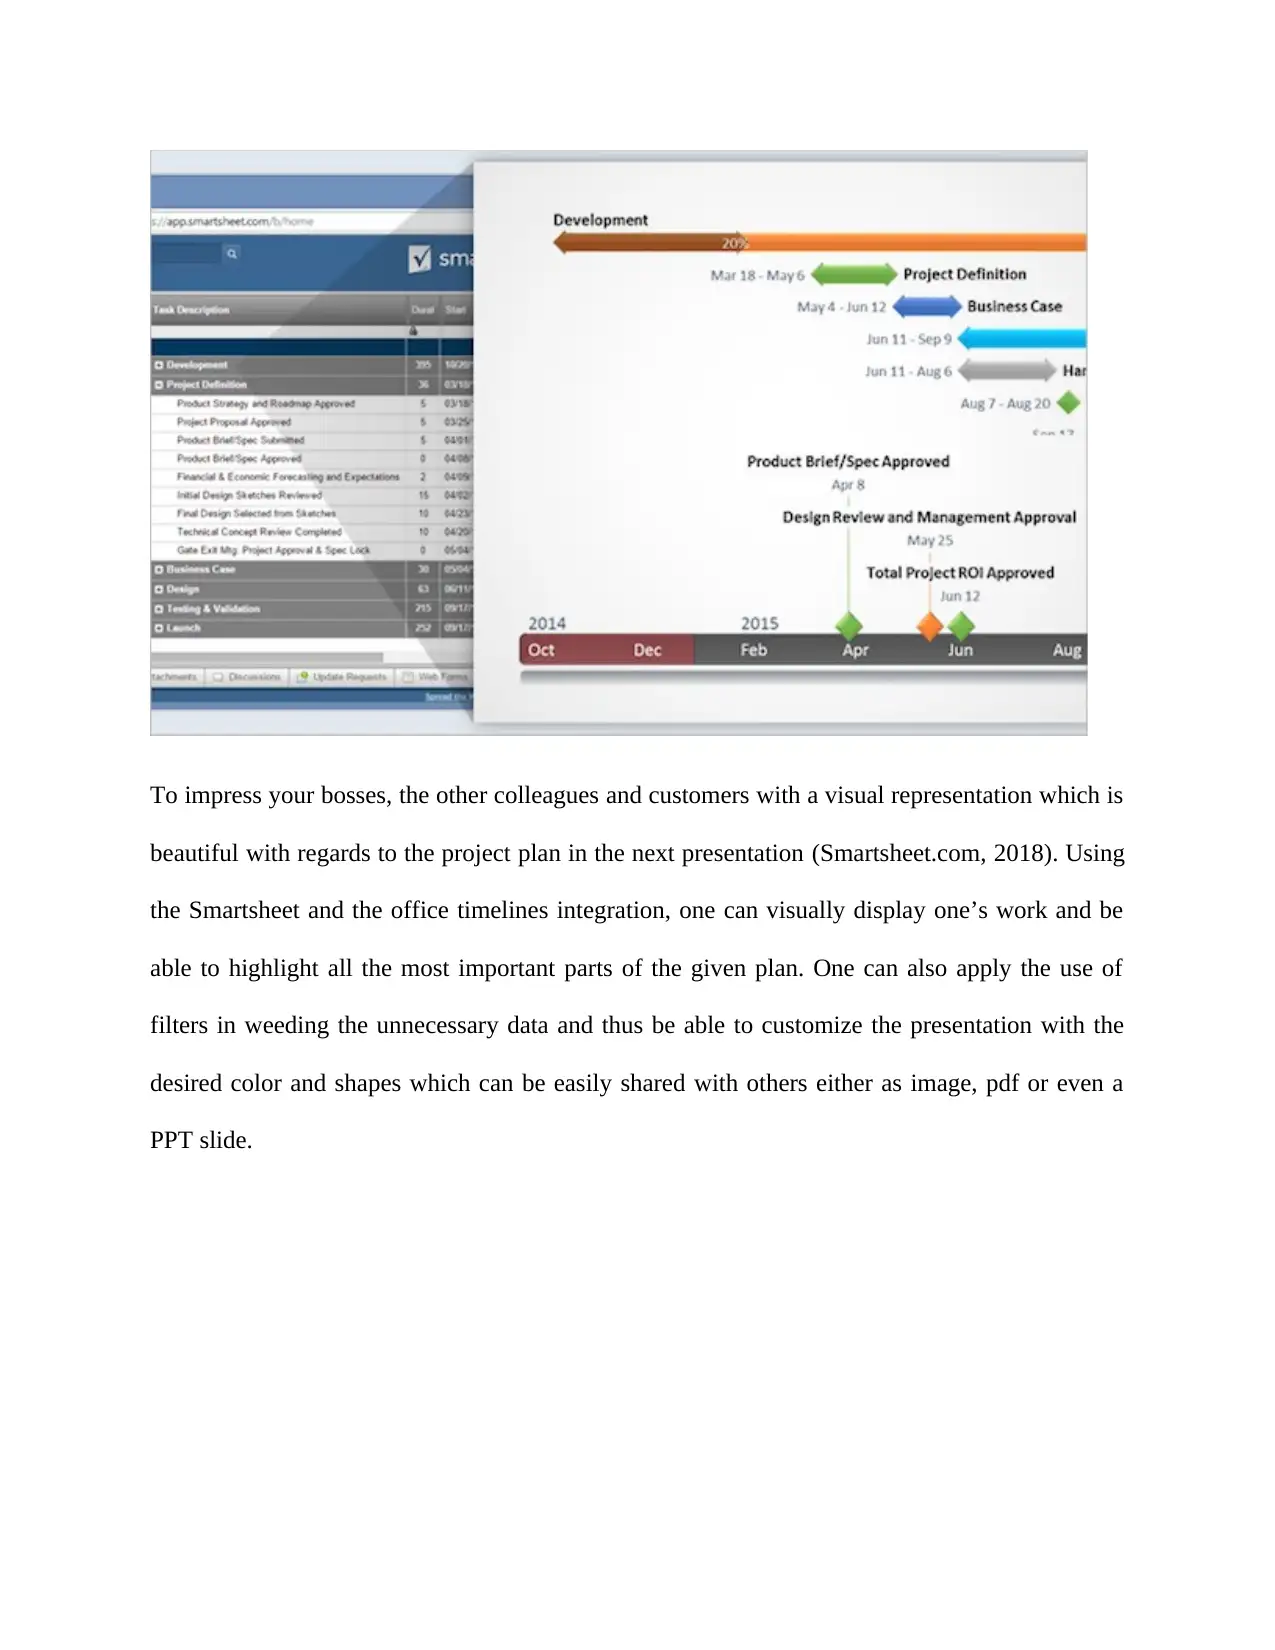
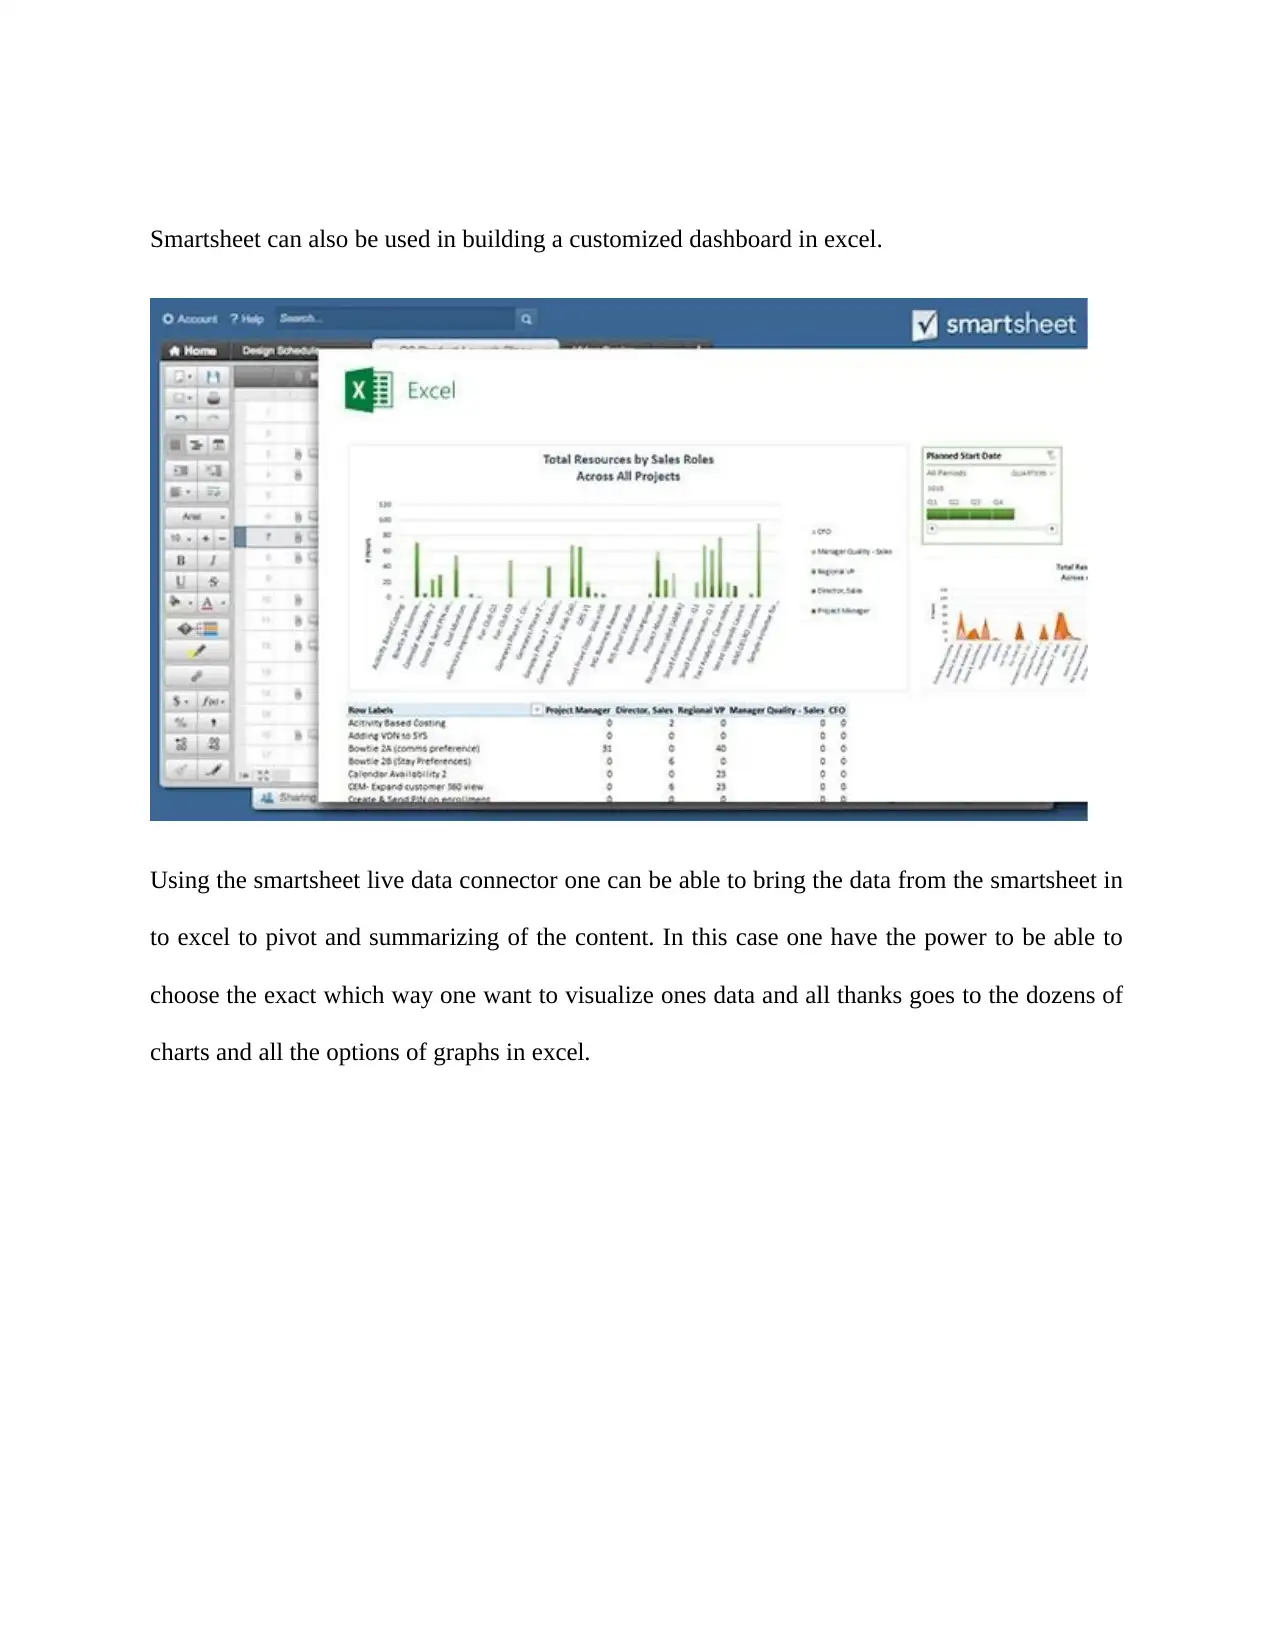
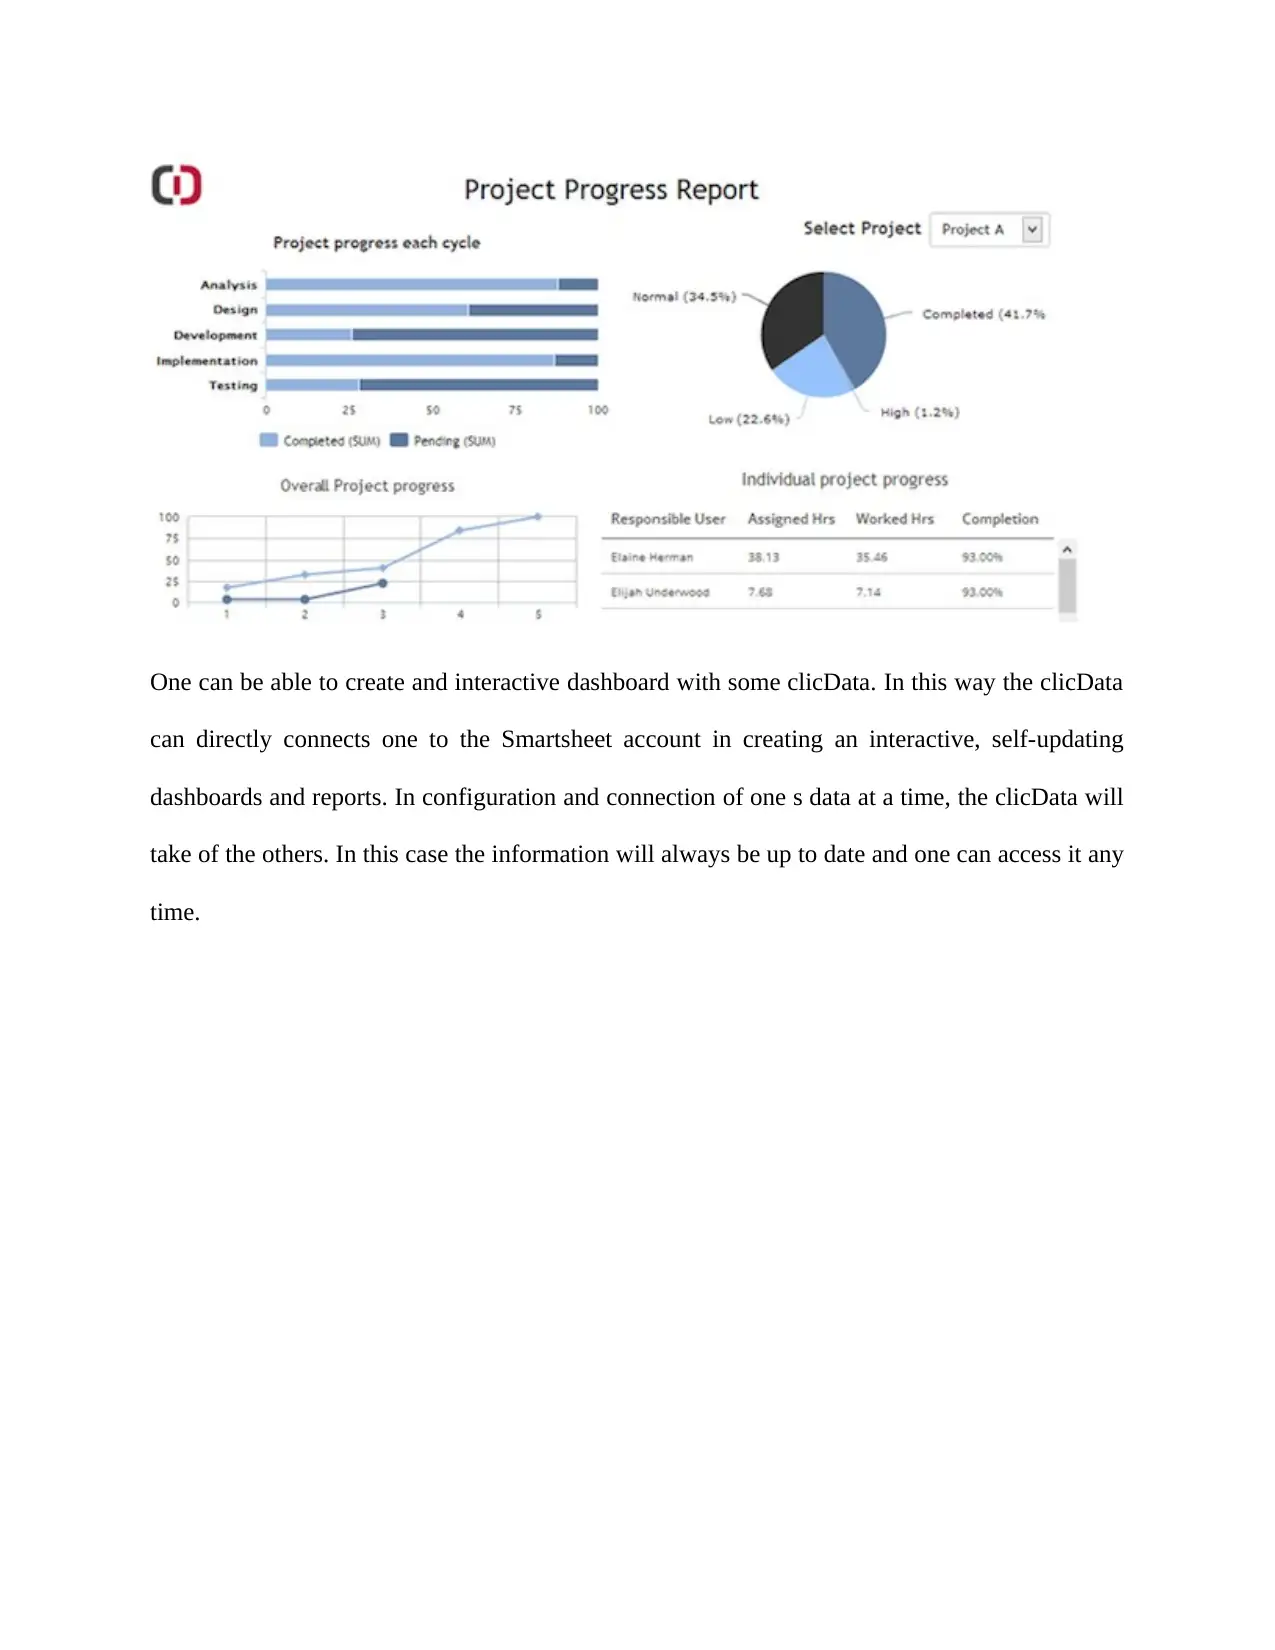
This project delves into Smartsheet, a project management tool, focusing on how it utilizes snapshots and flowcharts to enhance project planning and data visualization. The assignment covers the tool's key criteria, functionalities, and integration with other tools like Tableau and Excel, emphasizing the use of charts, graphs, and dashboards for effective communication and analysis. It explores how Smartsheet facilitates creating project plans with Office Timeline, building customized dashboards, and integrating with clicData. The project highlights the advantages of using Smartsheet, such as increased productivity and improved insights, while also addressing potential disadvantages and suggesting improvements. The project includes references to relevant patents and resources, providing a comprehensive overview of Smartsheet's capabilities in project management.
Document Page
How Smartsheet Works With Snapshots and Flowcharts.
In project management, people tend to communicate with tools such as pictures and images to
help in saving time, increasing productivity and much more uncovering the valuable insights.
When there are visuals, we can instantly understand the ideas which are complex in the time it
would take for the eyes to scan the texts in the relevant words. In this case it may be the
preferred way to learn and transfer ideas. Many people are processing visuals 60,000 times faster
than the text and the 83% of the human learning occurring visually. This can be applied to one’s
advantage as the workplace. In this case charts, graphs and dashboards are applied, where one an
be able to save time when conveying the information which is complex and thus increasing
productivity.
Smartsheet can be used to deliver the powerful analysis and reports in tableau.
In this case an individual and the entire team can discover so many powerful analysis and
insights to be used for integrating the smartsheet in to tableau. In this case the smartsheet live
tabler-icon-diamond-filled.svg

Secure Best Marks with AI Grader

Need help grading? Try our AI Grader for instant feedback on your assignments.
Document Page
data connector will be used for establishing a connection which is on real time between the
tableau and the smartsheet and thus allowing one to be able to create the complex and live
visualizations which can be shared across the entire organization.
Smartsheets data can be visualized in charts or even graphs. In this case the surface may trend
and visualize all the key information from the plans of the projects, status report of the team and
much more. In this case one can be able to customize the graph, choose from the line, column,
bar, and pies among many other charts. Then, in this case include the graph in the presentations
which are embedded in the webpage and thus one can share a link with the specific team and
thus keeping everyone up to date.
In making the smartsheet, we can be able to make very beautiful project plans with rhe given
office timeline.
Document Page
To impress your bosses, the other colleagues and customers with a visual representation which is
beautiful with regards to the project plan in the next presentation (Smartsheet.com, 2018). Using
the Smartsheet and the office timelines integration, one can visually display one’s work and be
able to highlight all the most important parts of the given plan. One can also apply the use of
filters in weeding the unnecessary data and thus be able to customize the presentation with the
desired color and shapes which can be easily shared with others either as image, pdf or even a
PPT slide.
Document Page
Smartsheet can also be used in building a customized dashboard in excel.
Using the smartsheet live data connector one can be able to bring the data from the smartsheet in
to excel to pivot and summarizing of the content. In this case one have the power to be able to
choose the exact which way one want to visualize ones data and all thanks goes to the dozens of
charts and all the options of graphs in excel.
tabler-icon-diamond-filled.svg

Secure Best Marks with AI Grader

Need help grading? Try our AI Grader for instant feedback on your assignments.
Document Page
One can be able to create and interactive dashboard with some clicData. In this way the clicData
can directly connects one to the Smartsheet account in creating an interactive, self-updating
dashboards and reports. In configuration and connection of one s data at a time, the clicData will
take of the others. In this case the information will always be up to date and one can access it any
time.
Document Page
List of References
Smartsheet.com. (2018, October 12). PERT 101: Charts, Analysis, and Templates For
More Accurate Project Time Estimates. Retrieved from SmartSheet:
https://www.smartsheet.com/pert-101-charts-analysis-and-templates-more-accurate-
project-time-estimates
Freih, B., Jacobsons, T., Arunkundraman, R., Ruckers, E., & Maliskah Jr, T. P.
(2018). U.S. Patent No. 9109228,241. Washingtons, DC: U.S. Patents and Trademark
Offices.
Freih, B., Jacobsons, T., Arunkundraman, R., Ruckers, E., & Maliskah Jr, T. P.
(2018). U.S. Patent No. 9109228,241. Washingtons, DC: U.S. Patents and Trademark
Offices
Steineh, D., Brownes, W. E., Freih, B., Vorobievs, A., Skeemin, K. D., Ruckert, E., ... &
Jacobs, T. (2016). U.S. Patent Application No. 15/242,279.
.
chevron_up_icon
1 out of 6
circle_padding
hide_on_mobile
zoom_out_icon
logo.png

Your All-in-One AI-Powered Toolkit for Academic Success.

Available 24*7 on WhatsApp / Email

[object Object]