Smith Group Plc Financial Analysis: Profitability and Liquidity Ratios
VerifiedAdded on 2022/01/07
|15
|3796
|33
Report
AI Summary
This report provides a comprehensive financial analysis of Smith Group Plc, a multinational enterprise with diverse business segments. The analysis includes a detailed examination of the company's financial performance over two years, focusing on key metrics such as revenue, operating profit, and net profit. The report employs various financial ratios, including profitability, liquidity, capital structure, and asset efficiency ratios, to assess Smith Group Plc's performance relative to its competitor, Emerson Electric Co. Furthermore, the report delves into project appraisal, specifically evaluating the potential investment in new catheter manufacturing equipment using Net Present Value (NPV), Internal Rate of Return (IRR), and Discounted Payback Period methods, considering factors such as sunk costs, depreciation, and working capital. The report concludes with a discussion of the limitations of ratio analysis and the overall financial health of Smith Group Plc.

TABLE OF CONTENT
Contents
TABLE OF CONTENT.........................................................................................................................1
1. Introduction...................................................................................................................................2
2. Financial Analysis.........................................................................................................................2
2.1 Profitability Ratio.......................................................................................................................2
2.2 Liquidity Ratio............................................................................................................................3
2.3 Capital Structure Ratio...............................................................................................................4
2.4 Asset Efficiency Ratio.................................................................................................................5
2.5 Drawback of Ratio......................................................................................................................5
3. Project Appraisal...........................................................................................................................6
3.1 Part A.........................................................................................................................................6
3.2 Part B.........................................................................................................................................6
3.3 Part C.........................................................................................................................................7
4. Company Valuation.......................................................................................................................7
4.1 Part A.........................................................................................................................................7
4.2 PART B.....................................................................................................................................8
4.3 Project Appraisal........................................................................................................................8
Net Present Value..............................................................................................................................9
4.4 Other technique........................................................................................................................9
5. Conclusion.....................................................................................................................................9
References:..........................................................................................................................................10
Paraphrase This Document
Need a fresh take? Get an instant paraphrase of this document with our AI Paraphraser
1. Introduction
Smith Group Plc is a Multinational Enterprise with its headquarter in London, United
Kingdom. The company has a diversified business and has operations in more than 50
countries. The employee strength of the company is 23,550 with a net revenue of Sterling
3,280 Million in 2017. The company excels in five divisions namely John Crane, Smiths
Medical. Smiths Detection, Smiths interconnect and Flex-Tek. Further, Smiths detection is
the world’s largest manufacturer of detection of explosives, weapons, chemicals etc.
The company is listed on London Stock Exchange and is a part of FTSE 100 index.
Financial Performance of the company Vis-à-vis Employee Benefit Expense cum
Employee Pension Fund
The Financial performance of Smith Group Plc for past 2 years has been presented here-in-
below for analysing the growth in profit and revenue of company:
Sl. No Particular 2017 2016
1 Revenues 3280 2949
2 Operating Profit 674 387
3 % of Revenue 20.55% 13.12%
4 Net Profit 564 261
5 % of Revenue 17.20% 8.85%
6 Basic EPS 144.1 65.6
7 Dividend Paid 167 167
2. Financial Analysis
The financial analysis of Smiths Group Plc with that of its competitor Emerson Electric Co.
has been carried out based on following parameters:
(a)Profitability Ratio
(b)Liquidity Ratio;
(c)Capital Structure Ratio;
(d)Asset Efficiency Ratio
Data used is for 2017
2.1 Profitability Ratio
The following two ratios have been computed for the purpose of analyzing the profitability:
(a) Net Profit margin: The ratio has been computed on the basis of considering the net
profit earned by the company divided by sales. Thus, it shows the portion of sales that
is left after meeting expense and tax liability of the company. The formula has been
presented here-in-below:
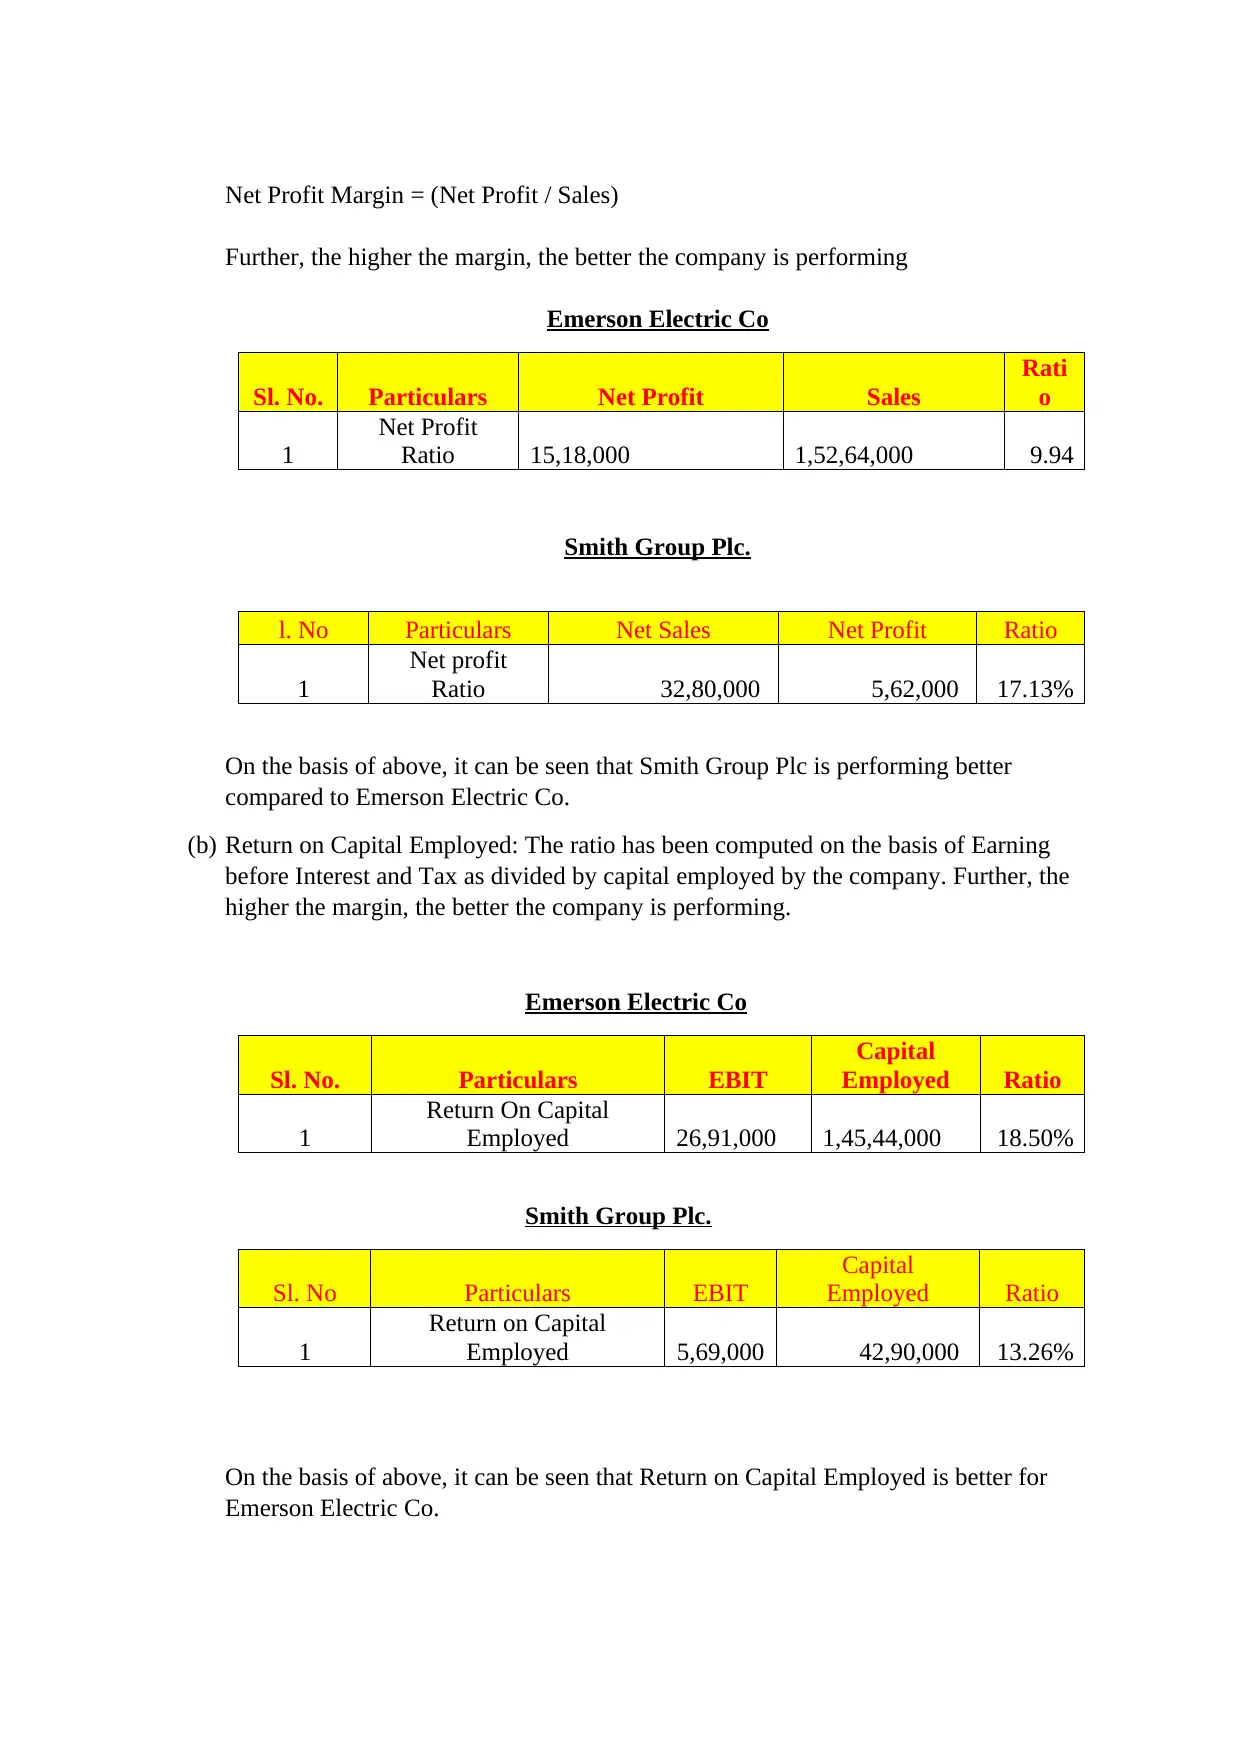
Net Profit Margin = (Net Profit / Sales)
Further, the higher the margin, the better the company is performing
Emerson Electric Co
Sl. No. Particulars Net Profit Sales
Rati
o
1
Net Profit
Ratio 15,18,000 1,52,64,000 9.94
Smith Group Plc.
l. No Particulars Net Sales Net Profit Ratio
1
Net profit
Ratio 32,80,000 5,62,000 17.13%
On the basis of above, it can be seen that Smith Group Plc is performing better
compared to Emerson Electric Co.
(b) Return on Capital Employed: The ratio has been computed on the basis of Earning
before Interest and Tax as divided by capital employed by the company. Further, the
higher the margin, the better the company is performing.
Emerson Electric Co
Sl. No. Particulars EBIT
Capital
Employed Ratio
1
Return On Capital
Employed 26,91,000 1,45,44,000 18.50%
Smith Group Plc.
Sl. No Particulars EBIT
Capital
Employed Ratio
1
Return on Capital
Employed 5,69,000 42,90,000 13.26%
On the basis of above, it can be seen that Return on Capital Employed is better for
Emerson Electric Co.
⊘ This is a preview!⊘
Do you want full access?
Subscribe today to unlock all pages.
Trusted by 1+ million students worldwide
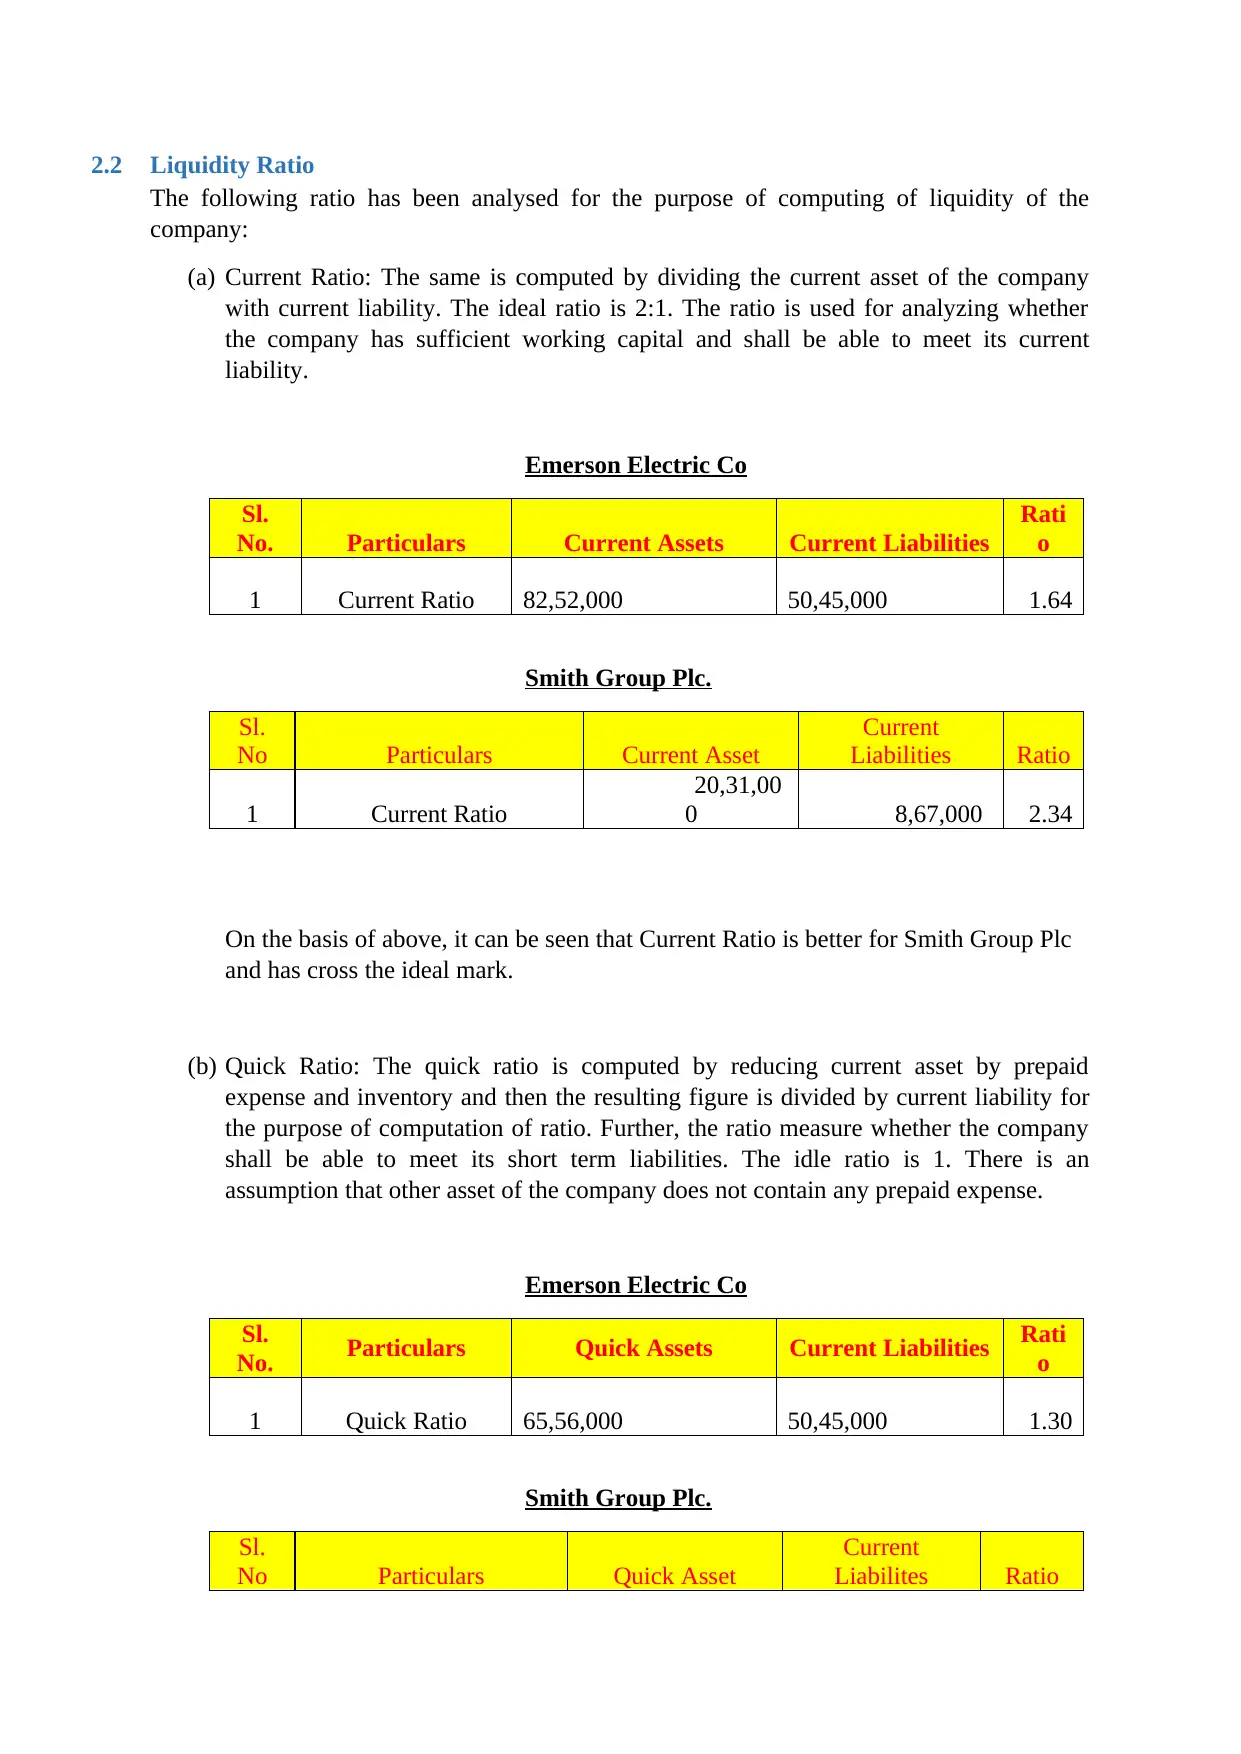
2.2 Liquidity Ratio
The following ratio has been analysed for the purpose of computing of liquidity of the
company:
(a) Current Ratio: The same is computed by dividing the current asset of the company
with current liability. The ideal ratio is 2:1. The ratio is used for analyzing whether
the company has sufficient working capital and shall be able to meet its current
liability.
Emerson Electric Co
Sl.
No. Particulars Current Assets Current Liabilities
Rati
o
1 Current Ratio 82,52,000 50,45,000 1.64
Smith Group Plc.
Sl.
No Particulars Current Asset
Current
Liabilities Ratio
1 Current Ratio
20,31,00
0 8,67,000 2.34
On the basis of above, it can be seen that Current Ratio is better for Smith Group Plc
and has cross the ideal mark.
(b) Quick Ratio: The quick ratio is computed by reducing current asset by prepaid
expense and inventory and then the resulting figure is divided by current liability for
the purpose of computation of ratio. Further, the ratio measure whether the company
shall be able to meet its short term liabilities. The idle ratio is 1. There is an
assumption that other asset of the company does not contain any prepaid expense.
Emerson Electric Co
Sl.
No. Particulars Quick Assets Current Liabilities Rati
o
1 Quick Ratio 65,56,000 50,45,000 1.30
Smith Group Plc.
Sl.
No Particulars Quick Asset
Current
Liabilites Ratio
Paraphrase This Document
Need a fresh take? Get an instant paraphrase of this document with our AI Paraphraser
1 Quick Asset Ratio
15,79,00
0 8,67,000 1.82
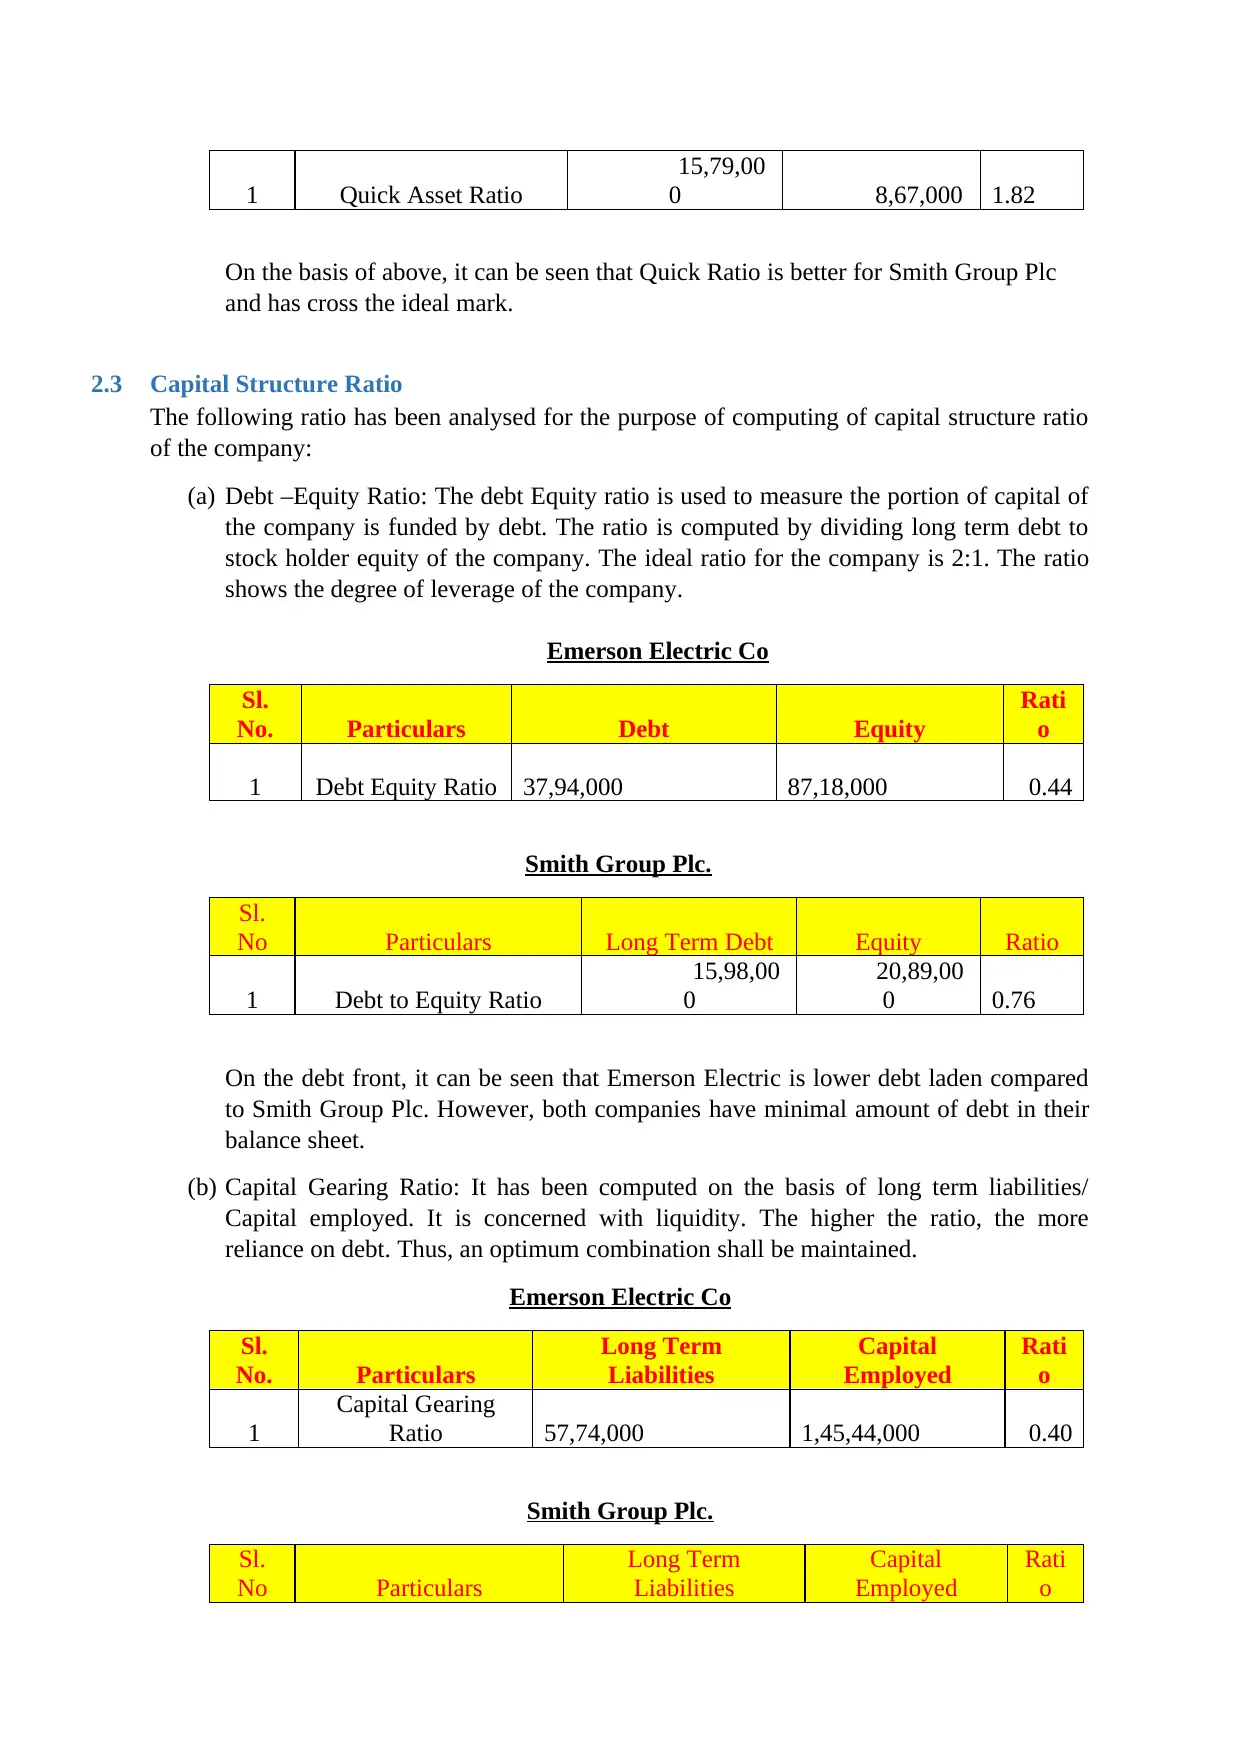
On the basis of above, it can be seen that Quick Ratio is better for Smith Group Plc
and has cross the ideal mark.
2.3 Capital Structure Ratio
The following ratio has been analysed for the purpose of computing of capital structure ratio
of the company:
(a) Debt –Equity Ratio: The debt Equity ratio is used to measure the portion of capital of
the company is funded by debt. The ratio is computed by dividing long term debt to
stock holder equity of the company. The ideal ratio for the company is 2:1. The ratio
shows the degree of leverage of the company.
Emerson Electric Co
Sl.
No. Particulars Debt Equity
Rati
o
1 Debt Equity Ratio 37,94,000 87,18,000 0.44
Smith Group Plc.
Sl.
No Particulars Long Term Debt Equity Ratio
1 Debt to Equity Ratio
15,98,00
0
20,89,00
0 0.76
On the debt front, it can be seen that Emerson Electric is lower debt laden compared
to Smith Group Plc. However, both companies have minimal amount of debt in their
balance sheet.
(b) Capital Gearing Ratio: It has been computed on the basis of long term liabilities/
Capital employed. It is concerned with liquidity. The higher the ratio, the more
reliance on debt. Thus, an optimum combination shall be maintained.
Emerson Electric Co
Sl.
No. Particulars
Long Term
Liabilities
Capital
Employed
Rati
o
1
Capital Gearing
Ratio 57,74,000 1,45,44,000 0.40
Smith Group Plc.
Sl.
No Particulars
Long Term
Liabilities
Capital
Employed
Rati
o
15,79,00
0 8,67,000 1.82
On the basis of above, it can be seen that Quick Ratio is better for Smith Group Plc
and has cross the ideal mark.
2.3 Capital Structure Ratio
The following ratio has been analysed for the purpose of computing of capital structure ratio
of the company:
(a) Debt –Equity Ratio: The debt Equity ratio is used to measure the portion of capital of
the company is funded by debt. The ratio is computed by dividing long term debt to
stock holder equity of the company. The ideal ratio for the company is 2:1. The ratio
shows the degree of leverage of the company.
Emerson Electric Co
Sl.
No. Particulars Debt Equity
Rati
o
1 Debt Equity Ratio 37,94,000 87,18,000 0.44
Smith Group Plc.
Sl.
No Particulars Long Term Debt Equity Ratio
1 Debt to Equity Ratio
15,98,00
0
20,89,00
0 0.76
On the debt front, it can be seen that Emerson Electric is lower debt laden compared
to Smith Group Plc. However, both companies have minimal amount of debt in their
balance sheet.
(b) Capital Gearing Ratio: It has been computed on the basis of long term liabilities/
Capital employed. It is concerned with liquidity. The higher the ratio, the more
reliance on debt. Thus, an optimum combination shall be maintained.
Emerson Electric Co
Sl.
No. Particulars
Long Term
Liabilities
Capital
Employed
Rati
o
1
Capital Gearing
Ratio 57,74,000 1,45,44,000 0.40
Smith Group Plc.
Sl.
No Particulars
Long Term
Liabilities
Capital
Employed
Rati
o
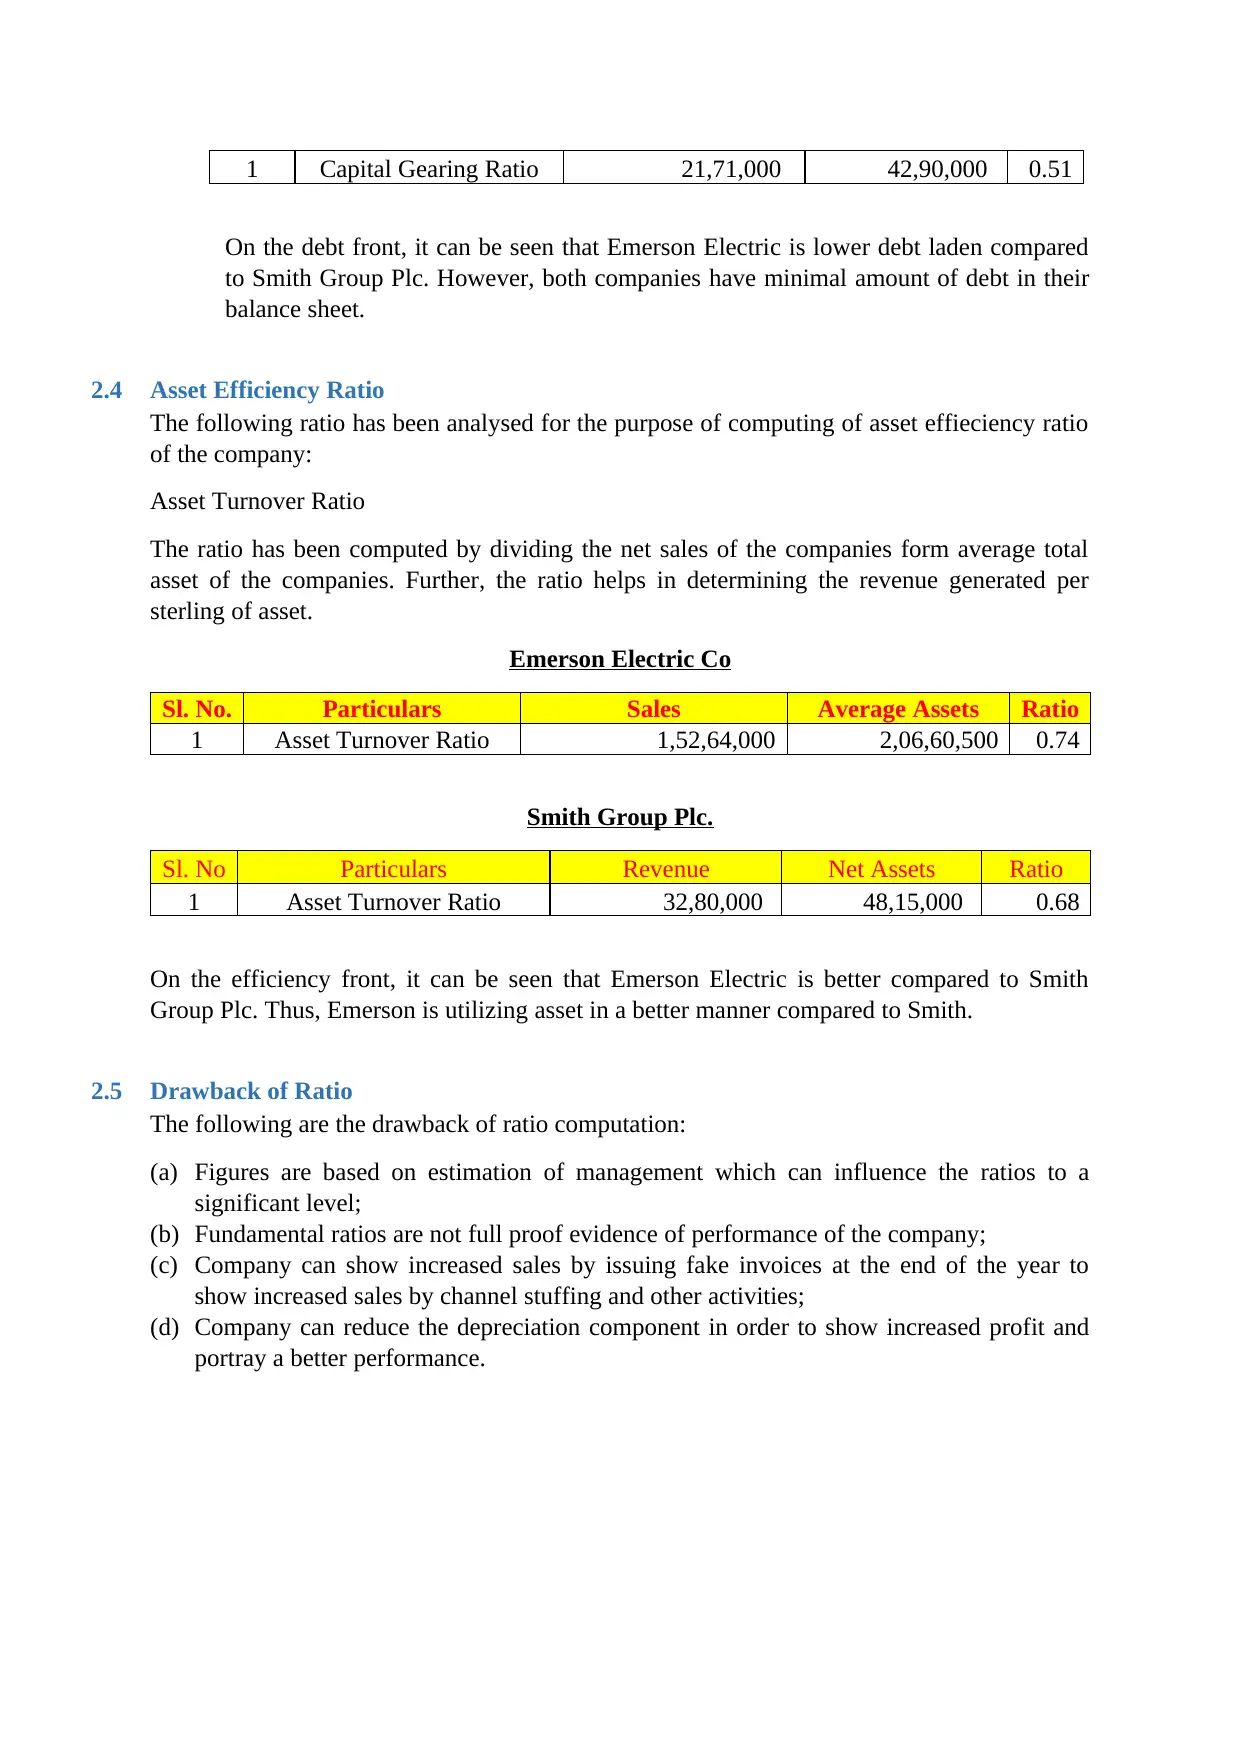
1 Capital Gearing Ratio 21,71,000 42,90,000 0.51
On the debt front, it can be seen that Emerson Electric is lower debt laden compared
to Smith Group Plc. However, both companies have minimal amount of debt in their
balance sheet.
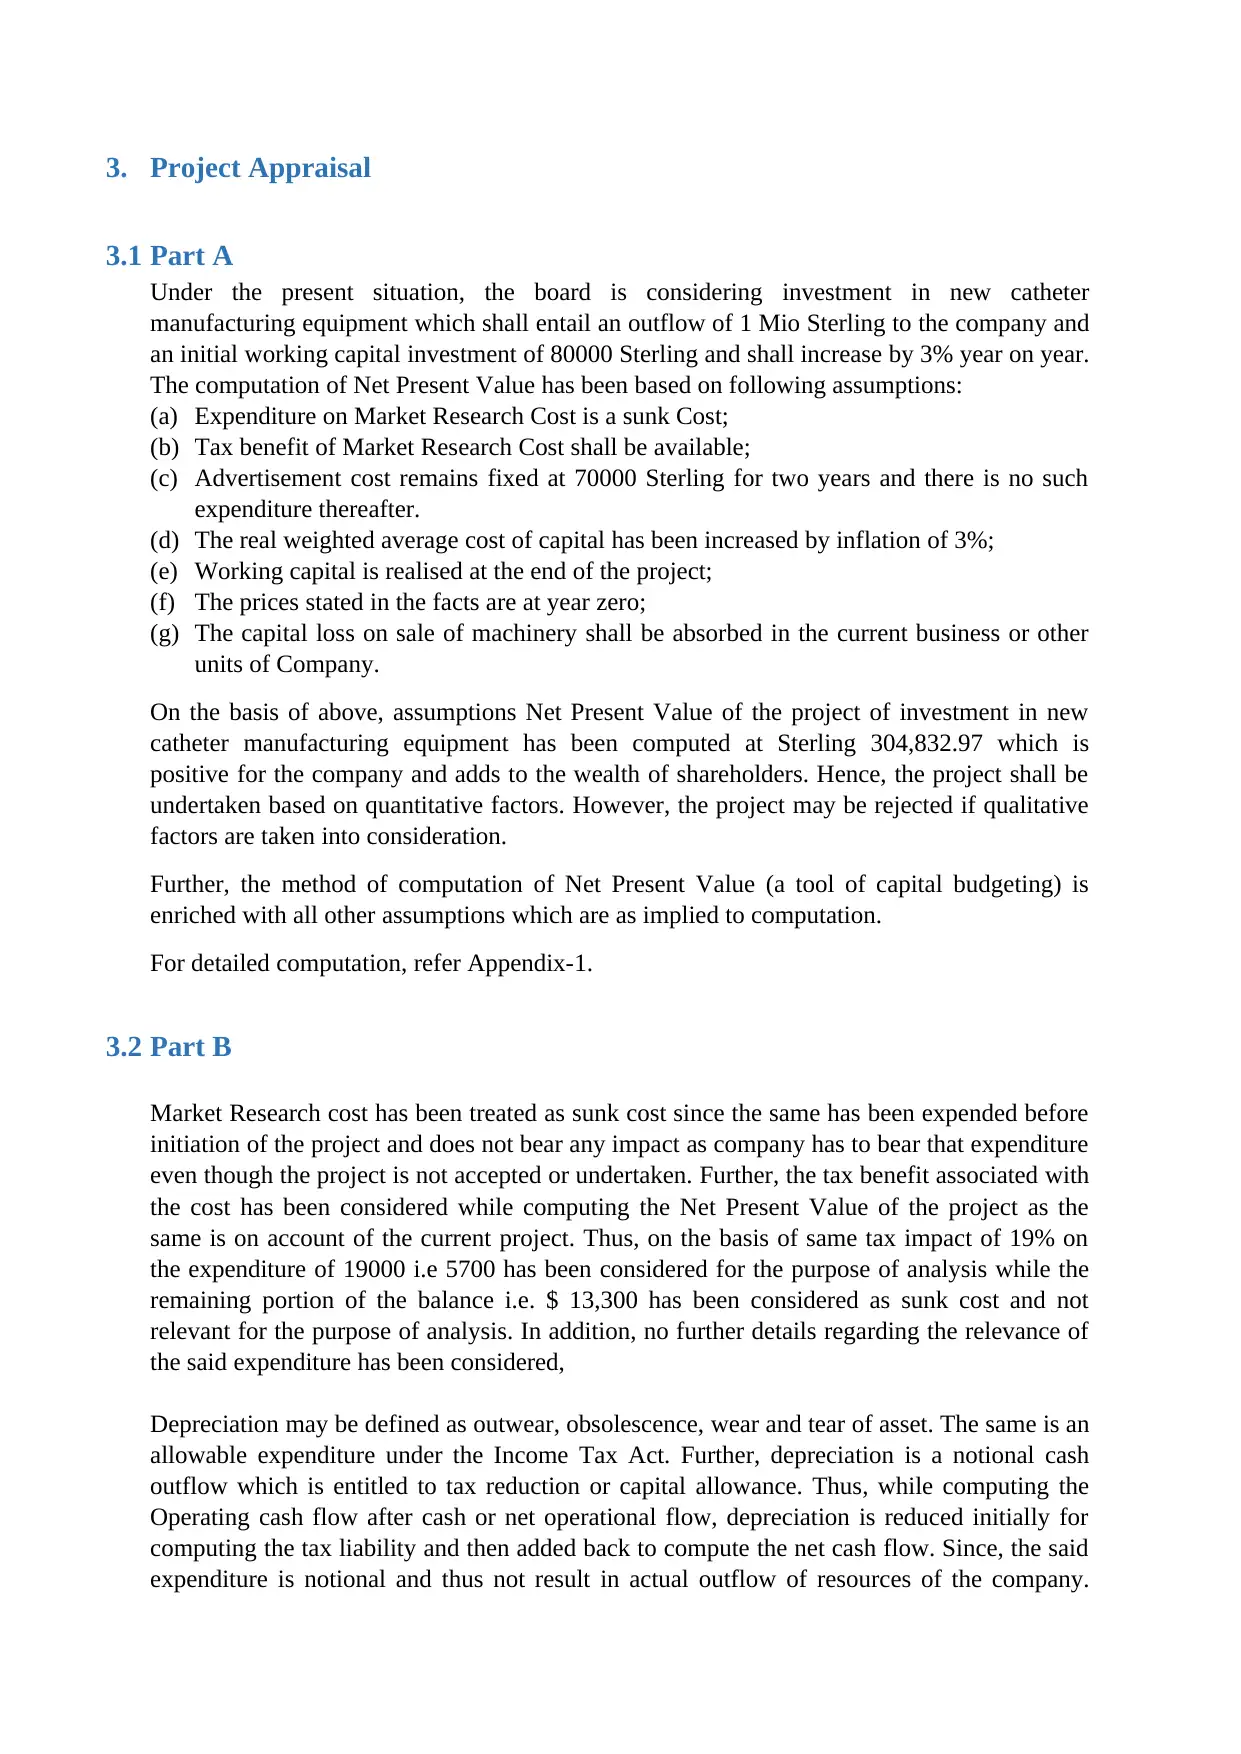
2.4 Asset Efficiency Ratio
The following ratio has been analysed for the purpose of computing of asset effieciency ratio
of the company:
Asset Turnover Ratio
The ratio has been computed by dividing the net sales of the companies form average total
asset of the companies. Further, the ratio helps in determining the revenue generated per
sterling of asset.
Emerson Electric Co
Sl. No. Particulars Sales Average Assets Ratio
1 Asset Turnover Ratio 1,52,64,000 2,06,60,500 0.74
Smith Group Plc.
Sl. No Particulars Revenue Net Assets Ratio
1 Asset Turnover Ratio 32,80,000 48,15,000 0.68
On the efficiency front, it can be seen that Emerson Electric is better compared to Smith
Group Plc. Thus, Emerson is utilizing asset in a better manner compared to Smith.
2.5 Drawback of Ratio
The following are the drawback of ratio computation:
(a) Figures are based on estimation of management which can influence the ratios to a
significant level;
(b) Fundamental ratios are not full proof evidence of performance of the company;
(c) Company can show increased sales by issuing fake invoices at the end of the year to
show increased sales by channel stuffing and other activities;
(d) Company can reduce the depreciation component in order to show increased profit and
portray a better performance.
On the debt front, it can be seen that Emerson Electric is lower debt laden compared
to Smith Group Plc. However, both companies have minimal amount of debt in their
balance sheet.
2.4 Asset Efficiency Ratio
The following ratio has been analysed for the purpose of computing of asset effieciency ratio
of the company:
Asset Turnover Ratio
The ratio has been computed by dividing the net sales of the companies form average total
asset of the companies. Further, the ratio helps in determining the revenue generated per
sterling of asset.
Emerson Electric Co
Sl. No. Particulars Sales Average Assets Ratio
1 Asset Turnover Ratio 1,52,64,000 2,06,60,500 0.74
Smith Group Plc.
Sl. No Particulars Revenue Net Assets Ratio
1 Asset Turnover Ratio 32,80,000 48,15,000 0.68
On the efficiency front, it can be seen that Emerson Electric is better compared to Smith
Group Plc. Thus, Emerson is utilizing asset in a better manner compared to Smith.
2.5 Drawback of Ratio
The following are the drawback of ratio computation:
(a) Figures are based on estimation of management which can influence the ratios to a
significant level;
(b) Fundamental ratios are not full proof evidence of performance of the company;
(c) Company can show increased sales by issuing fake invoices at the end of the year to
show increased sales by channel stuffing and other activities;
(d) Company can reduce the depreciation component in order to show increased profit and
portray a better performance.
⊘ This is a preview!⊘
Do you want full access?
Subscribe today to unlock all pages.
Trusted by 1+ million students worldwide
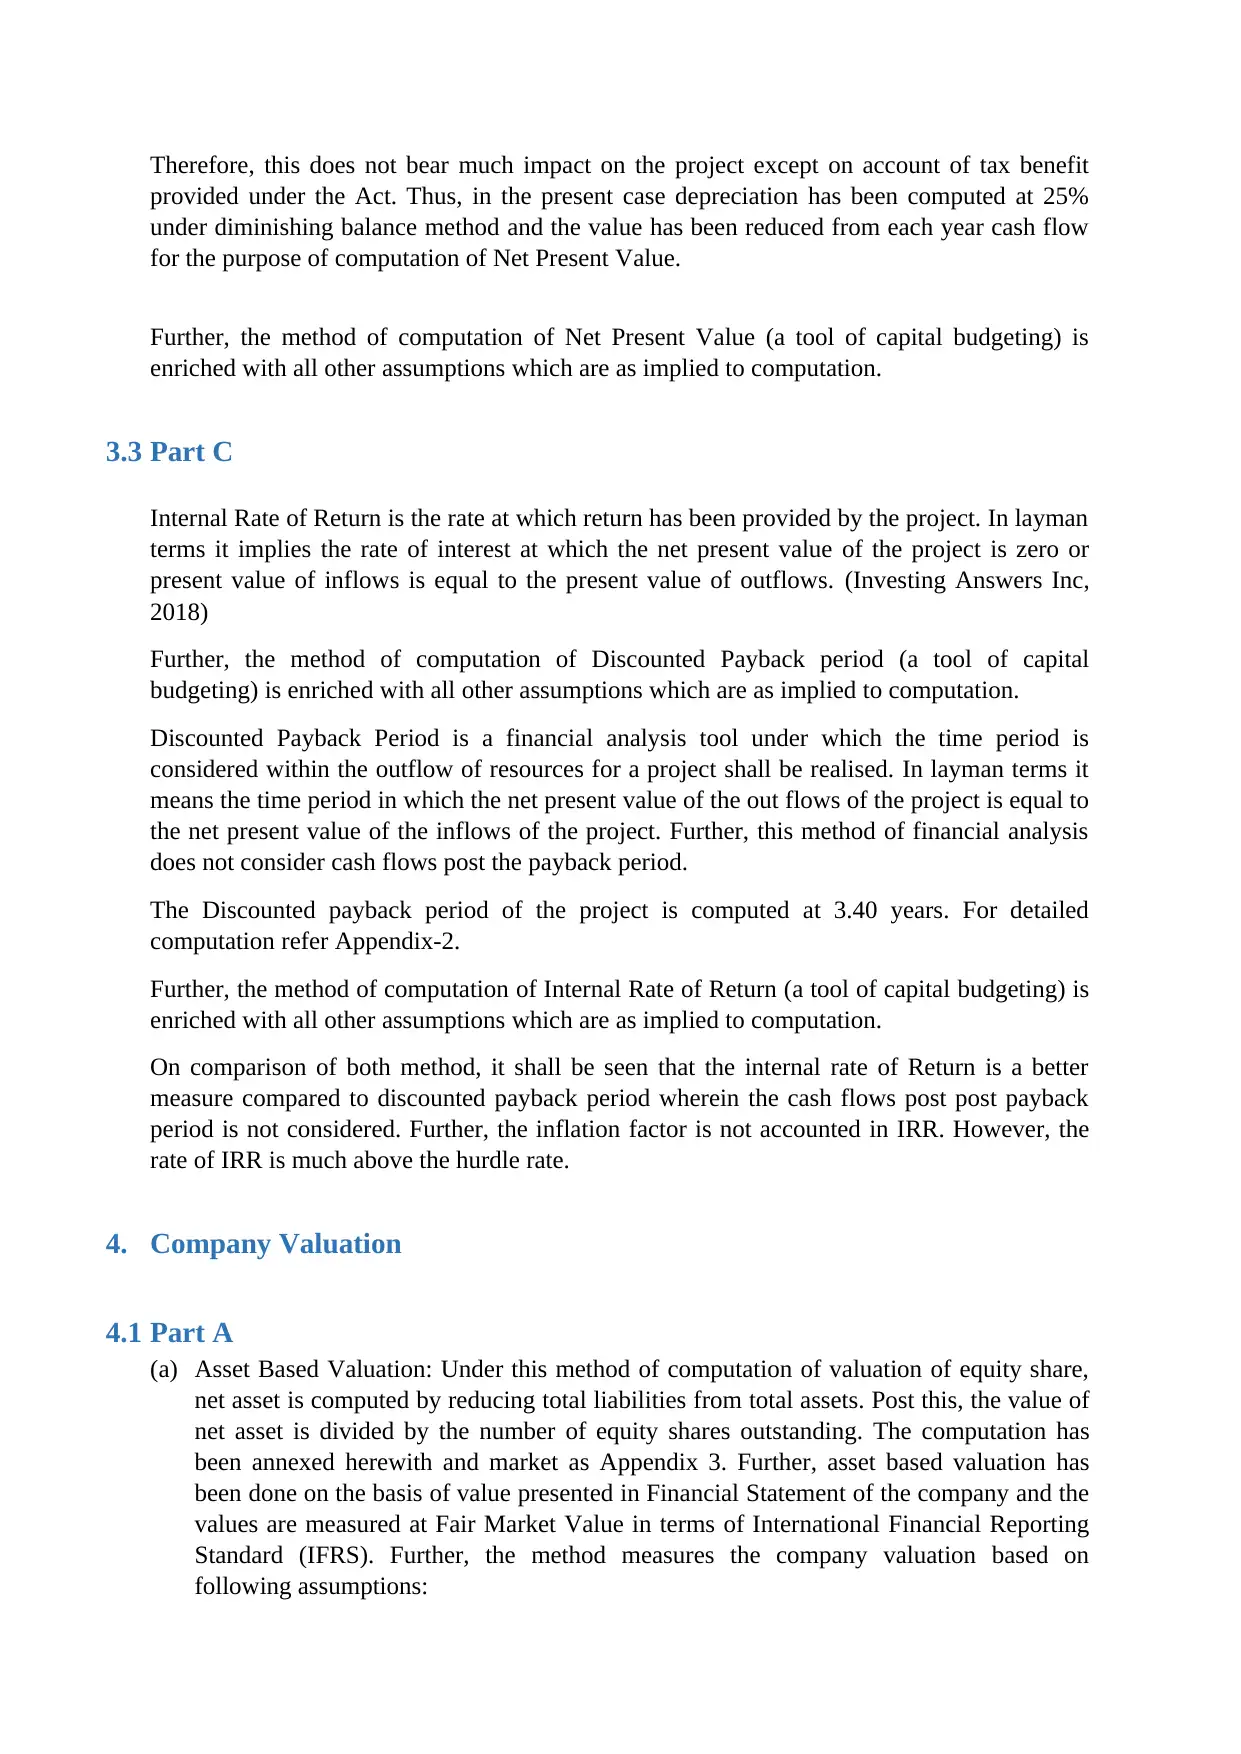
3. Project Appraisal
3.1 Part A
Under the present situation, the board is considering investment in new catheter
manufacturing equipment which shall entail an outflow of 1 Mio Sterling to the company and
an initial working capital investment of 80000 Sterling and shall increase by 3% year on year.
The computation of Net Present Value has been based on following assumptions:
(a) Expenditure on Market Research Cost is a sunk Cost;
(b) Tax benefit of Market Research Cost shall be available;
(c) Advertisement cost remains fixed at 70000 Sterling for two years and there is no such
expenditure thereafter.
(d) The real weighted average cost of capital has been increased by inflation of 3%;
(e) Working capital is realised at the end of the project;
(f) The prices stated in the facts are at year zero;
(g) The capital loss on sale of machinery shall be absorbed in the current business or other
units of Company.
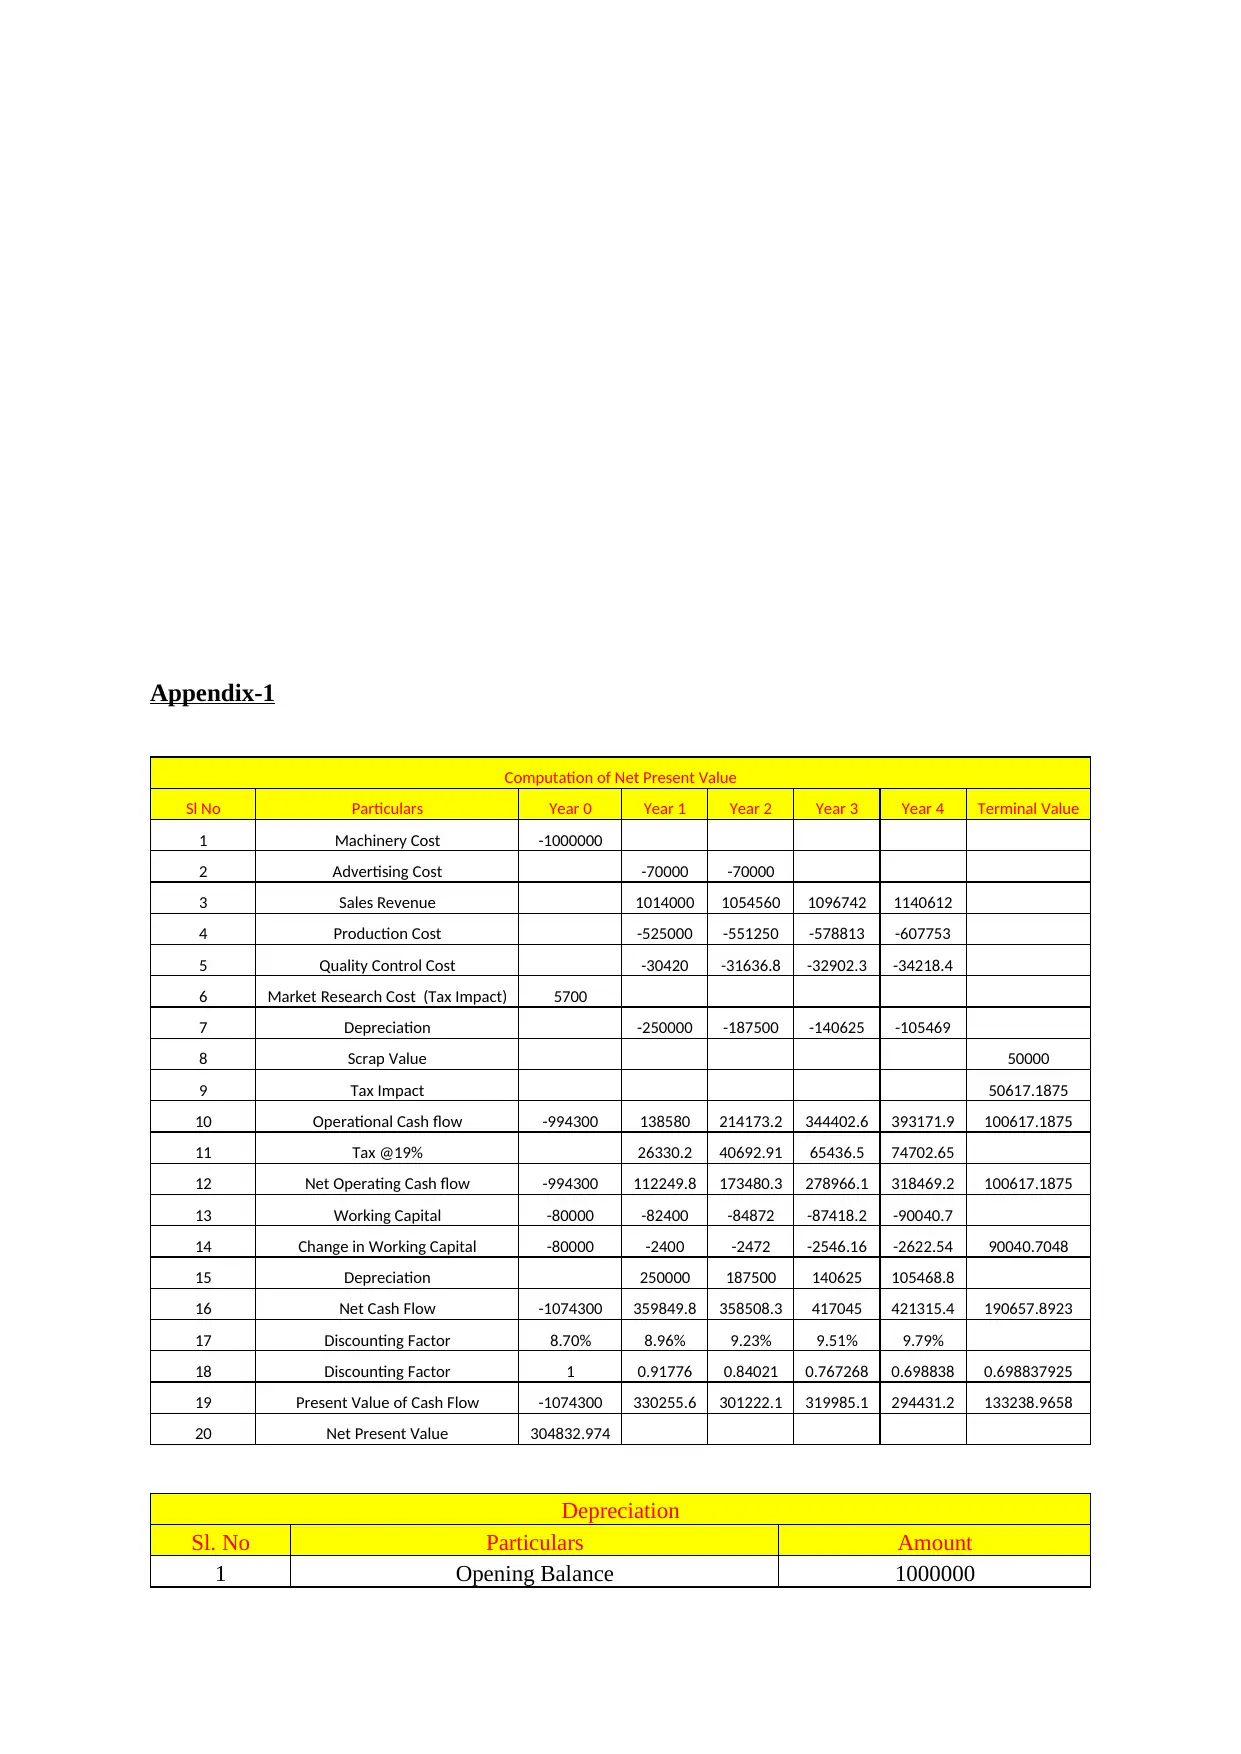
On the basis of above, assumptions Net Present Value of the project of investment in new
catheter manufacturing equipment has been computed at Sterling 304,832.97 which is
positive for the company and adds to the wealth of shareholders. Hence, the project shall be
undertaken based on quantitative factors. However, the project may be rejected if qualitative
factors are taken into consideration.
Further, the method of computation of Net Present Value (a tool of capital budgeting) is
enriched with all other assumptions which are as implied to computation.
For detailed computation, refer Appendix-1.
3.2 Part B
Market Research cost has been treated as sunk cost since the same has been expended before
initiation of the project and does not bear any impact as company has to bear that expenditure
even though the project is not accepted or undertaken. Further, the tax benefit associated with
the cost has been considered while computing the Net Present Value of the project as the
same is on account of the current project. Thus, on the basis of same tax impact of 19% on
the expenditure of 19000 i.e 5700 has been considered for the purpose of analysis while the
remaining portion of the balance i.e. $ 13,300 has been considered as sunk cost and not
relevant for the purpose of analysis. In addition, no further details regarding the relevance of
the said expenditure has been considered,
Depreciation may be defined as outwear, obsolescence, wear and tear of asset. The same is an
allowable expenditure under the Income Tax Act. Further, depreciation is a notional cash
outflow which is entitled to tax reduction or capital allowance. Thus, while computing the
Operating cash flow after cash or net operational flow, depreciation is reduced initially for
computing the tax liability and then added back to compute the net cash flow. Since, the said
expenditure is notional and thus not result in actual outflow of resources of the company.
3.1 Part A
Under the present situation, the board is considering investment in new catheter
manufacturing equipment which shall entail an outflow of 1 Mio Sterling to the company and
an initial working capital investment of 80000 Sterling and shall increase by 3% year on year.
The computation of Net Present Value has been based on following assumptions:
(a) Expenditure on Market Research Cost is a sunk Cost;
(b) Tax benefit of Market Research Cost shall be available;
(c) Advertisement cost remains fixed at 70000 Sterling for two years and there is no such
expenditure thereafter.
(d) The real weighted average cost of capital has been increased by inflation of 3%;
(e) Working capital is realised at the end of the project;
(f) The prices stated in the facts are at year zero;
(g) The capital loss on sale of machinery shall be absorbed in the current business or other
units of Company.
On the basis of above, assumptions Net Present Value of the project of investment in new
catheter manufacturing equipment has been computed at Sterling 304,832.97 which is
positive for the company and adds to the wealth of shareholders. Hence, the project shall be
undertaken based on quantitative factors. However, the project may be rejected if qualitative
factors are taken into consideration.
Further, the method of computation of Net Present Value (a tool of capital budgeting) is
enriched with all other assumptions which are as implied to computation.
For detailed computation, refer Appendix-1.
3.2 Part B
Market Research cost has been treated as sunk cost since the same has been expended before
initiation of the project and does not bear any impact as company has to bear that expenditure
even though the project is not accepted or undertaken. Further, the tax benefit associated with
the cost has been considered while computing the Net Present Value of the project as the
same is on account of the current project. Thus, on the basis of same tax impact of 19% on
the expenditure of 19000 i.e 5700 has been considered for the purpose of analysis while the
remaining portion of the balance i.e. $ 13,300 has been considered as sunk cost and not
relevant for the purpose of analysis. In addition, no further details regarding the relevance of
the said expenditure has been considered,
Depreciation may be defined as outwear, obsolescence, wear and tear of asset. The same is an
allowable expenditure under the Income Tax Act. Further, depreciation is a notional cash
outflow which is entitled to tax reduction or capital allowance. Thus, while computing the
Operating cash flow after cash or net operational flow, depreciation is reduced initially for
computing the tax liability and then added back to compute the net cash flow. Since, the said
expenditure is notional and thus not result in actual outflow of resources of the company.
Paraphrase This Document
Need a fresh take? Get an instant paraphrase of this document with our AI Paraphraser
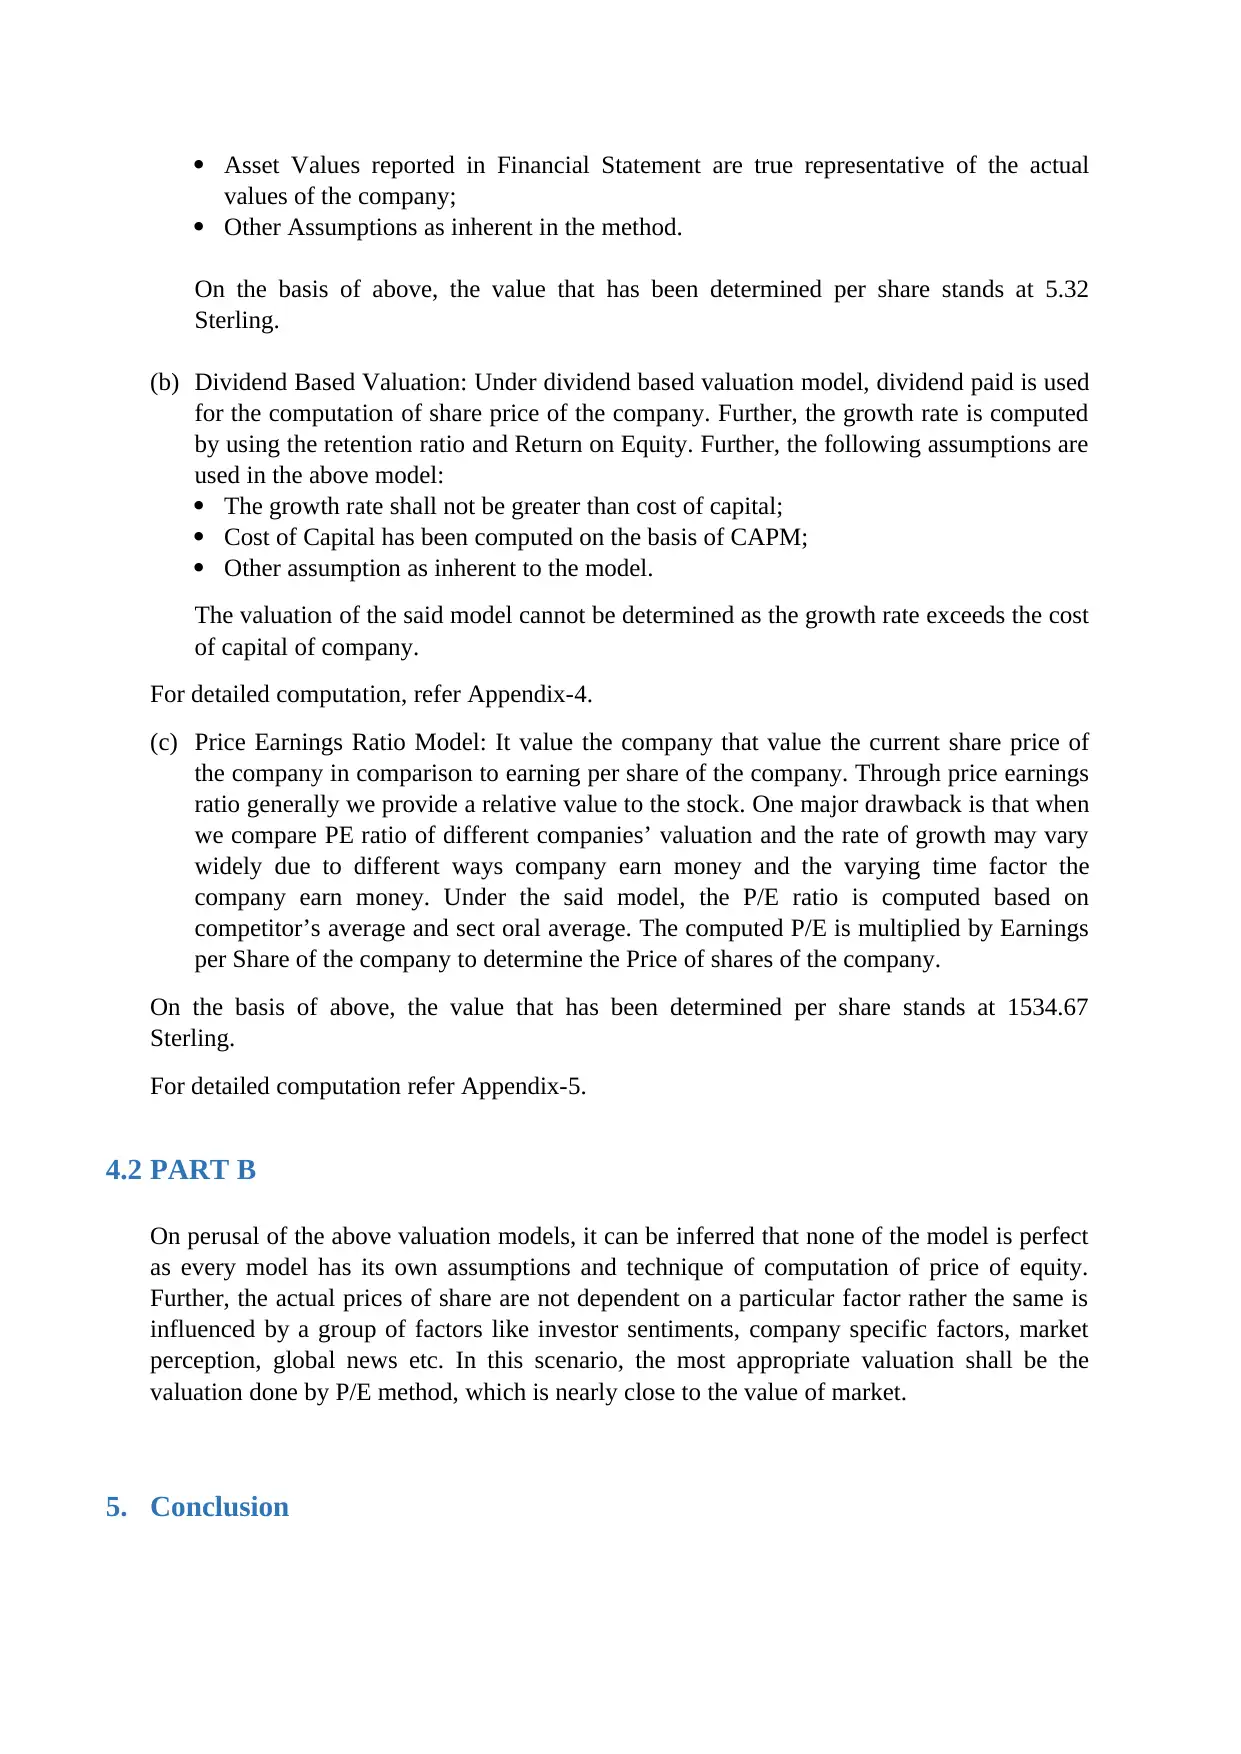
Therefore, this does not bear much impact on the project except on account of tax benefit
provided under the Act. Thus, in the present case depreciation has been computed at 25%
under diminishing balance method and the value has been reduced from each year cash flow
for the purpose of computation of Net Present Value.
Further, the method of computation of Net Present Value (a tool of capital budgeting) is
enriched with all other assumptions which are as implied to computation.
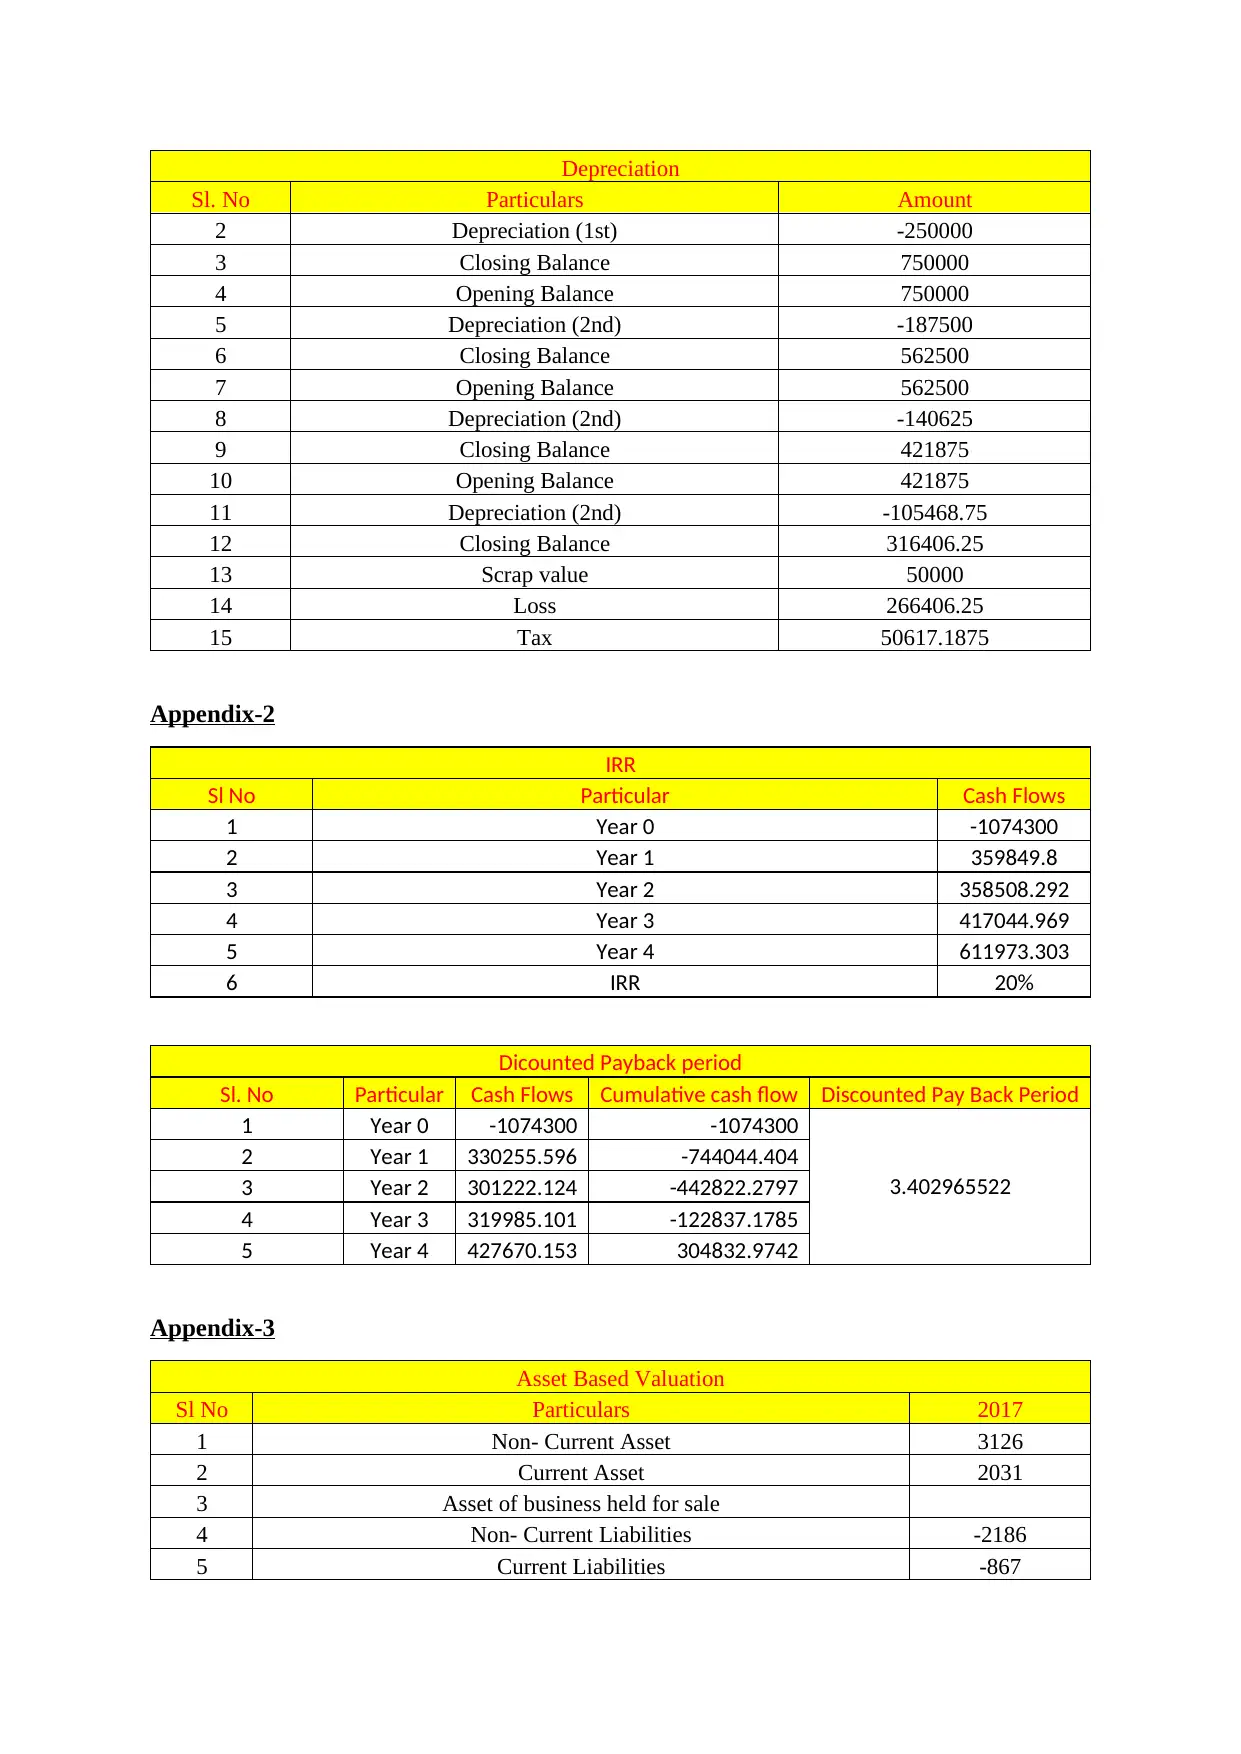
3.3 Part C
Internal Rate of Return is the rate at which return has been provided by the project. In layman
terms it implies the rate of interest at which the net present value of the project is zero or
present value of inflows is equal to the present value of outflows. (Investing Answers Inc,
2018)
Further, the method of computation of Discounted Payback period (a tool of capital
budgeting) is enriched with all other assumptions which are as implied to computation.
Discounted Payback Period is a financial analysis tool under which the time period is
considered within the outflow of resources for a project shall be realised. In layman terms it
means the time period in which the net present value of the out flows of the project is equal to
the net present value of the inflows of the project. Further, this method of financial analysis
does not consider cash flows post the payback period.
The Discounted payback period of the project is computed at 3.40 years. For detailed
computation refer Appendix-2.
Further, the method of computation of Internal Rate of Return (a tool of capital budgeting) is
enriched with all other assumptions which are as implied to computation.
On comparison of both method, it shall be seen that the internal rate of Return is a better
measure compared to discounted payback period wherein the cash flows post post payback
period is not considered. Further, the inflation factor is not accounted in IRR. However, the
rate of IRR is much above the hurdle rate.
4. Company Valuation
4.1 Part A
(a) Asset Based Valuation: Under this method of computation of valuation of equity share,
net asset is computed by reducing total liabilities from total assets. Post this, the value of
net asset is divided by the number of equity shares outstanding. The computation has
been annexed herewith and market as Appendix 3. Further, asset based valuation has
been done on the basis of value presented in Financial Statement of the company and the
values are measured at Fair Market Value in terms of International Financial Reporting
Standard (IFRS). Further, the method measures the company valuation based on
following assumptions:
provided under the Act. Thus, in the present case depreciation has been computed at 25%
under diminishing balance method and the value has been reduced from each year cash flow
for the purpose of computation of Net Present Value.
Further, the method of computation of Net Present Value (a tool of capital budgeting) is
enriched with all other assumptions which are as implied to computation.
3.3 Part C
Internal Rate of Return is the rate at which return has been provided by the project. In layman
terms it implies the rate of interest at which the net present value of the project is zero or
present value of inflows is equal to the present value of outflows. (Investing Answers Inc,
2018)
Further, the method of computation of Discounted Payback period (a tool of capital
budgeting) is enriched with all other assumptions which are as implied to computation.
Discounted Payback Period is a financial analysis tool under which the time period is
considered within the outflow of resources for a project shall be realised. In layman terms it
means the time period in which the net present value of the out flows of the project is equal to
the net present value of the inflows of the project. Further, this method of financial analysis
does not consider cash flows post the payback period.
The Discounted payback period of the project is computed at 3.40 years. For detailed
computation refer Appendix-2.
Further, the method of computation of Internal Rate of Return (a tool of capital budgeting) is
enriched with all other assumptions which are as implied to computation.
On comparison of both method, it shall be seen that the internal rate of Return is a better
measure compared to discounted payback period wherein the cash flows post post payback
period is not considered. Further, the inflation factor is not accounted in IRR. However, the
rate of IRR is much above the hurdle rate.
4. Company Valuation
4.1 Part A
(a) Asset Based Valuation: Under this method of computation of valuation of equity share,
net asset is computed by reducing total liabilities from total assets. Post this, the value of
net asset is divided by the number of equity shares outstanding. The computation has
been annexed herewith and market as Appendix 3. Further, asset based valuation has
been done on the basis of value presented in Financial Statement of the company and the
values are measured at Fair Market Value in terms of International Financial Reporting
Standard (IFRS). Further, the method measures the company valuation based on
following assumptions:
Asset Values reported in Financial Statement are true representative of the actual
values of the company;
Other Assumptions as inherent in the method.
On the basis of above, the value that has been determined per share stands at 5.32
Sterling.
(b) Dividend Based Valuation: Under dividend based valuation model, dividend paid is used
for the computation of share price of the company. Further, the growth rate is computed
by using the retention ratio and Return on Equity. Further, the following assumptions are
used in the above model:
The growth rate shall not be greater than cost of capital;
Cost of Capital has been computed on the basis of CAPM;
Other assumption as inherent to the model.
The valuation of the said model cannot be determined as the growth rate exceeds the cost
of capital of company.
For detailed computation, refer Appendix-4.
(c) Price Earnings Ratio Model: It value the company that value the current share price of
the company in comparison to earning per share of the company. Through price earnings
ratio generally we provide a relative value to the stock. One major drawback is that when
we compare PE ratio of different companies’ valuation and the rate of growth may vary
widely due to different ways company earn money and the varying time factor the
company earn money. Under the said model, the P/E ratio is computed based on
competitor’s average and sect oral average. The computed P/E is multiplied by Earnings
per Share of the company to determine the Price of shares of the company.
On the basis of above, the value that has been determined per share stands at 1534.67
Sterling.
For detailed computation refer Appendix-5.
4.2 PART B
On perusal of the above valuation models, it can be inferred that none of the model is perfect
as every model has its own assumptions and technique of computation of price of equity.
Further, the actual prices of share are not dependent on a particular factor rather the same is
influenced by a group of factors like investor sentiments, company specific factors, market
perception, global news etc. In this scenario, the most appropriate valuation shall be the
valuation done by P/E method, which is nearly close to the value of market.
5. Conclusion
⊘ This is a preview!⊘
Do you want full access?
Subscribe today to unlock all pages.
Trusted by 1+ million students worldwide
The financial position of the company is quite better and the project is viable to be accepted,
as it would give us better return to the business. As the project Net Present Value, Internal
Rate of Return and discounted payback period is quite good comparison to industry the
project is viable to be accepted.
References:
CFI Education Inc., 2018. Net Present Value (NPV). [Online]
Available at: https://corporatefinanceinstitute.com/resources/knowledge/valuation/net-present-value-
npv/
[Accessed 11 December 2018].
Investing Answers Inc, 2018. Internal Rate of Return (IRR). [Online]
Available at: https://investinganswers.com/financial-dictionary/investing/internal-rate-return-irr-2130
[Accessed 9 December 2018].
London Stock Exchange Plc, 2018. SMIN SMITHS GROUP PLC ORD 37.5P. [Online]
Available at: https://www.londonstockexchange.com/exchange/prices/stocks/summary/
fundamentals.html?fourWayKey=GB00B1WY2338GBGBXSET1
[Accessed 9 December 2018].
Paraphrase This Document
Need a fresh take? Get an instant paraphrase of this document with our AI Paraphraser
Appendix-1
Computation of Net Present Value
Sl No Particulars Year 0 Year 1 Year 2 Year 3 Year 4 Terminal Value
1 Machinery Cost -1000000
2 Advertising Cost -70000 -70000
3 Sales Revenue 1014000 1054560 1096742 1140612
4 Production Cost -525000 -551250 -578813 -607753
5 Quality Control Cost -30420 -31636.8 -32902.3 -34218.4
6 Market Research Cost (Tax Impact) 5700
7 Depreciation -250000 -187500 -140625 -105469
8 Scrap Value 50000
9 Tax Impact 50617.1875
10 Operational Cash flow -994300 138580 214173.2 344402.6 393171.9 100617.1875
11 Tax @19% 26330.2 40692.91 65436.5 74702.65
12 Net Operating Cash flow -994300 112249.8 173480.3 278966.1 318469.2 100617.1875
13 Working Capital -80000 -82400 -84872 -87418.2 -90040.7
14 Change in Working Capital -80000 -2400 -2472 -2546.16 -2622.54 90040.7048
15 Depreciation 250000 187500 140625 105468.8
16 Net Cash Flow -1074300 359849.8 358508.3 417045 421315.4 190657.8923
17 Discounting Factor 8.70% 8.96% 9.23% 9.51% 9.79%
18 Discounting Factor 1 0.91776 0.84021 0.767268 0.698838 0.698837925
19 Present Value of Cash Flow -1074300 330255.6 301222.1 319985.1 294431.2 133238.9658
20 Net Present Value 304832.974
Depreciation
Sl. No Particulars Amount
1 Opening Balance 1000000
Depreciation
Sl. No Particulars Amount
2 Depreciation (1st) -250000
3 Closing Balance 750000
4 Opening Balance 750000
5 Depreciation (2nd) -187500
6 Closing Balance 562500
7 Opening Balance 562500
8 Depreciation (2nd) -140625
9 Closing Balance 421875
10 Opening Balance 421875
11 Depreciation (2nd) -105468.75
12 Closing Balance 316406.25
13 Scrap value 50000
14 Loss 266406.25
15 Tax 50617.1875
Appendix-2
IRR
Sl No Particular Cash Flows
1 Year 0 -1074300
2 Year 1 359849.8
3 Year 2 358508.292
4 Year 3 417044.969
5 Year 4 611973.303
6 IRR 20%
Dicounted Payback period
Sl. No Particular Cash Flows Cumulative cash flow Discounted Pay Back Period
1 Year 0 -1074300 -1074300
3.402965522
2 Year 1 330255.596 -744044.404
3 Year 2 301222.124 -442822.2797
4 Year 3 319985.101 -122837.1785
5 Year 4 427670.153 304832.9742
Appendix-3
Asset Based Valuation
Sl No Particulars 2017
1 Non- Current Asset 3126
2 Current Asset 2031
3 Asset of business held for sale
4 Non- Current Liabilities -2186
5 Current Liabilities -867
⊘ This is a preview!⊘
Do you want full access?
Subscribe today to unlock all pages.
Trusted by 1+ million students worldwide
1 out of 15
Related Documents


Your All-in-One AI-Powered Toolkit for Academic Success.
+13062052269
info@desklib.com
Available 24*7 on WhatsApp / Email
![[object Object]](/_next/static/media/star-bottom.7253800d.svg)
Unlock your academic potential
Copyright © 2020–2026 A2Z Services. All Rights Reserved. Developed and managed by ZUCOL.