Financial Management Case Study: Smith Inc. Analysis and Solutions

Verified

Added on  2021/12/22

|11
|1825
|28
Case Study
AI Summary
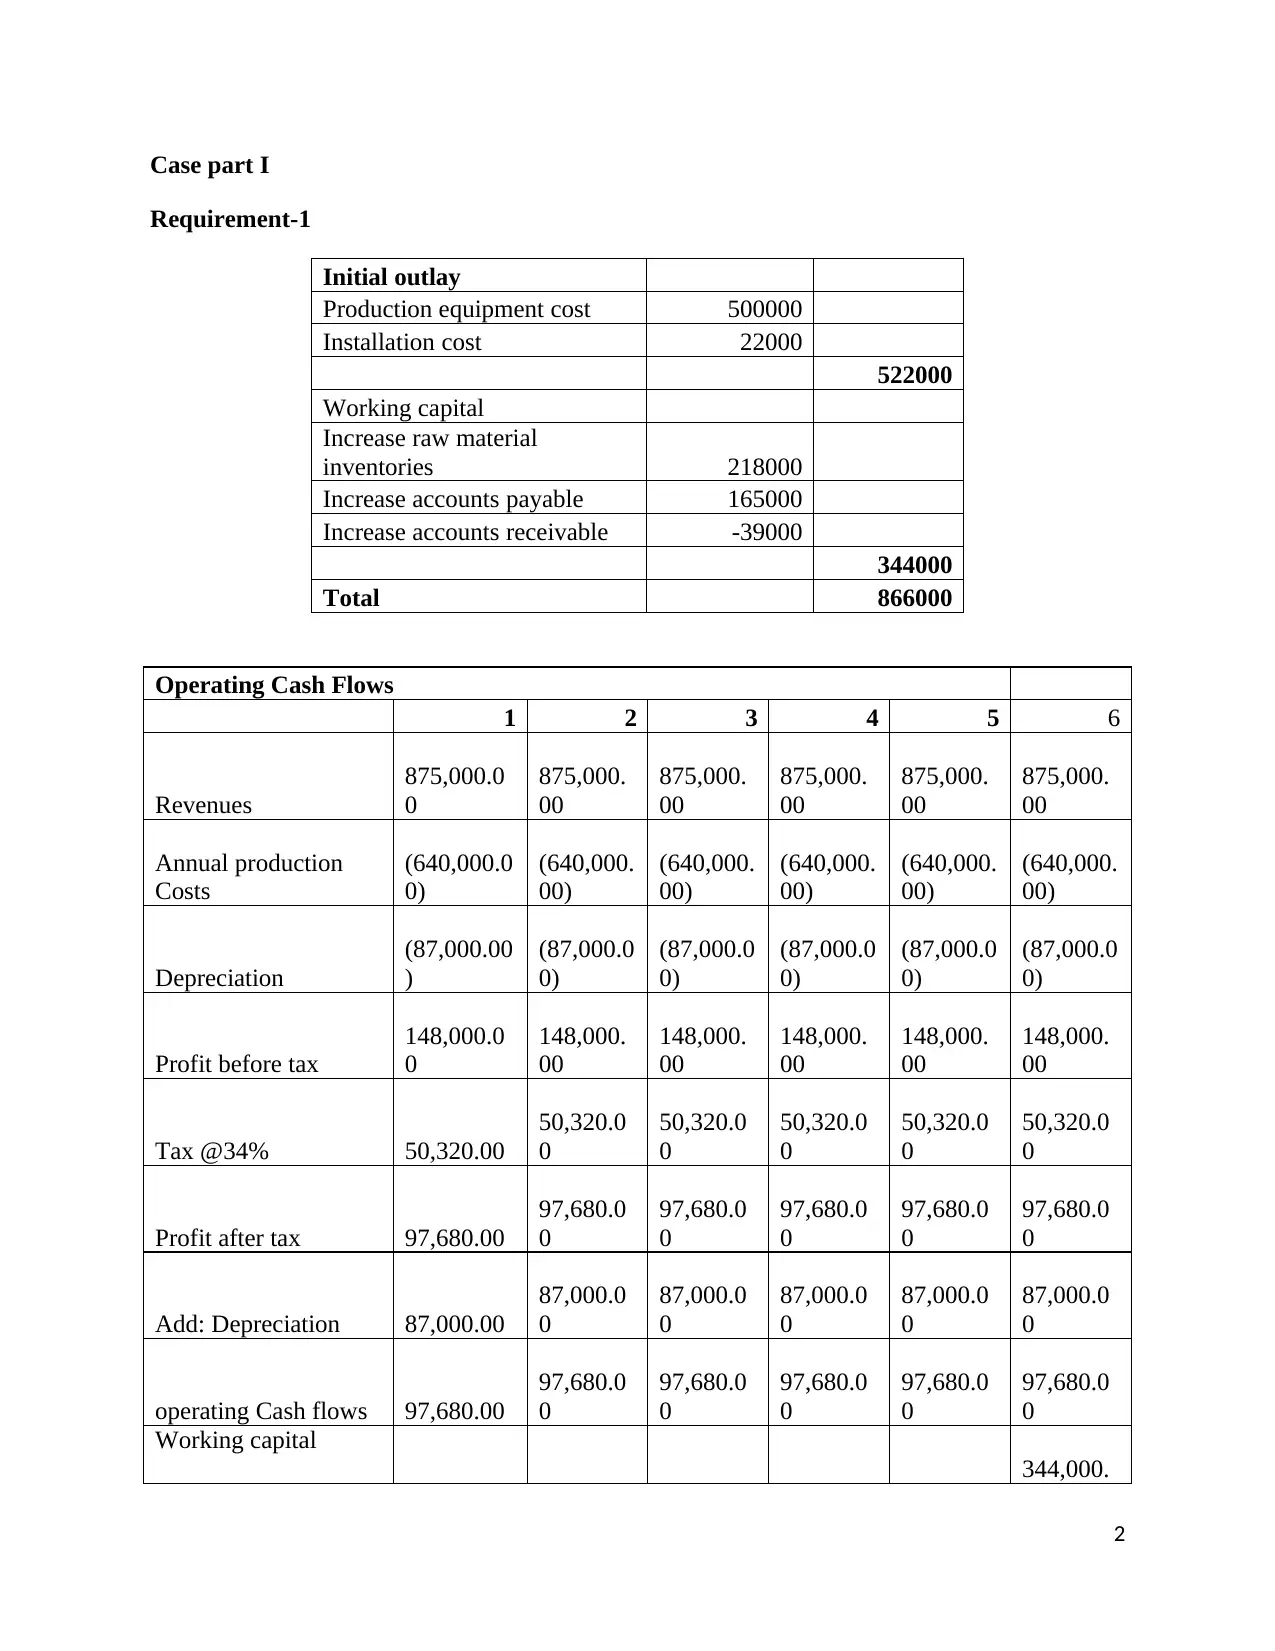
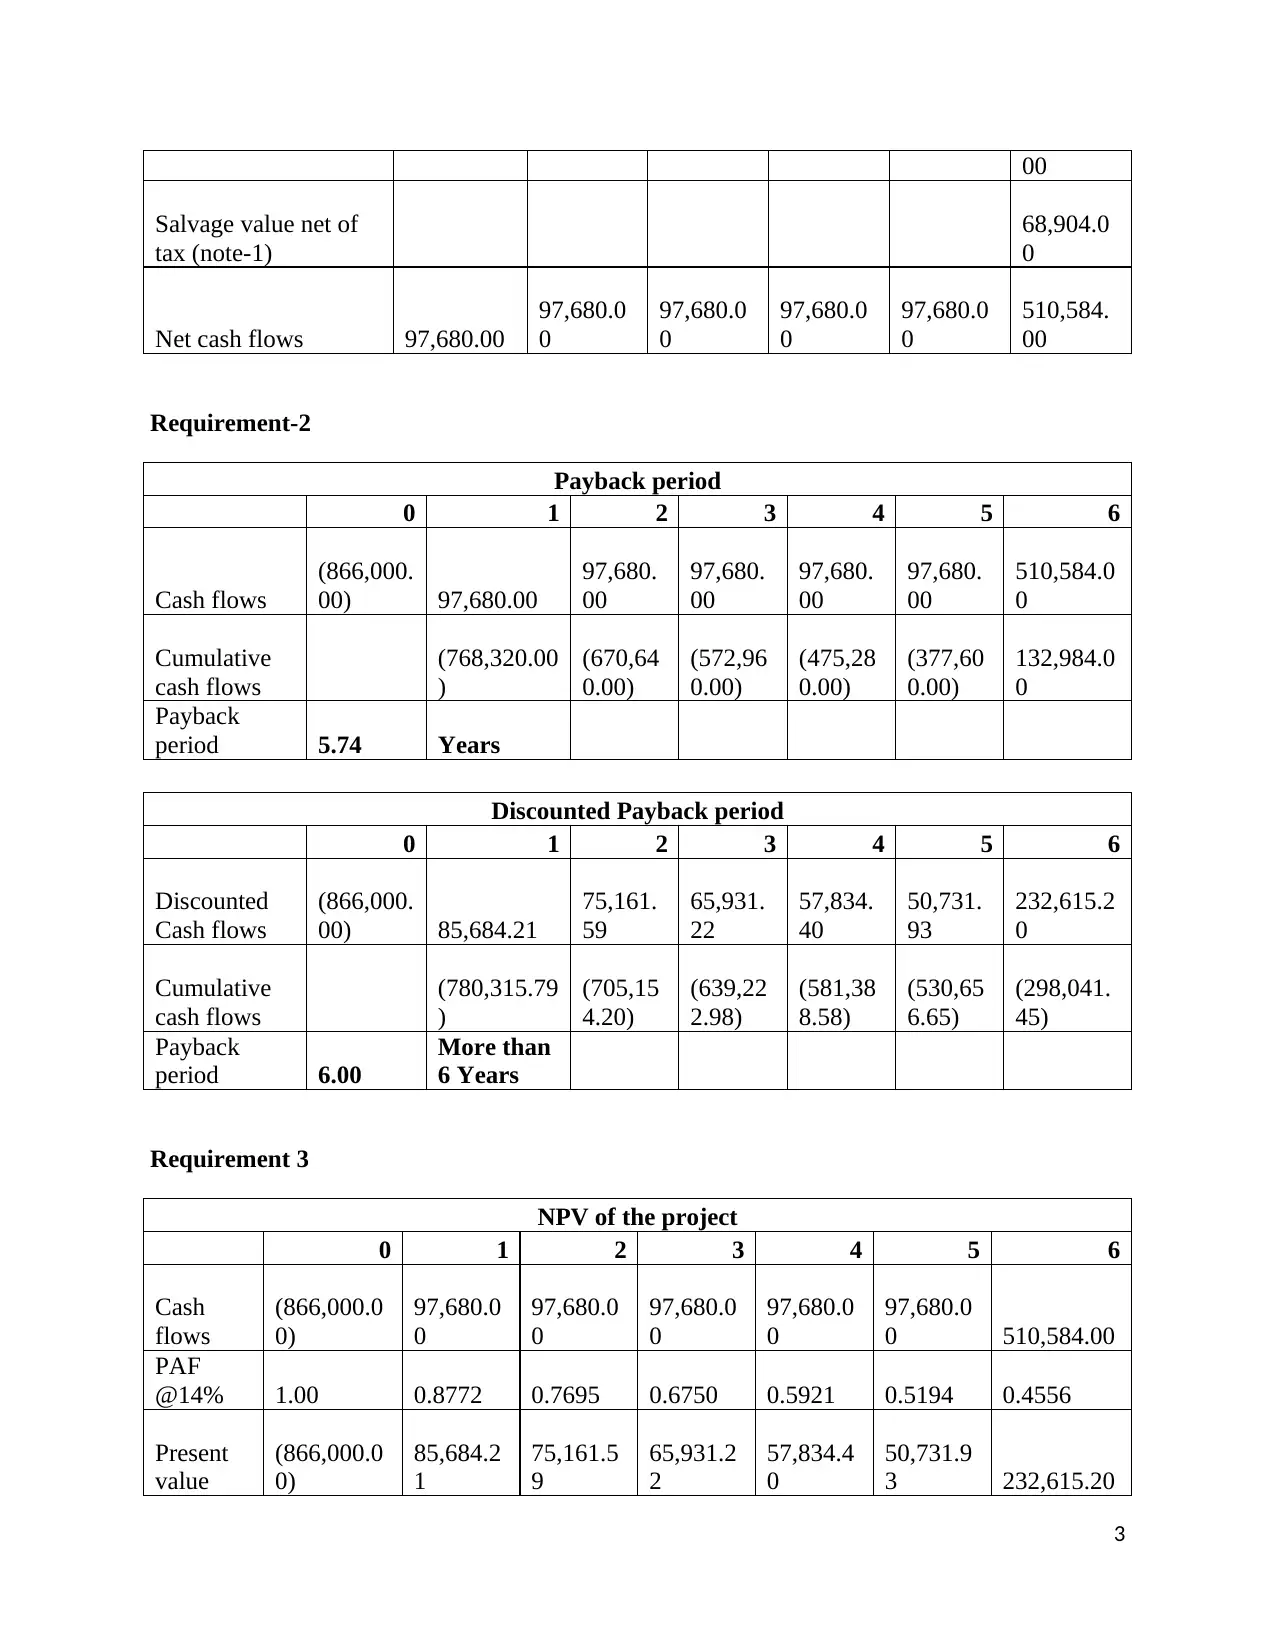
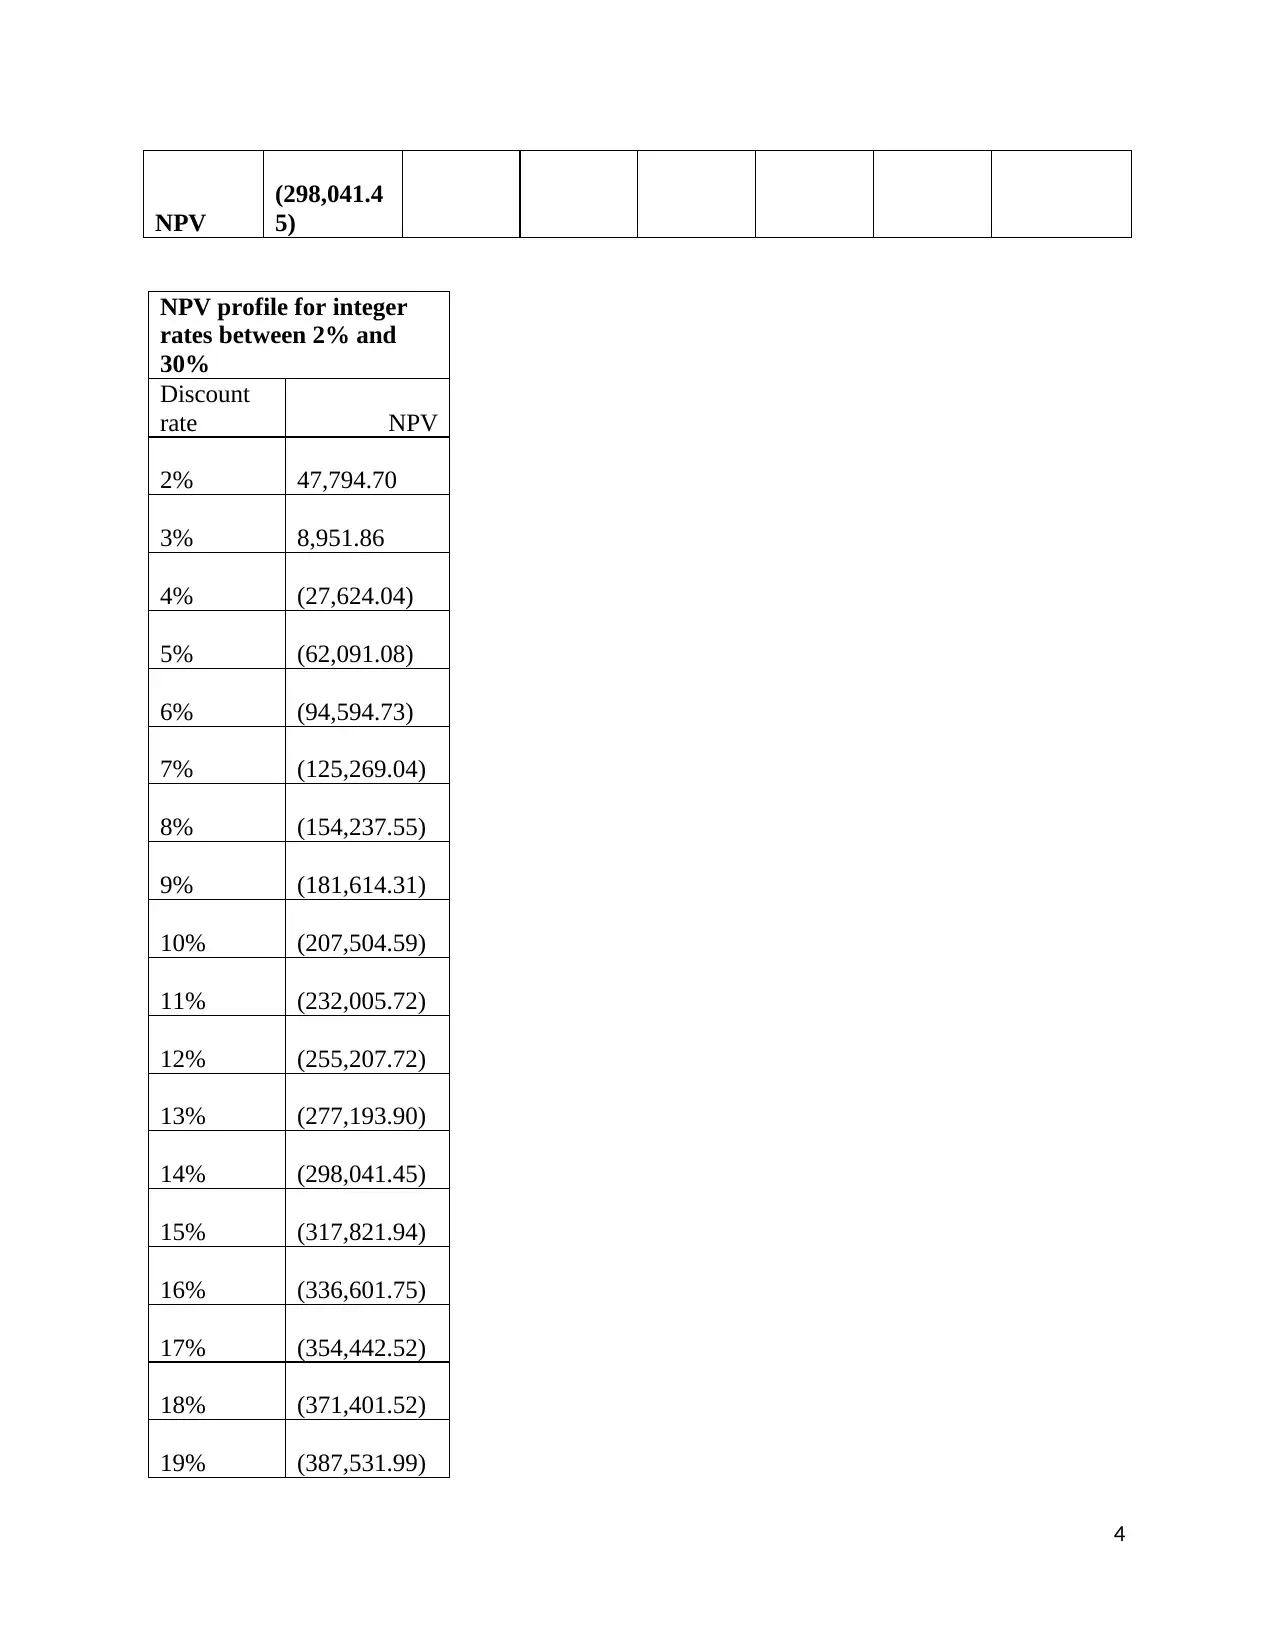
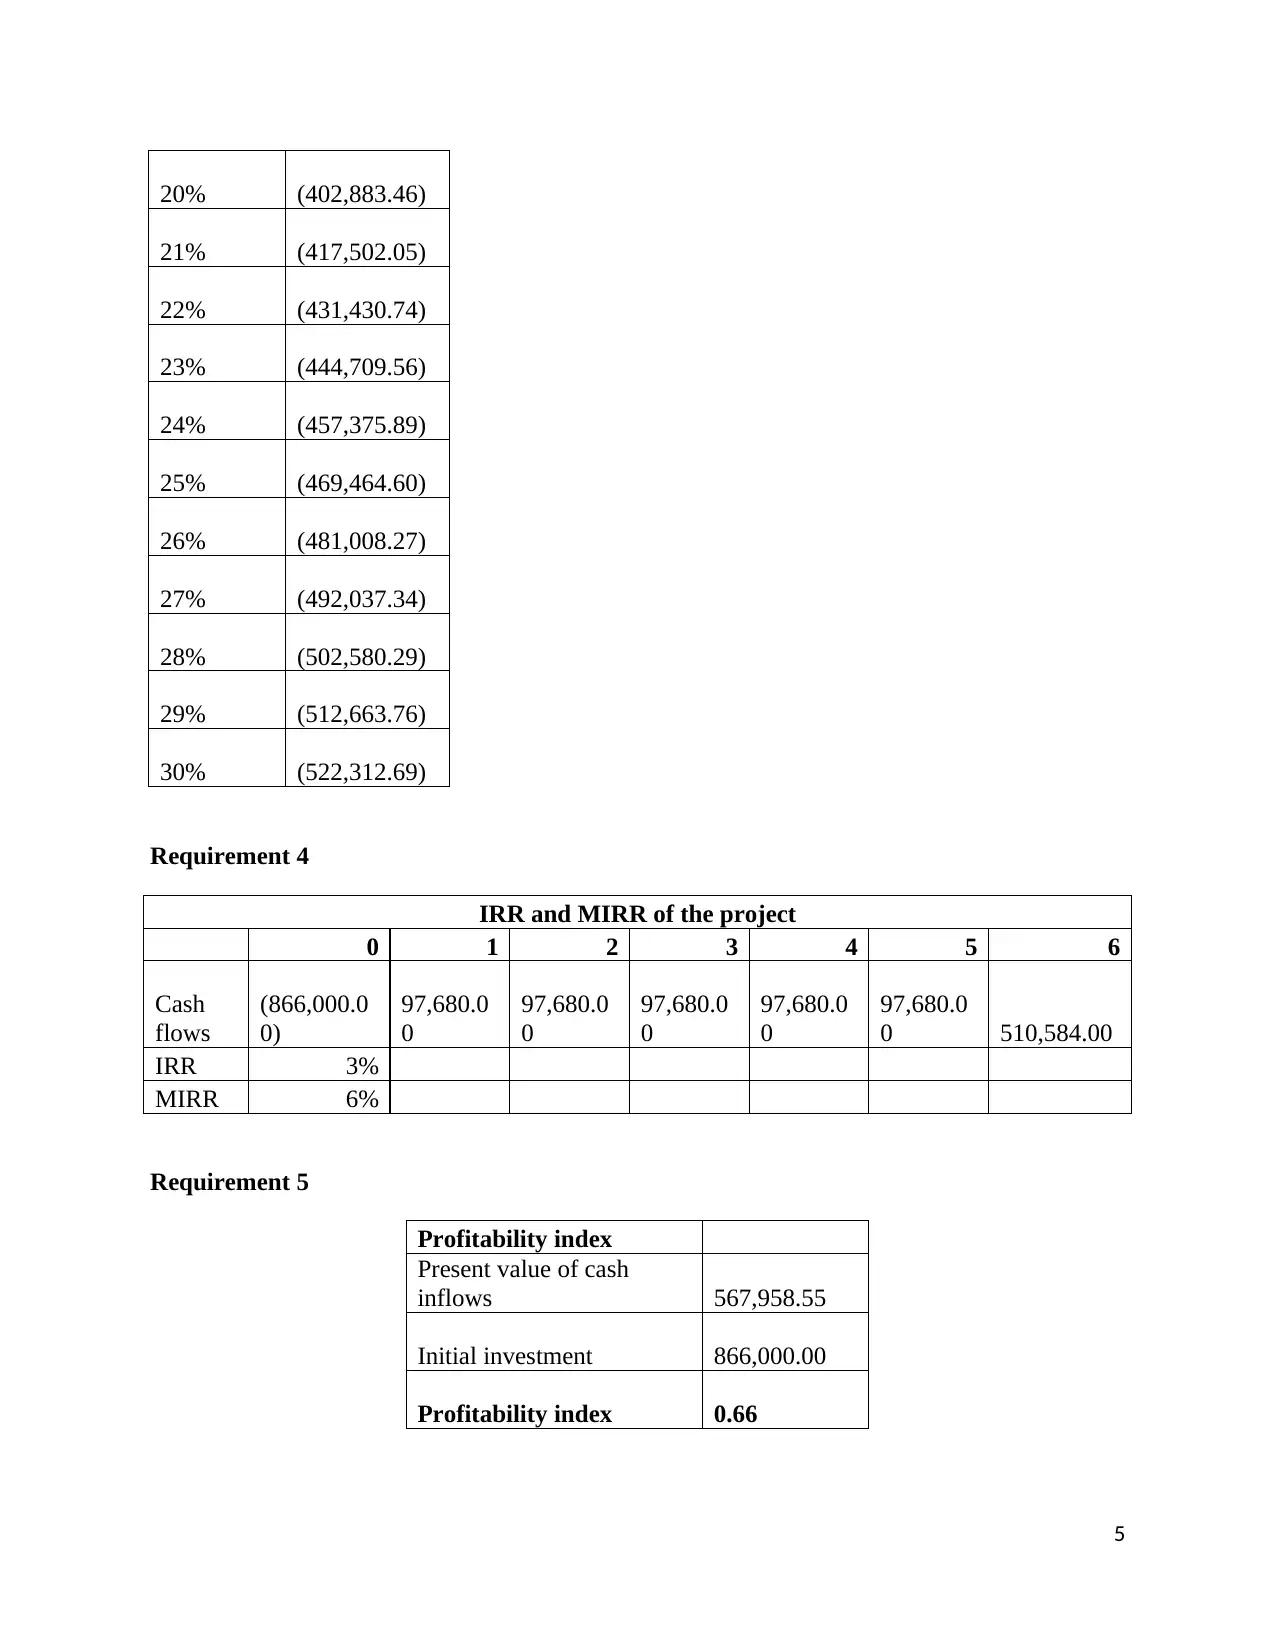
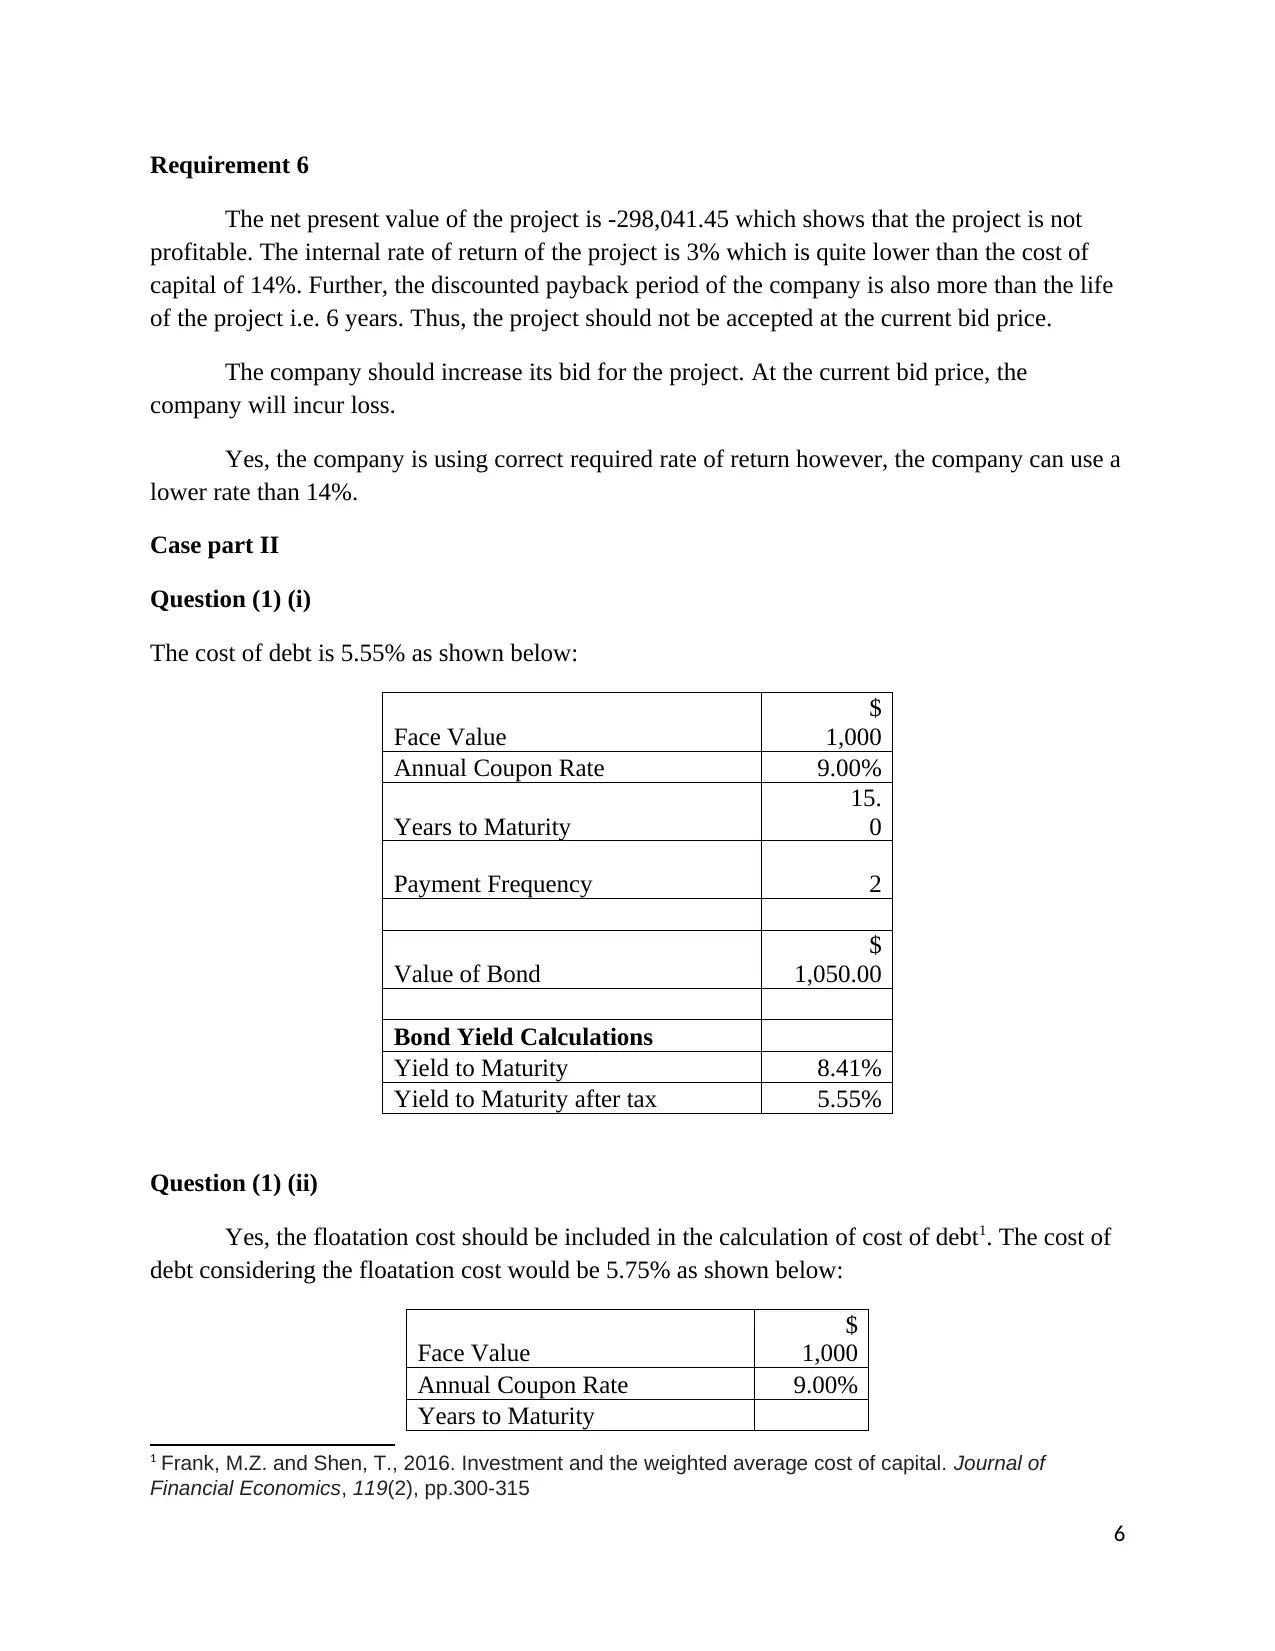
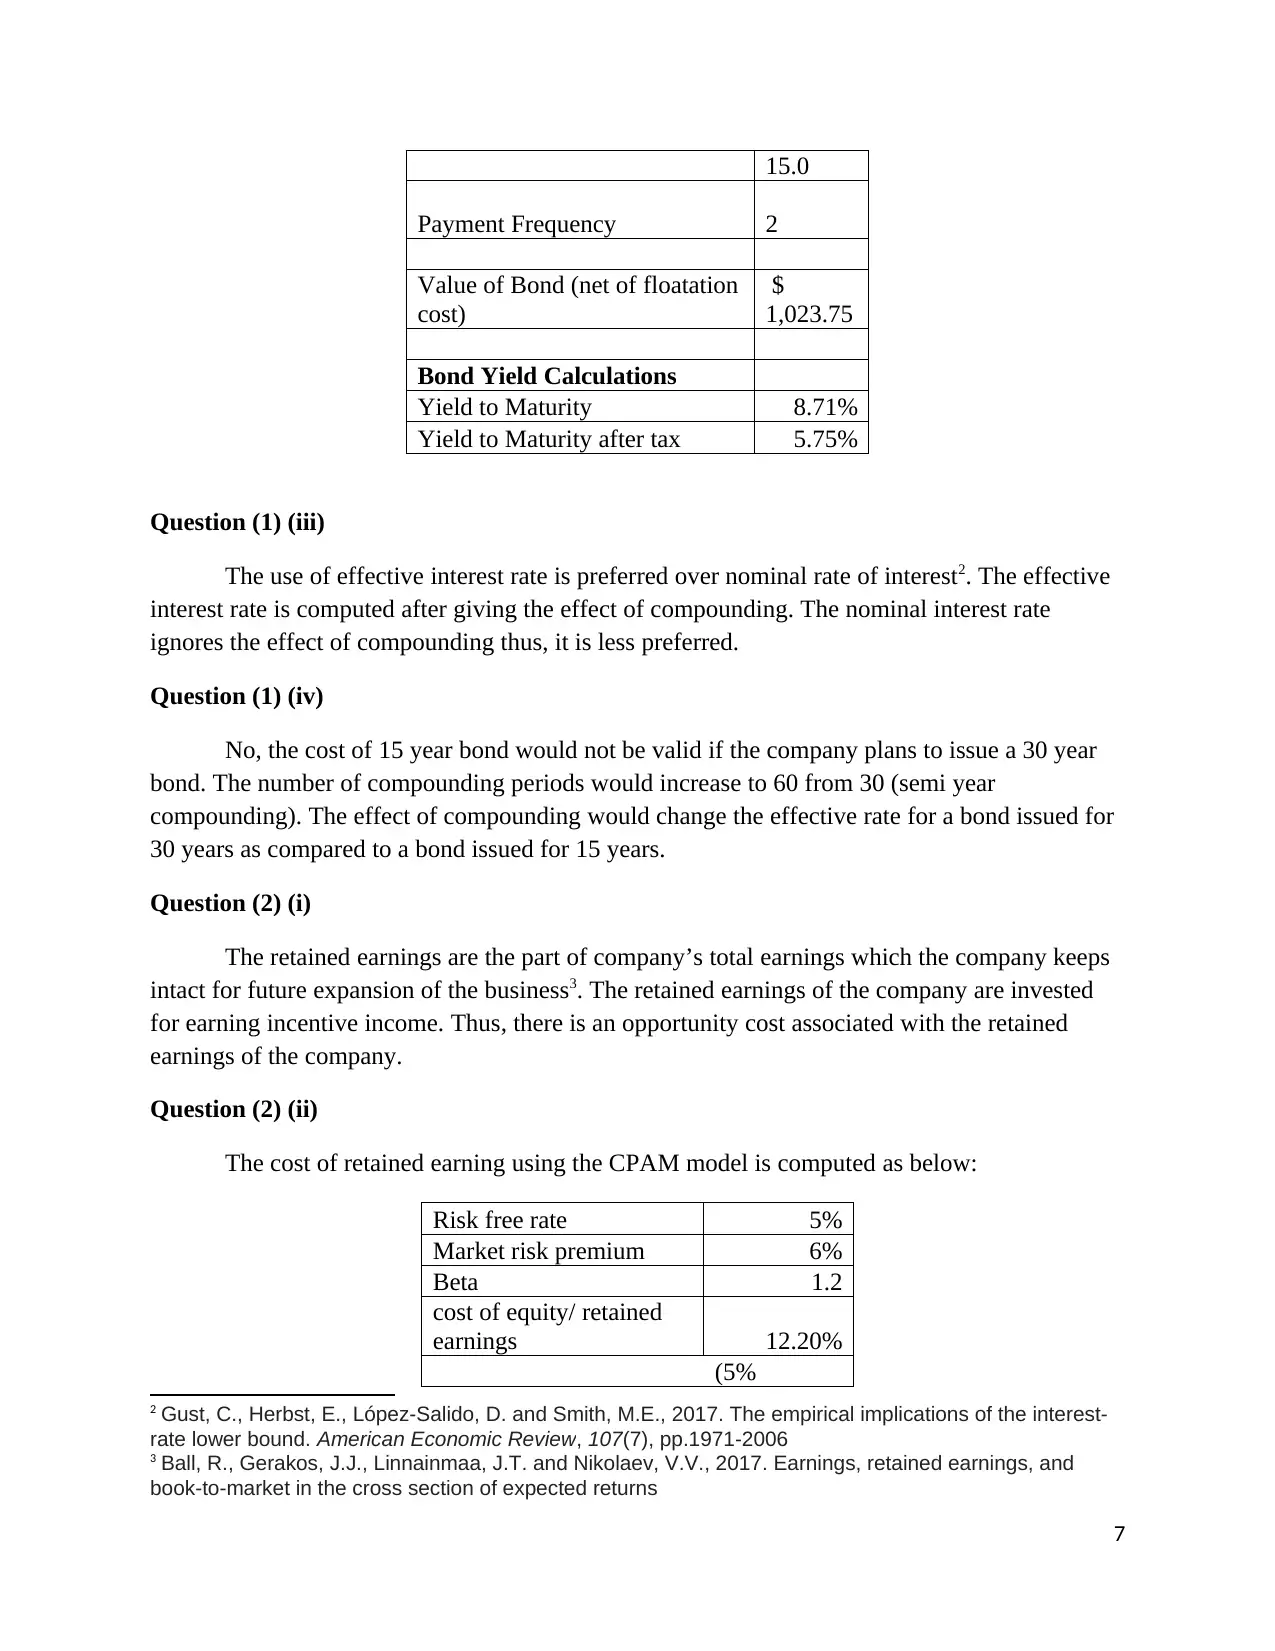
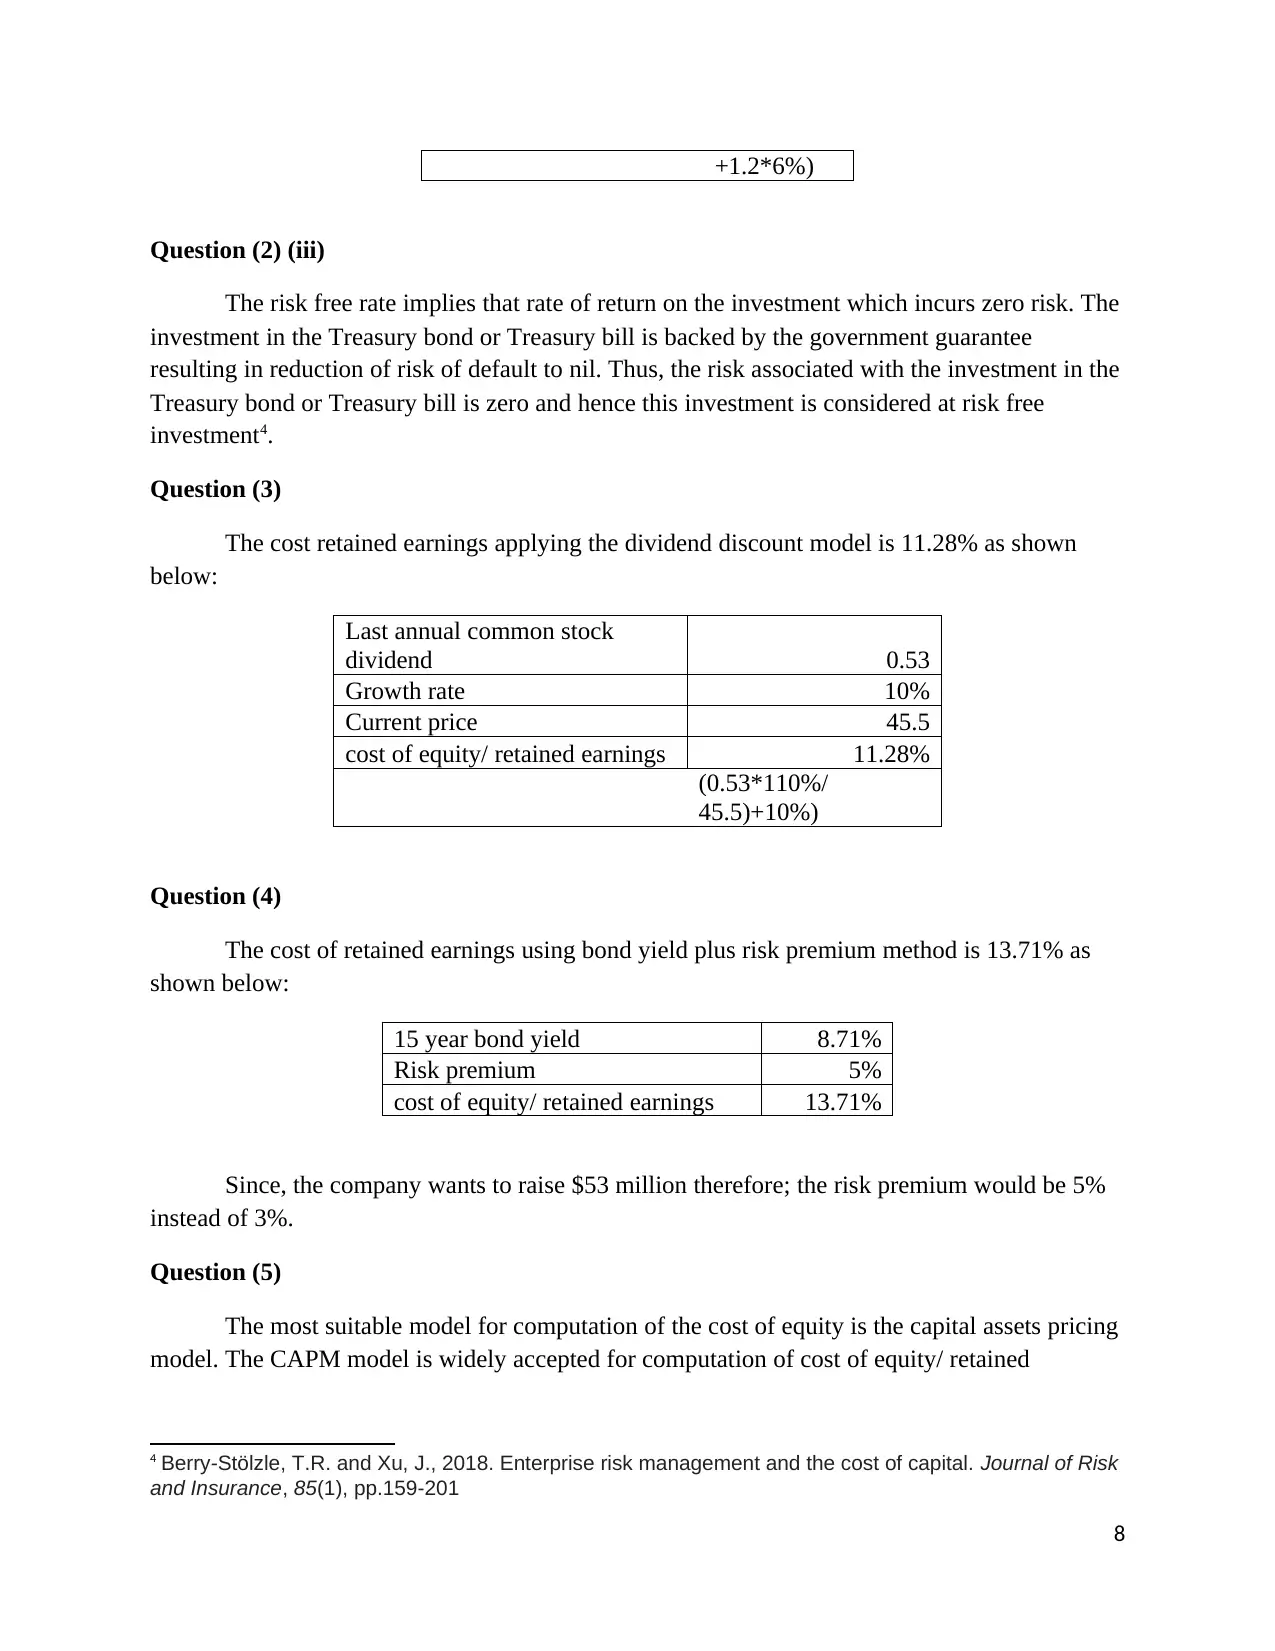
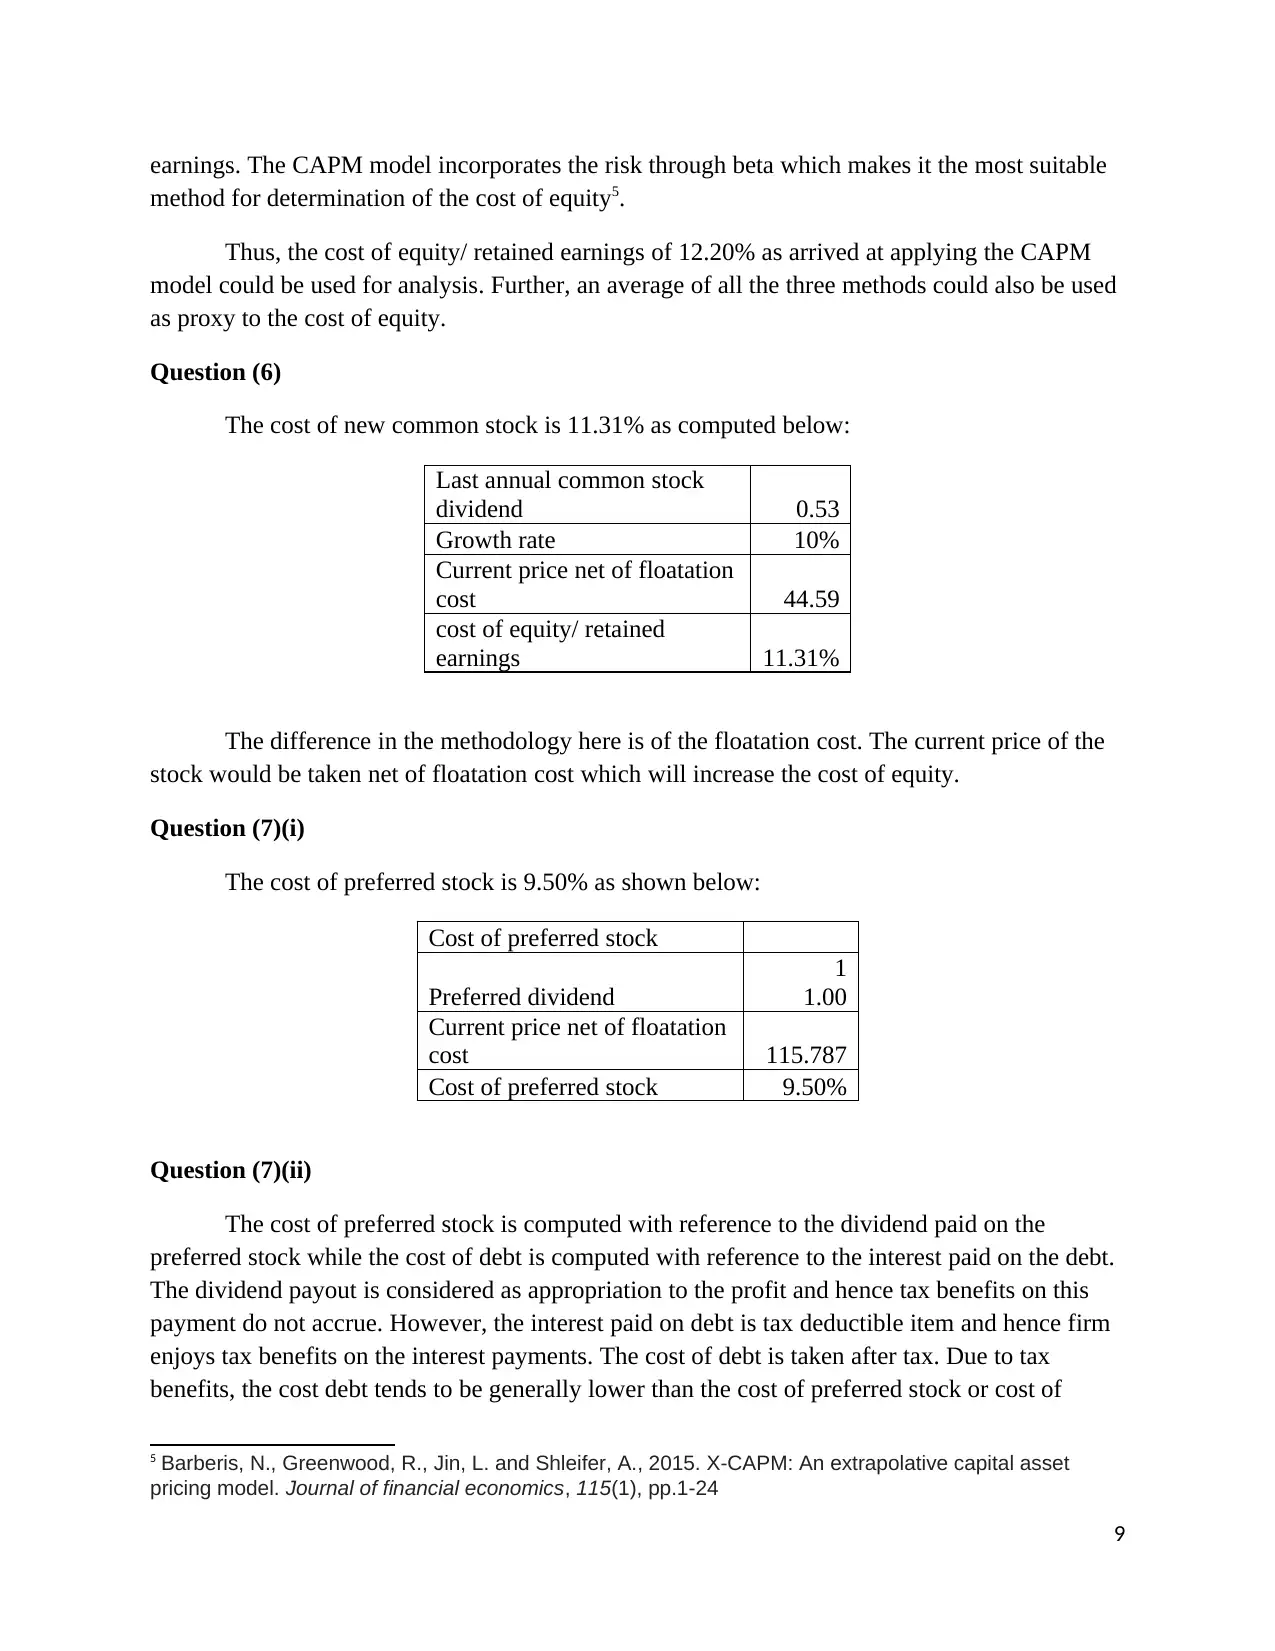
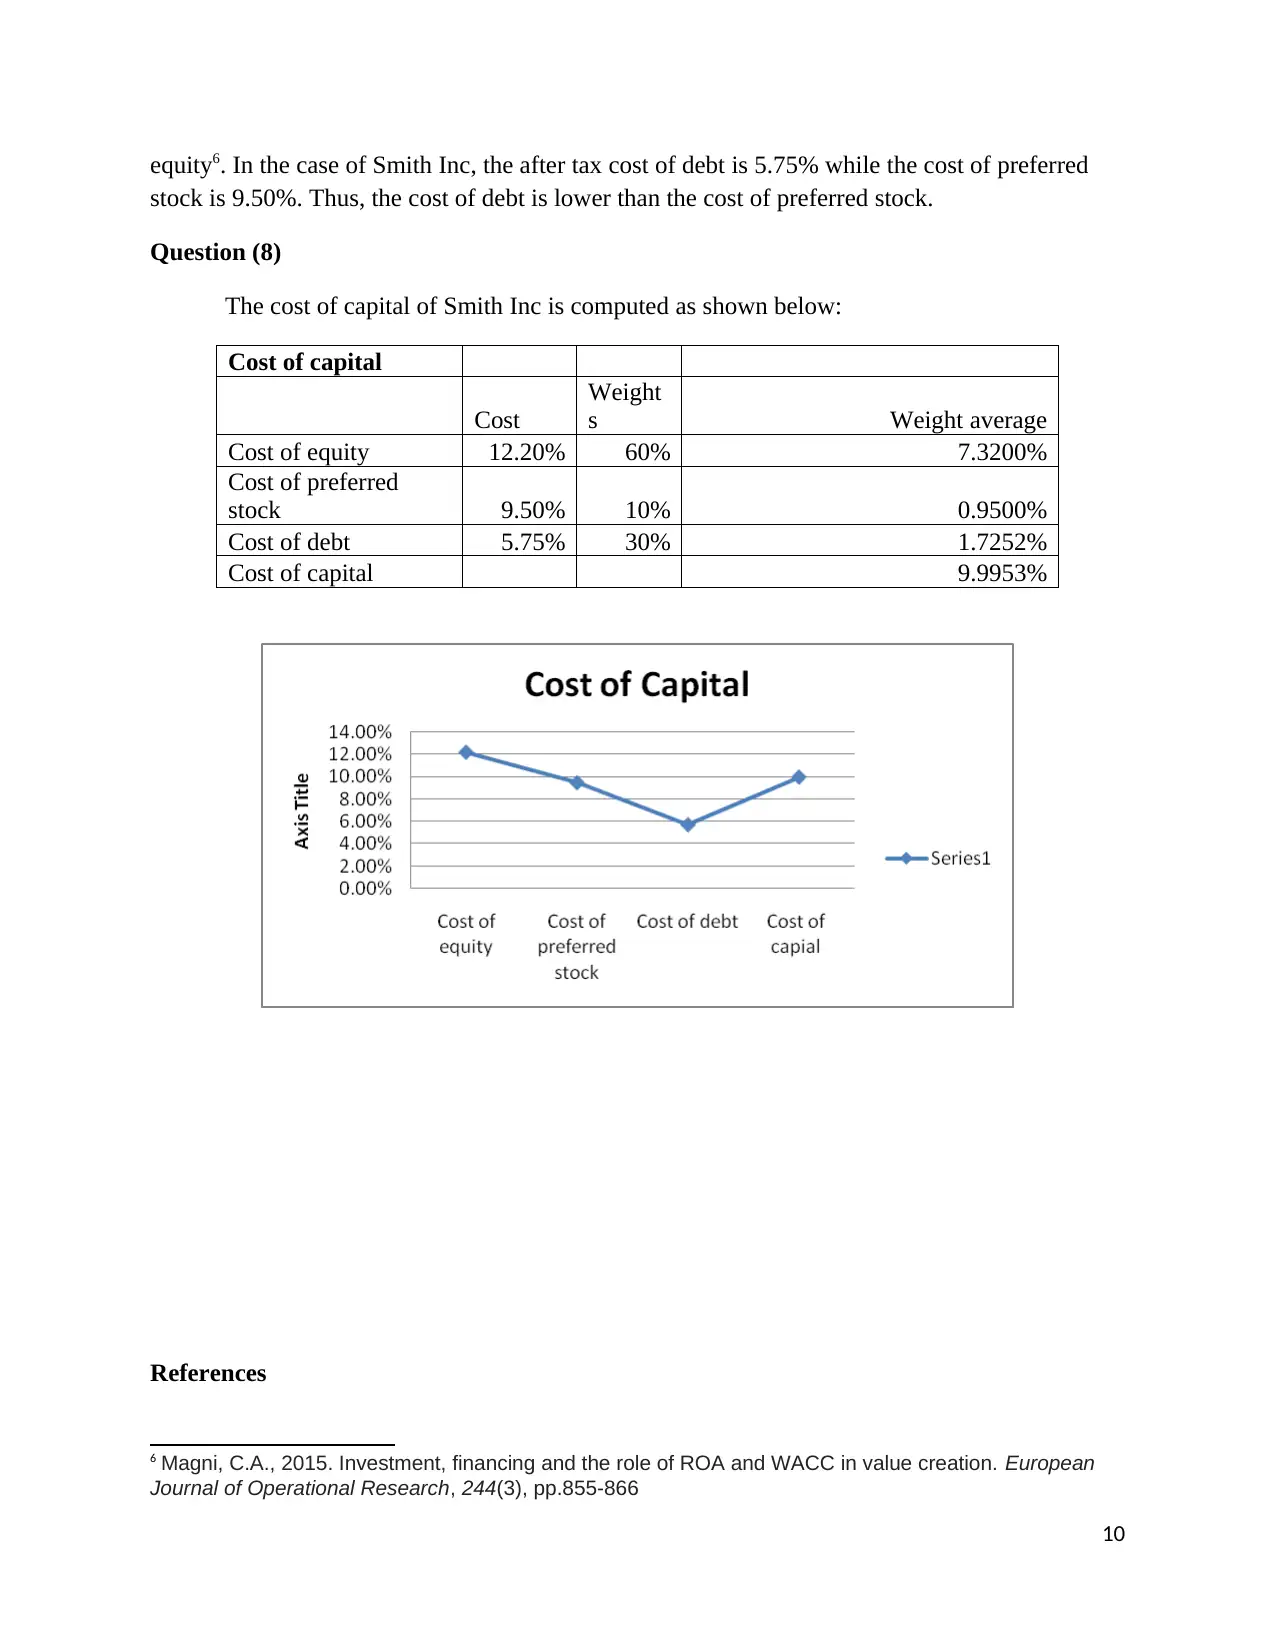
This case study presents a detailed financial analysis of Smith Inc., encompassing capital budgeting decisions and the calculation of the company's cost of capital. Part I of the case focuses on evaluating a potential project, calculating the initial outlay, operating cash flows, payback periods (both regular and discounted), Net Present Value (NPV), Internal Rate of Return (IRR), Modified Internal Rate of Return (MIRR), Profitability Index (PI), and providing recommendations based on these metrics. The analysis reveals that the project is not financially viable at the current bid price. Part II of the case delves into the cost of capital, examining the cost of debt, retained earnings (using CAPM, dividend discount model, and bond yield plus risk premium methods), and preferred stock. It also calculates the weighted average cost of capital (WACC) and the cost of new common stock, providing a comprehensive overview of Smith Inc.'s financial structure and decision-making processes, along with relevant references.
Document Page
Financial Management
1
tabler-icon-diamond-filled.svg

Secure Best Marks with AI Grader

Need help grading? Try our AI Grader for instant feedback on your assignments.
Document Page
Case part I
Requirement-1
Initial outlay
Production equipment cost 500000
Installation cost 22000
522000
Working capital
Increase raw material
inventories 218000
Increase accounts payable 165000
Increase accounts receivable -39000
344000
Total 866000
Operating Cash Flows
1 2 3 4 5 6
Revenues
875,000.0
0
875,000.
00
875,000.
00
875,000.
00
875,000.
00
875,000.
00
Annual production
Costs
(640,000.0
0)
(640,000.
00)
(640,000.
00)
(640,000.
00)
(640,000.
00)
(640,000.
00)
Depreciation
(87,000.00
)
(87,000.0
0)
(87,000.0
0)
(87,000.0
0)
(87,000.0
0)
(87,000.0
0)
Profit before tax
148,000.0
0
148,000.
00
148,000.
00
148,000.
00
148,000.
00
148,000.
00
Tax @34% 50,320.00
50,320.0
0
50,320.0
0
50,320.0
0
50,320.0
0
50,320.0
0
Profit after tax 97,680.00
97,680.0
0
97,680.0
0
97,680.0
0
97,680.0
0
97,680.0
0
Add: Depreciation 87,000.00
87,000.0
0
87,000.0
0
87,000.0
0
87,000.0
0
87,000.0
0
operating Cash flows 97,680.00
97,680.0
0
97,680.0
0
97,680.0
0
97,680.0
0
97,680.0
0
Working capital
344,000.
2
Document Page
00
Salvage value net of
tax (note-1)
68,904.0
0
Net cash flows 97,680.00
97,680.0
0
97,680.0
0
97,680.0
0
97,680.0
0
510,584.
00
Requirement-2
Payback period
0 1 2 3 4 5 6
Cash flows
(866,000.
00) 97,680.00
97,680.
00
97,680.
00
97,680.
00
97,680.
00
510,584.0
0
Cumulative
cash flows
(768,320.00
)
(670,64
0.00)
(572,96
0.00)
(475,28
0.00)
(377,60
0.00)
132,984.0
0
Payback
period 5.74 Years
Discounted Payback period
0 1 2 3 4 5 6
Discounted
Cash flows
(866,000.
00) 85,684.21
75,161.
59
65,931.
22
57,834.
40
50,731.
93
232,615.2
0
Cumulative
cash flows
(780,315.79
)
(705,15
4.20)
(639,22
2.98)
(581,38
8.58)
(530,65
6.65)
(298,041.
45)
Payback
period 6.00
More than
6 Years
Requirement 3
NPV of the project
0 1 2 3 4 5 6
Cash
flows
(866,000.0
0)
97,680.0
0
97,680.0
0
97,680.0
0
97,680.0
0
97,680.0
0 510,584.00
PAF
@14% 1.00 0.8772 0.7695 0.6750 0.5921 0.5194 0.4556
Present
value
(866,000.0
0)
85,684.2
1
75,161.5
9
65,931.2
2
57,834.4
0
50,731.9
3 232,615.20
3
Document Page
NPV
(298,041.4
5)
NPV profile for integer
rates between 2% and
30%
Discount
rate NPV
2% 47,794.70
3% 8,951.86
4% (27,624.04)
5% (62,091.08)
6% (94,594.73)
7% (125,269.04)
8% (154,237.55)
9% (181,614.31)
10% (207,504.59)
11% (232,005.72)
12% (255,207.72)
13% (277,193.90)
14% (298,041.45)
15% (317,821.94)
16% (336,601.75)
17% (354,442.52)
18% (371,401.52)
19% (387,531.99)
4
tabler-icon-diamond-filled.svg

Secure Best Marks with AI Grader

Need help grading? Try our AI Grader for instant feedback on your assignments.
Document Page
20% (402,883.46)
21% (417,502.05)
22% (431,430.74)
23% (444,709.56)
24% (457,375.89)
25% (469,464.60)
26% (481,008.27)
27% (492,037.34)
28% (502,580.29)
29% (512,663.76)
30% (522,312.69)
Requirement 4
IRR and MIRR of the project
0 1 2 3 4 5 6
Cash
flows
(866,000.0
0)
97,680.0
0
97,680.0
0
97,680.0
0
97,680.0
0
97,680.0
0 510,584.00
IRR 3%
MIRR 6%
Requirement 5
Profitability index
Present value of cash
inflows 567,958.55
Initial investment 866,000.00
Profitability index 0.66
5
Document Page
Requirement 6
The net present value of the project is -298,041.45 which shows that the project is not
profitable. The internal rate of return of the project is 3% which is quite lower than the cost of
capital of 14%. Further, the discounted payback period of the company is also more than the life
of the project i.e. 6 years. Thus, the project should not be accepted at the current bid price.
The company should increase its bid for the project. At the current bid price, the
company will incur loss.
Yes, the company is using correct required rate of return however, the company can use a
lower rate than 14%.
Case part II
Question (1) (i)
The cost of debt is 5.55% as shown below:
Face Value
$
1,000
Annual Coupon Rate 9.00%
Years to Maturity
15.
0
Payment Frequency 2
Value of Bond
$
1,050.00
Bond Yield Calculations
Yield to Maturity 8.41%
Yield to Maturity after tax 5.55%
Question (1) (ii)
Yes, the floatation cost should be included in the calculation of cost of debt1. The cost of
debt considering the floatation cost would be 5.75% as shown below:
Face Value
$
1,000
Annual Coupon Rate 9.00%
Years to Maturity
1 Frank, M.Z. and Shen, T., 2016. Investment and the weighted average cost of capital. Journal of
Financial Economics, 119(2), pp.300-315
6
Document Page
15.0
Payment Frequency 2
Value of Bond (net of floatation
cost)
$
1,023.75
Bond Yield Calculations
Yield to Maturity 8.71%
Yield to Maturity after tax 5.75%
Question (1) (iii)
The use of effective interest rate is preferred over nominal rate of interest2. The effective
interest rate is computed after giving the effect of compounding. The nominal interest rate
ignores the effect of compounding thus, it is less preferred.
Question (1) (iv)
No, the cost of 15 year bond would not be valid if the company plans to issue a 30 year
bond. The number of compounding periods would increase to 60 from 30 (semi year
compounding). The effect of compounding would change the effective rate for a bond issued for
30 years as compared to a bond issued for 15 years.
Question (2) (i)
The retained earnings are the part of company’s total earnings which the company keeps
intact for future expansion of the business3. The retained earnings of the company are invested
for earning incentive income. Thus, there is an opportunity cost associated with the retained
earnings of the company.
Question (2) (ii)
The cost of retained earning using the CPAM model is computed as below:
Risk free rate 5%
Market risk premium 6%
Beta 1.2
cost of equity/ retained
earnings 12.20%
(5%
2 Gust, C., Herbst, E., López-Salido, D. and Smith, M.E., 2017. The empirical implications of the interest-
rate lower bound. American Economic Review, 107(7), pp.1971-2006
3 Ball, R., Gerakos, J.J., Linnainmaa, J.T. and Nikolaev, V.V., 2017. Earnings, retained earnings, and
book-to-market in the cross section of expected returns
7
tabler-icon-diamond-filled.svg

Paraphrase This Document

Need a fresh take? Get an instant paraphrase of this document with our AI Paraphraser
Document Page
+1.2*6%)
Question (2) (iii)
The risk free rate implies that rate of return on the investment which incurs zero risk. The
investment in the Treasury bond or Treasury bill is backed by the government guarantee
resulting in reduction of risk of default to nil. Thus, the risk associated with the investment in the
Treasury bond or Treasury bill is zero and hence this investment is considered at risk free
investment4.
Question (3)
The cost retained earnings applying the dividend discount model is 11.28% as shown
below:
Last annual common stock
dividend 0.53
Growth rate 10%
Current price 45.5
cost of equity/ retained earnings 11.28%
(0.53*110%/
45.5)+10%)
Question (4)
The cost of retained earnings using bond yield plus risk premium method is 13.71% as
shown below:
15 year bond yield 8.71%
Risk premium 5%
cost of equity/ retained earnings 13.71%
Since, the company wants to raise $53 million therefore; the risk premium would be 5%
instead of 3%.
Question (5)
The most suitable model for computation of the cost of equity is the capital assets pricing
model. The CAPM model is widely accepted for computation of cost of equity/ retained
4 BerryStölzle, T.R. and Xu, J., 2018. Enterprise risk management and the cost of capital. Journal of Risk
and Insurance, 85(1), pp.159-201
8
Document Page
earnings. The CAPM model incorporates the risk through beta which makes it the most suitable
method for determination of the cost of equity5.
Thus, the cost of equity/ retained earnings of 12.20% as arrived at applying the CAPM
model could be used for analysis. Further, an average of all the three methods could also be used
as proxy to the cost of equity.
Question (6)
The cost of new common stock is 11.31% as computed below:
Last annual common stock
dividend 0.53
Growth rate 10%
Current price net of floatation
cost 44.59
cost of equity/ retained
earnings 11.31%
The difference in the methodology here is of the floatation cost. The current price of the
stock would be taken net of floatation cost which will increase the cost of equity.
Question (7)(i)
The cost of preferred stock is 9.50% as shown below:
Cost of preferred stock
Preferred dividend
1
1.00
Current price net of floatation
cost 115.787
Cost of preferred stock 9.50%
Question (7)(ii)
The cost of preferred stock is computed with reference to the dividend paid on the
preferred stock while the cost of debt is computed with reference to the interest paid on the debt.
The dividend payout is considered as appropriation to the profit and hence tax benefits on this
payment do not accrue. However, the interest paid on debt is tax deductible item and hence firm
enjoys tax benefits on the interest payments. The cost of debt is taken after tax. Due to tax
benefits, the cost debt tends to be generally lower than the cost of preferred stock or cost of
5 Barberis, N., Greenwood, R., Jin, L. and Shleifer, A., 2015. X-CAPM: An extrapolative capital asset
pricing model. Journal of financial economics, 115(1), pp.1-24
9
Document Page
equity6. In the case of Smith Inc, the after tax cost of debt is 5.75% while the cost of preferred
stock is 9.50%. Thus, the cost of debt is lower than the cost of preferred stock.
Question (8)
The cost of capital of Smith Inc is computed as shown below:
Cost of capital
Cost
Weight
s Weight average
Cost of equity 12.20% 60% 7.3200%
Cost of preferred
stock 9.50% 10% 0.9500%
Cost of debt 5.75% 30% 1.7252%
Cost of capital 9.9953%
References
6 Magni, C.A., 2015. Investment, financing and the role of ROA and WACC in value creation. European
Journal of Operational Research, 244(3), pp.855-866
10
tabler-icon-diamond-filled.svg

Secure Best Marks with AI Grader

Need help grading? Try our AI Grader for instant feedback on your assignments.
Document Page
Ball, R., Gerakos, J.J., Linnainmaa, J.T. and Nikolaev, V.V., 2017. Earnings, retained earnings,
and book-to-market in the cross section of expected returns
Barberis, N., Greenwood, R., Jin, L. and Shleifer, A., 2015. X-CAPM: An extrapolative capital
asset pricing model. Journal of financial economics, 115(1), pp.1-24
BerryStölzle, T.R. and Xu, J., 2018. Enterprise risk management and the cost of capital. Journal
of Risk and Insurance, 85(1), pp.159-201
Frank, M.Z. and Shen, T., 2016. Investment and the weighted average cost of capital. Journal of
Financial Economics, 119(2), pp.300-315
Gust, C., Herbst, E., López-Salido, D. and Smith, M.E., 2017. The empirical implications of the
interest-rate lower bound. American Economic Review, 107(7), pp.1971-2006
Magni, C.A., 2015. Investment, financing and the role of ROA and WACC in value
creation. European Journal of Operational Research, 244(3), pp.855-866
11
chevron_up_icon
1 out of 11
circle_padding
hide_on_mobile
zoom_out_icon
[object Object]