FIN200 Trimester 2 2018: SML, CML, Minimum Variance & CAPM Analysis

Verified

Added on  2023/06/08

|12
|958
|375
Report
AI Summary
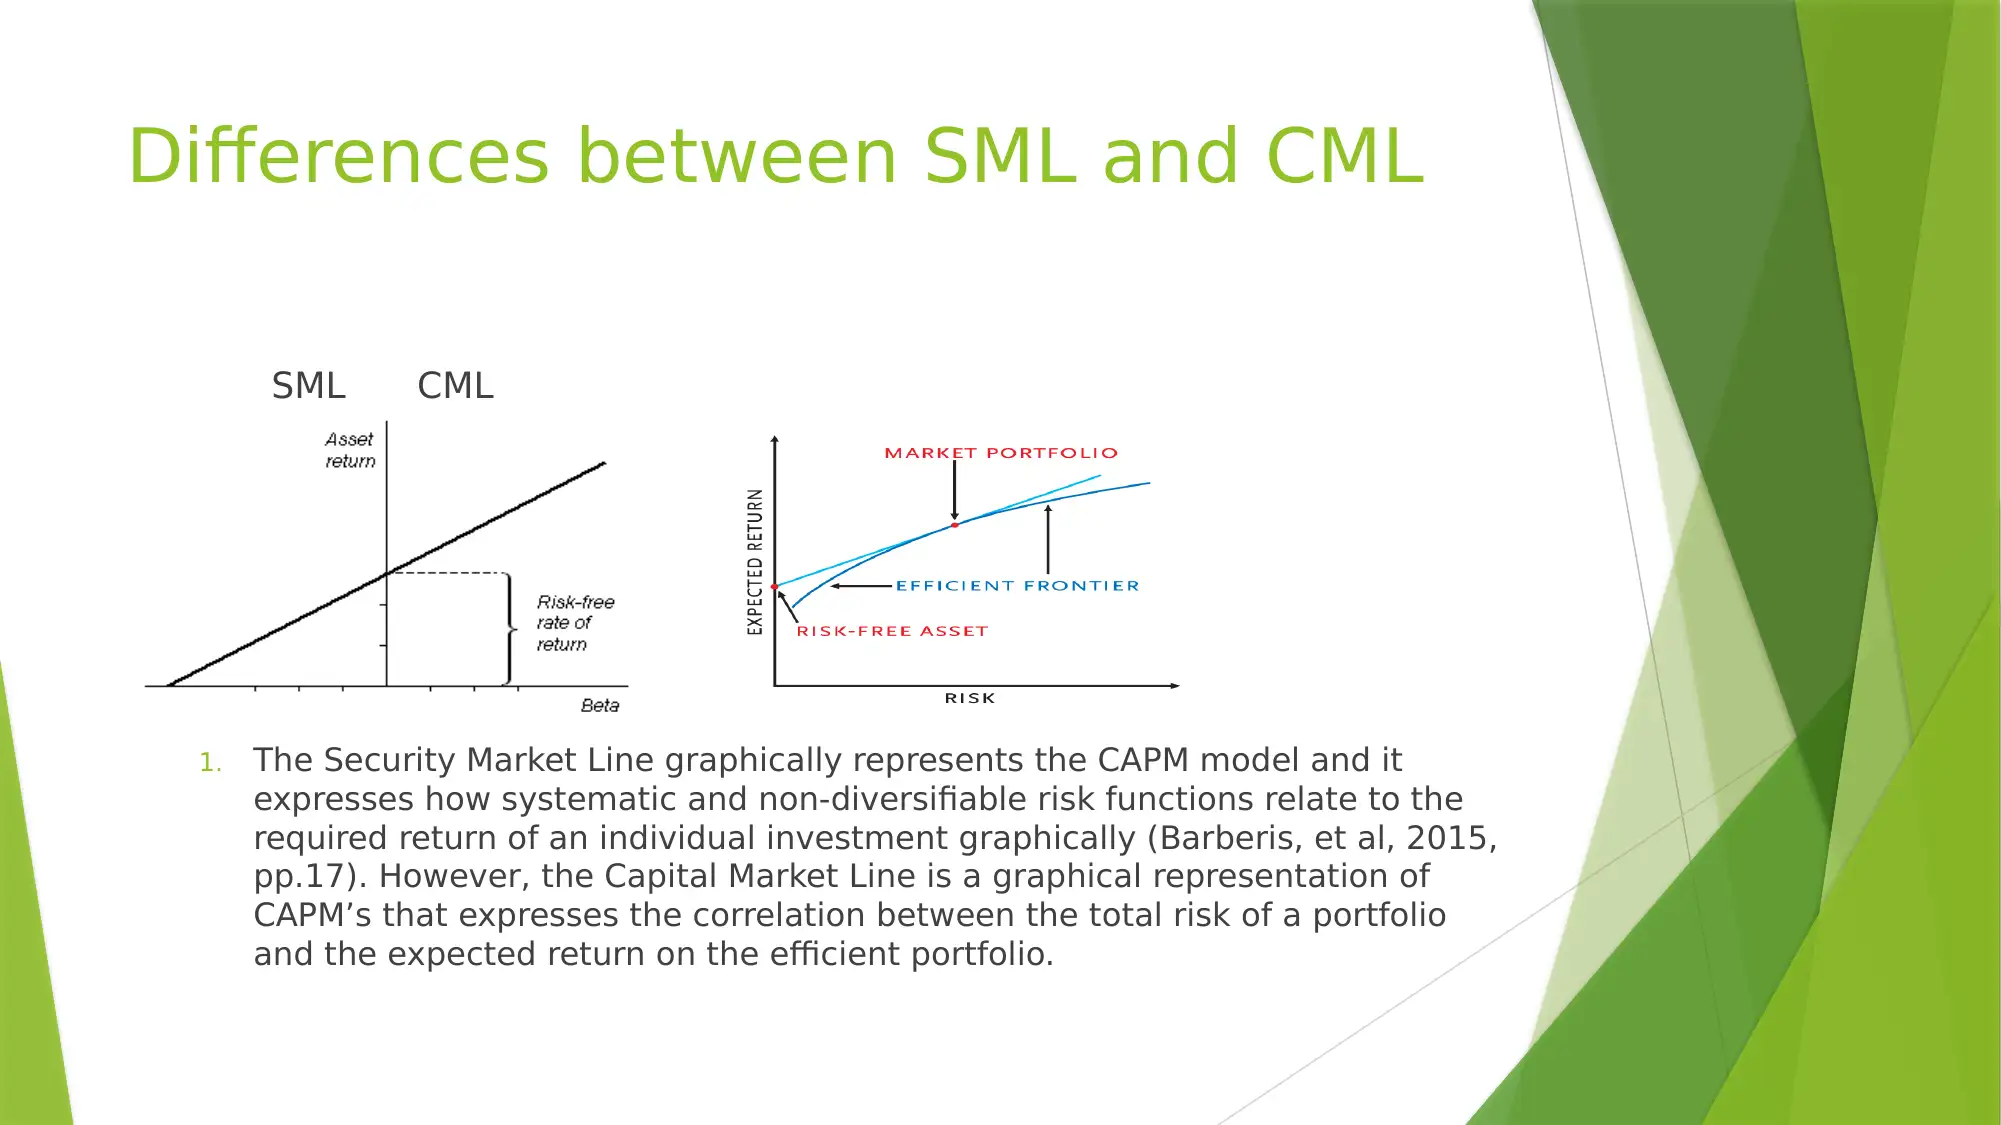
This report provides a comprehensive analysis of corporate financial management concepts, focusing on the Security Market Line (SML), Capital Market Line (CML), and the Capital Asset Pricing Model (CAPM). It elucidates the key differences between SML and CML, highlighting that SML graphically represents the CAPM model using beta to measure risk, while CML represents the correlation between total portfolio risk and expected return using standard deviation. The report also emphasizes the importance of minimum variance portfolios in minimizing price volatility and hedging against losses, especially given the difficulty in predicting future returns. Furthermore, it underscores the relevance of the CAPM equation in measuring the required rate of return on investment, citing its graphical representation, theoretical derivation, and explicit consideration of systematic risk compared to other models like the dividend growth model and WACC. The report concludes that CAPM offers a more relevant approach for assessing investment returns and managing risks in corporate finance.
tabler-icon-diamond-filled.svg

Contribute Materials

Your contribution can guide someone’s learning journey. Share your documents today.
Document Page
Corporate Financial
Management
tabler-icon-diamond-filled.svg

Secure Best Marks with AI Grader

Need help grading? Try our AI Grader for instant feedback on your assignments.
Document Page
Introduction
The Security Market Line represents the CAPM model. It is used to
draft both the systematic and the non-diversifiable risk that is
expresses as a beta sign within a specific period.
The Capital Market Line is a measure that is used to evaluate the
performance of a portfolio and its graph is used in the asset driving
model when calculating a portfolio’s rate of return.
The report addresses the differences between SML and CML,
importance of the minimum variance portfolios, and the relevancy of
the CAPM model.
Document Page
Differences between SML and CML
SML CML
1. The Security Market Line graphically represents the CAPM model and it
expresses how systematic and non-diversifiable risk functions relate to the
required return of an individual investment graphically (Barberis, et al, 2015,
pp.17). However, the Capital Market Line is a graphical representation of
CAPM’s that expresses the correlation between the total risk of a portfolio
and the expected return on the efficient portfolio.
Document Page
Cont.
2. The SML uses beta in measuring risk and it is applicable when
identifying the contribution of security risk to the portfolio while the
Capital Market Line uses the total risk factor or the standard deviation
when measuring risk.
3. The SML graph is used when defining the efficient and the non-
efficient portfolios while the Capital Market Line is a graph is used in
defining efficient portfolios.
tabler-icon-diamond-filled.svg

Secure Best Marks with AI Grader

Need help grading? Try our AI Grader for instant feedback on your assignments.
Document Page
Cont.
4. The security market line’s Y-axis indicates the individual asset’s
required level of return while the X-axis indicates the risk’s level that
is represented using a beta while the CML’s Y-axis shows the
expected return while the X-axis is used to express the risk’s level or
the standard deviation.
Document Page
Importance of Minimum Variance
Portfolios
The minimum risk portfolios is a portfolio of securities that when
combined, they minimize the overall price volatility of a portfolio.
Volatility is a statistical measure that is to measure movement in
prices of the prices of a particular security.
Investors opt for a risk-based approach because it is hard to measure
future returns (Behr, Guettler and Miebs, 2013, pp.1237). However, it
is much easier to measure risk.
Document Page
Cont.
The minimum variance portfolio is important to the investors because
it combines the either the low volatile investment or the volatile
investment that have low correlation to each other (Džaja and
Aljinović, 2013, pp.169).
By mixing a set of volatile securities that do not move with one
another gives the investor the opportunity to hedge against loss and
maximize on their earnings.
tabler-icon-diamond-filled.svg

Paraphrase This Document

Need a fresh take? Get an instant paraphrase of this document with our AI Paraphraser
Document Page
Relevancy of the CAPM Approach
The required rate of return (RRR)is the amount of profit necessary for
an investment to be carried out (Bolek, 2014, pp.7). RRR guides the
investors whether they should purchase an investment or not.
Besides defining the return of an investment, the required rate of
return also considers risk factors to determine the potential return.
Additionally, the required rate of return sets the minimum amount of
return that is acceptable by an investor
Document Page
Cont.
The CAPM equation is more relevant when measuring the required
rate of return on investment due to the following reasons:
1. It is CAPM’s graphical representation showing the relationship
between an individual securities’ required return as a systematic and
non-diversifiable risk function
2. CAPM is regarded as a relationship that is theoretically-derived
between the systematic risk that has been subject to frequent testing
and empirical research and the required return.
Document Page
Cont.
3. Compared to the dividend growth model, CAPM is considered to be a
better approach to calculate the cost of equity since it explicitly
considers the systematic risk level of a firm relative to the stock
market as a whole.
4. the CAPM model is clearly superior to the WACC model because it
provides discount rates that may be used in investment appraisal.
tabler-icon-diamond-filled.svg

Secure Best Marks with AI Grader

Need help grading? Try our AI Grader for instant feedback on your assignments.
Document Page
Conclusion
Specific differences exist between the SML and the CML. In the case
of CML uses the standard deviation to measure risk while the SML
uses beta to measure the risk.
The minimum variance portfolio is helps the investors to hedge
against risks by combining a set of securities which are volatile.
The CAPM approach is a more relevant approach in measuring the
required rate of return because it considers a company’s systematic
risks relative to the stock market.
Document Page
Bibliography
Barberis, N., Greenwood, R., Jin, L. and Shleifer, A., 2015. X-CAPM: An
extrapolative capital asset pricing model. Journal of financial
economics, 115(1), pp.1-24.
Behr, P., Guettler, A. and Miebs, F., 2013. On portfolio optimization:
Imposing the right constraints. Journal of Banking & Finance, 37(4),
pp.1232-1242.
Bolek, M., 2014. Return on current assets, working capital and
required rate of return on equity. e-Finanse: Financial Internet
Quarterly, 10(2), pp.1-10.
Džaja, J. and Aljinović, Z., 2013. Testing CAPM model on the emerging
markets of the Central and Southeastern Europe. Croatian
Operational Research Review, 4(1), pp.164-175.
chevron_up_icon
1 out of 12
circle_padding
hide_on_mobile
zoom_out_icon
logo.png

Your All-in-One AI-Powered Toolkit for Academic Success.

Available 24*7 on WhatsApp / Email

[object Object]