FIN200 Assignment: Exploring SML, CML, MVP, and CAPM Applications
VerifiedAdded on 2023/06/07
|11
|2494
|422
Report
AI Summary
This report provides a comprehensive analysis of key concepts in corporate financial management, focusing on the Security Market Line (SML), Capital Market Line (CML), Minimum Variance Portfolio (MVP), and Capital Asset Pricing Model (CAPM). It elucidates the distinctions between SML and CML, highlighting differences in risk measurement, efficiency assessment, and scope (single stock vs. portfolio). The report also emphasizes the significance of MVP in minimizing investment risk through optimal stock combinations and its role in shielding investors from market volatility. Furthermore, it explores the relevance of CAPM in determining the required rate of return, contrasting it with alternative models and discussing its advantages and limitations. The document concludes by underscoring how these financial tools can aid investors in making informed decisions to maximize returns while mitigating risk, all of which can be further explored through solved assignments and past papers available on Desklib.
Running head: CORPORATE FINANCIAL MANAGEMENT
Corporate Financial Management
Name of the Student:
Name of the University:
Authors Note:
Corporate Financial Management
Name of the Student:
Name of the University:
Authors Note:
Paraphrase This Document
Need a fresh take? Get an instant paraphrase of this document with our AI Paraphraser

CORPORATE FINANCIAL MANAGEMENT
1
Table of Contents
Introduction:...............................................................................................................................2
Indicating the alteration between SML and CML:....................................................................2
Exploring the significance of Minimum Variance Portfolio (MVP):........................................5
Exploring why CAPM calculation is used for identifying the required rate of return by
investors:....................................................................................................................................7
Conclusion:................................................................................................................................9
References:...............................................................................................................................10
CORPORATE FINANCIAL MANAGEMENT
2
Introduction:
The report aims in highlighting the different level of measure, which allows investors
to maximise the level of returns from investment. The difference between the SML and CML
line has mainly allowed the investors to identify the level of investment risk, which needs to
be evaluated before conducing investment decisions. Furthermore, the presence of minimum
variance portfolio has mainly allowed investors for raising the level of income from
investment, which reducing the level of risk hampering the portfolio. The calculations of
CAPM allow the investor for detecting the level of expected returns, which can be generated
from investment. However, there are certain level of methods, which are used by investors
instead of CAPM model for detecting the level of risk and returns.
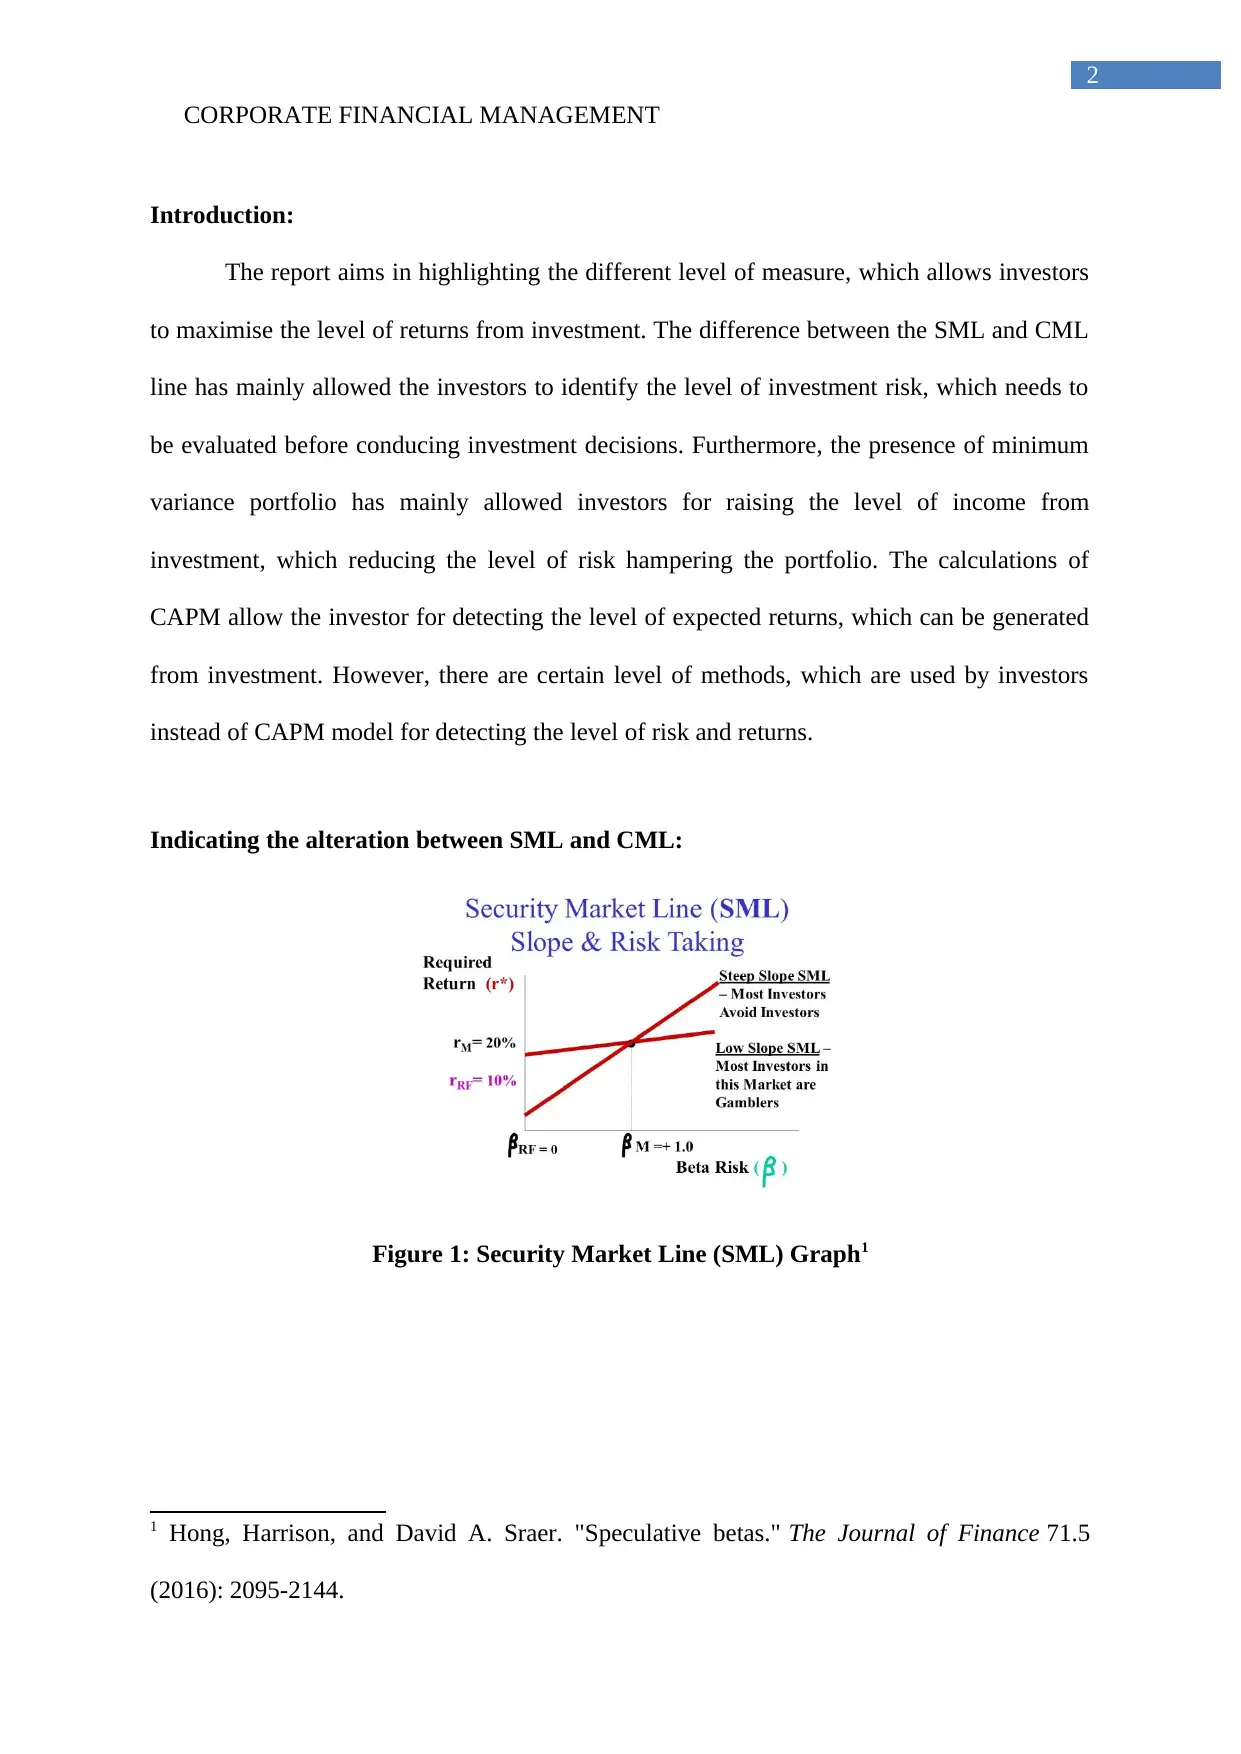
Indicating the alteration between SML and CML:
Figure 1: Security Market Line (SML) Graph1
1 Hong, Harrison, and David A. Sraer. "Speculative betas." The Journal of Finance 71.5
(2016): 2095-2144.
2
Introduction:
The report aims in highlighting the different level of measure, which allows investors
to maximise the level of returns from investment. The difference between the SML and CML
line has mainly allowed the investors to identify the level of investment risk, which needs to
be evaluated before conducing investment decisions. Furthermore, the presence of minimum
variance portfolio has mainly allowed investors for raising the level of income from
investment, which reducing the level of risk hampering the portfolio. The calculations of
CAPM allow the investor for detecting the level of expected returns, which can be generated
from investment. However, there are certain level of methods, which are used by investors
instead of CAPM model for detecting the level of risk and returns.
Indicating the alteration between SML and CML:
Figure 1: Security Market Line (SML) Graph1
1 Hong, Harrison, and David A. Sraer. "Speculative betas." The Journal of Finance 71.5
(2016): 2095-2144.
⊘ This is a preview!⊘
Do you want full access?
Subscribe today to unlock all pages.
Trusted by 1+ million students worldwide
CORPORATE FINANCIAL MANAGEMENT
3
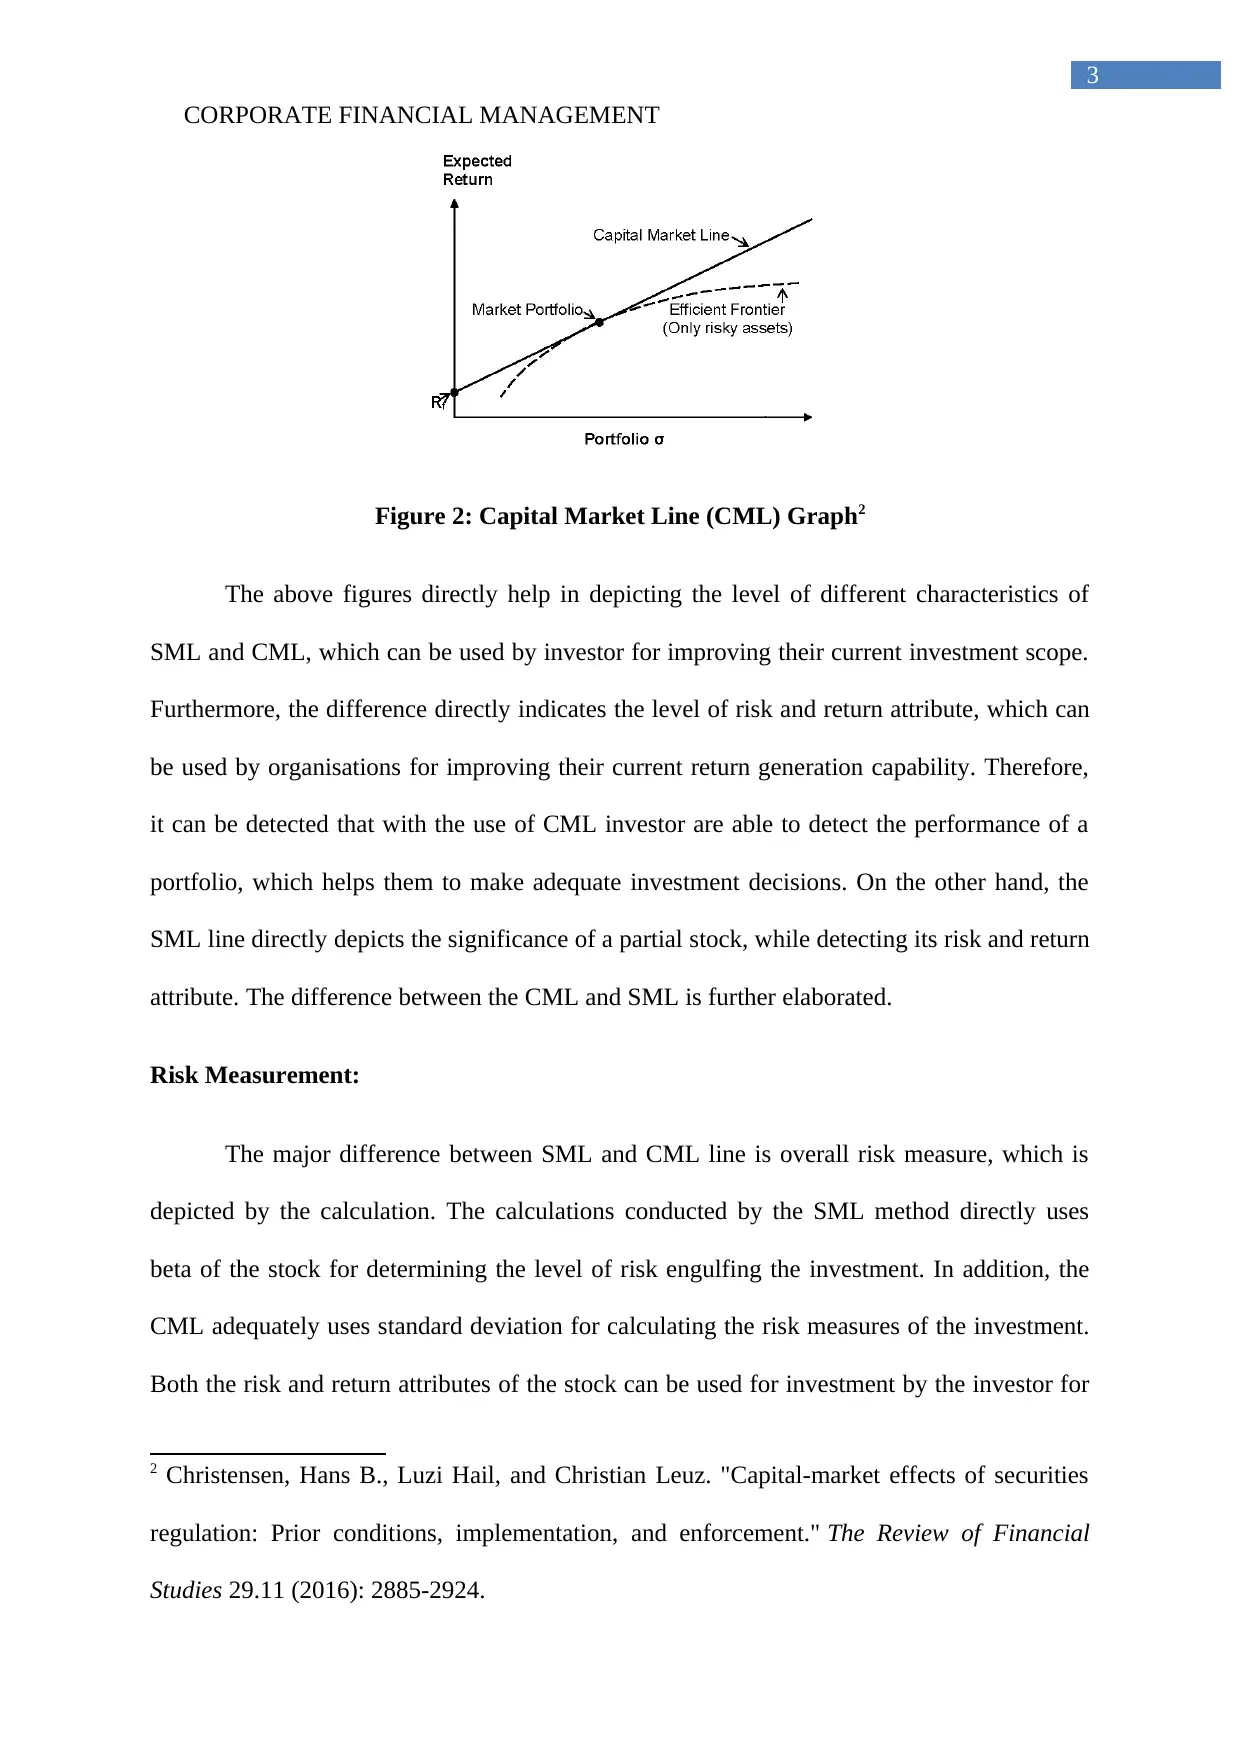
Figure 2: Capital Market Line (CML) Graph2
The above figures directly help in depicting the level of different characteristics of
SML and CML, which can be used by investor for improving their current investment scope.
Furthermore, the difference directly indicates the level of risk and return attribute, which can
be used by organisations for improving their current return generation capability. Therefore,
it can be detected that with the use of CML investor are able to detect the performance of a
portfolio, which helps them to make adequate investment decisions. On the other hand, the
SML line directly depicts the significance of a partial stock, while detecting its risk and return
attribute. The difference between the CML and SML is further elaborated.
Risk Measurement:
The major difference between SML and CML line is overall risk measure, which is
depicted by the calculation. The calculations conducted by the SML method directly uses
beta of the stock for determining the level of risk engulfing the investment. In addition, the
CML adequately uses standard deviation for calculating the risk measures of the investment.
Both the risk and return attributes of the stock can be used for investment by the investor for
2 Christensen, Hans B., Luzi Hail, and Christian Leuz. "Capital-market effects of securities
regulation: Prior conditions, implementation, and enforcement." The Review of Financial
Studies 29.11 (2016): 2885-2924.
3
Figure 2: Capital Market Line (CML) Graph2
The above figures directly help in depicting the level of different characteristics of
SML and CML, which can be used by investor for improving their current investment scope.
Furthermore, the difference directly indicates the level of risk and return attribute, which can
be used by organisations for improving their current return generation capability. Therefore,
it can be detected that with the use of CML investor are able to detect the performance of a
portfolio, which helps them to make adequate investment decisions. On the other hand, the
SML line directly depicts the significance of a partial stock, while detecting its risk and return
attribute. The difference between the CML and SML is further elaborated.
Risk Measurement:
The major difference between SML and CML line is overall risk measure, which is
depicted by the calculation. The calculations conducted by the SML method directly uses
beta of the stock for determining the level of risk engulfing the investment. In addition, the
CML adequately uses standard deviation for calculating the risk measures of the investment.
Both the risk and return attributes of the stock can be used for investment by the investor for
2 Christensen, Hans B., Luzi Hail, and Christian Leuz. "Capital-market effects of securities
regulation: Prior conditions, implementation, and enforcement." The Review of Financial
Studies 29.11 (2016): 2885-2924.
Paraphrase This Document
Need a fresh take? Get an instant paraphrase of this document with our AI Paraphraser
CORPORATE FINANCIAL MANAGEMENT
4
generating high level of investment. Some researcher mentioned that investors could use both
the CML and SML method for detecting the risk attributes of an investment, which can
generate high level of income from investment. Therefore, the different risk measures used
by both the method can be confirmed as their major difference.
Efficient and non-efficient:
The output generated by both SML and CML has different level efficiency, which can
help in making adequate decision regarding investment. Furthermore, the calculation of CML
line directly depicts the efficient portfolio, which can be used by investor for creating an
adequate investment portfolio. Therefore, the identified efficient portfolio can eventually
allow the investor to improve the level of income from investment, while reducing the total
risk attributes. On the other hand, the SML line directly depicts both efficient and non-
efficient portfolio, which can be used by investors for detecting the risk and return attributes
of the investment scope.
Portfolio Vs Stock:
The third difference that can be identified for SML and CML is the composition
returns, which can be generated from investment. The SML method actually evaluates a
single stock, where the returns and risk attribute are identified. On the other hand, the CML
method directly utilizes a total portfolio, which can help in detecting the level of risk and
return attribute. Therefore, from the evaluation it can be detected that investor can use the
measure for improving their current financial performance and detect the level of risk from
investment. Hence, investors can use the measure for detecting the level of risk and returns
for a particular stock, which is detected from the method of SML method. Thus, investors can
use CML method for adequately detecting the level of risk and return attributes of a portfolio.
CORPORATE FINANCIAL MANAGEMENT
5
Exploring the significance of Minimum Variance Portfolio (MVP):
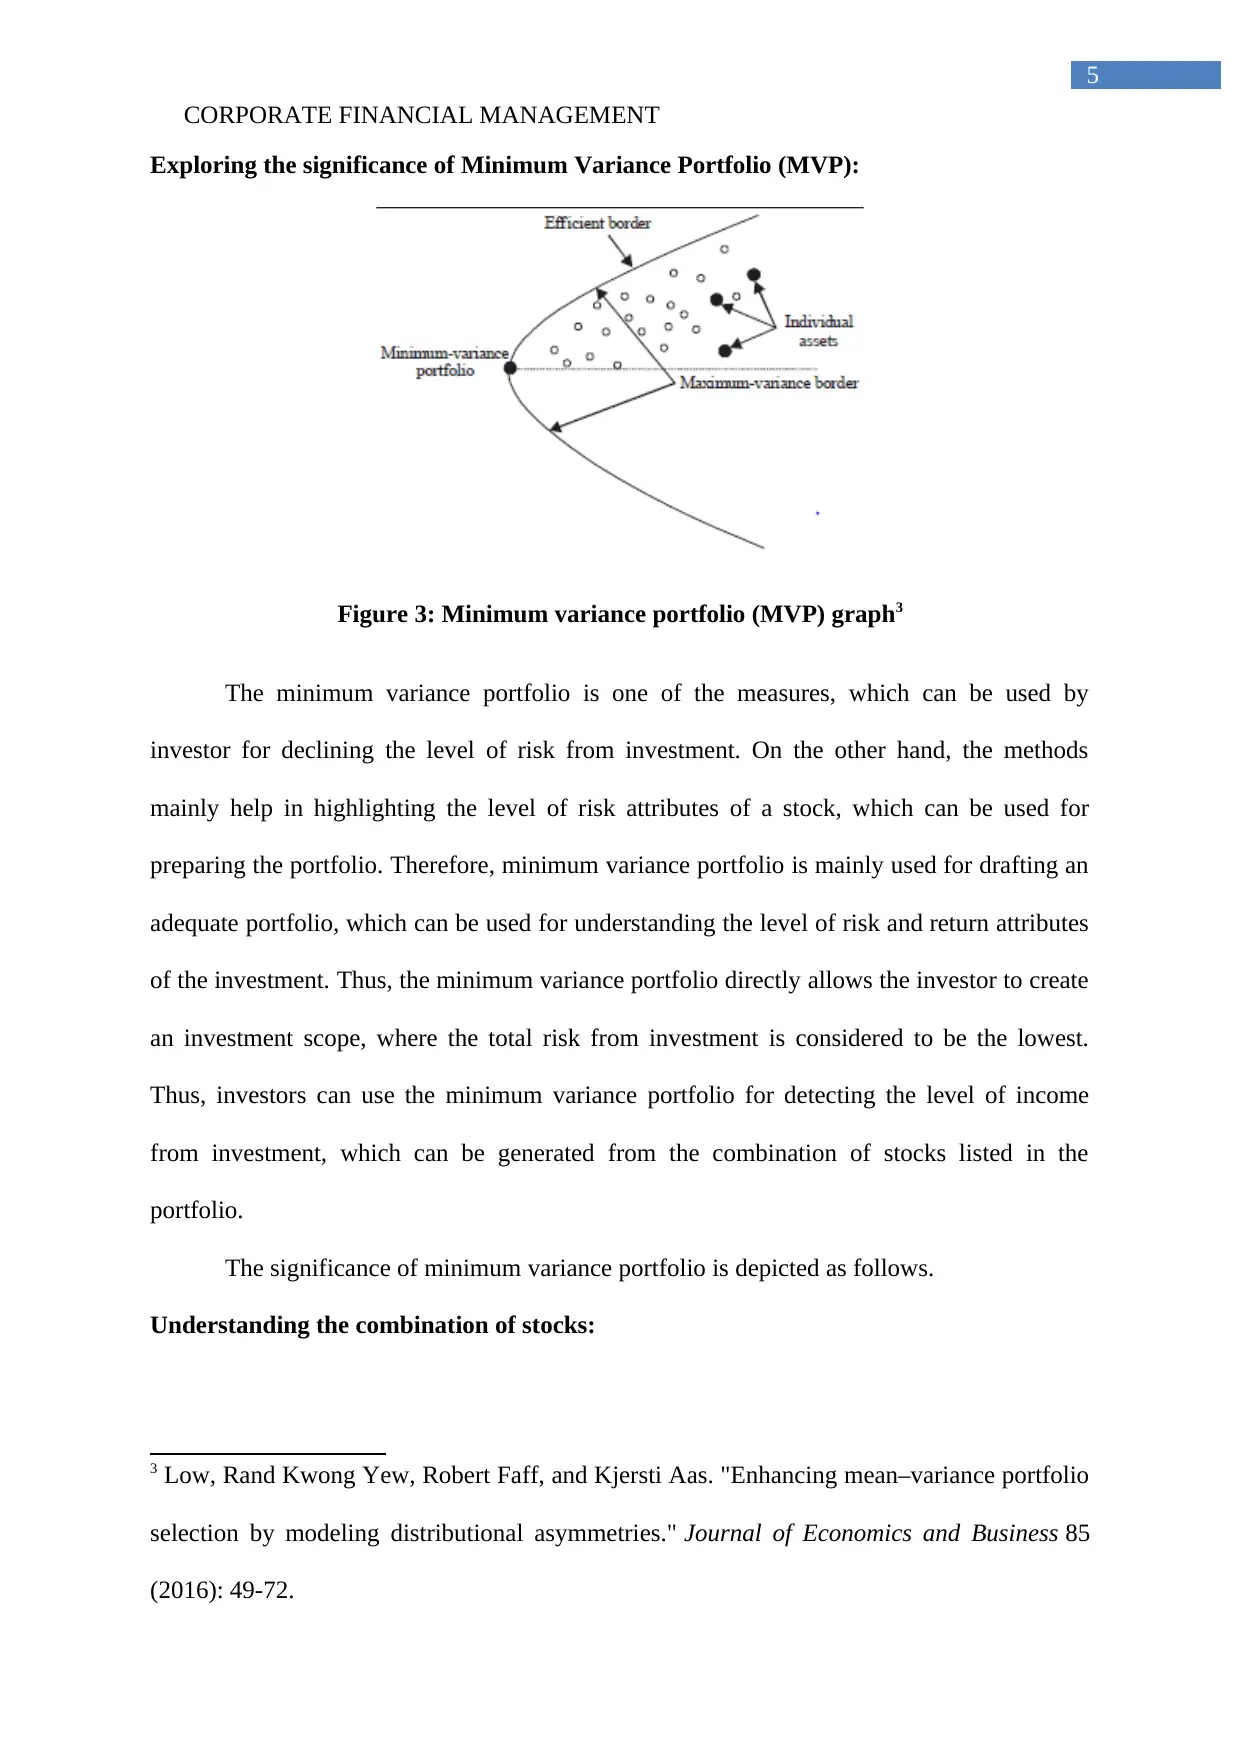
Figure 3: Minimum variance portfolio (MVP) graph3
The minimum variance portfolio is one of the measures, which can be used by
investor for declining the level of risk from investment. On the other hand, the methods
mainly help in highlighting the level of risk attributes of a stock, which can be used for
preparing the portfolio. Therefore, minimum variance portfolio is mainly used for drafting an
adequate portfolio, which can be used for understanding the level of risk and return attributes
of the investment. Thus, the minimum variance portfolio directly allows the investor to create
an investment scope, where the total risk from investment is considered to be the lowest.
Thus, investors can use the minimum variance portfolio for detecting the level of income
from investment, which can be generated from the combination of stocks listed in the
portfolio.
The significance of minimum variance portfolio is depicted as follows.
Understanding the combination of stocks:
3 Low, Rand Kwong Yew, Robert Faff, and Kjersti Aas. "Enhancing mean–variance portfolio
selection by modeling distributional asymmetries." Journal of Economics and Business 85
(2016): 49-72.
5
Exploring the significance of Minimum Variance Portfolio (MVP):
Figure 3: Minimum variance portfolio (MVP) graph3
The minimum variance portfolio is one of the measures, which can be used by
investor for declining the level of risk from investment. On the other hand, the methods
mainly help in highlighting the level of risk attributes of a stock, which can be used for
preparing the portfolio. Therefore, minimum variance portfolio is mainly used for drafting an
adequate portfolio, which can be used for understanding the level of risk and return attributes
of the investment. Thus, the minimum variance portfolio directly allows the investor to create
an investment scope, where the total risk from investment is considered to be the lowest.
Thus, investors can use the minimum variance portfolio for detecting the level of income
from investment, which can be generated from the combination of stocks listed in the
portfolio.
The significance of minimum variance portfolio is depicted as follows.
Understanding the combination of stocks:
3 Low, Rand Kwong Yew, Robert Faff, and Kjersti Aas. "Enhancing mean–variance portfolio
selection by modeling distributional asymmetries." Journal of Economics and Business 85
(2016): 49-72.
⊘ This is a preview!⊘
Do you want full access?
Subscribe today to unlock all pages.
Trusted by 1+ million students worldwide
CORPORATE FINANCIAL MANAGEMENT
6
The major significance of minimum variance portfolio is creating an adequate
combination of stocks, which can portray low risk and high returns. In addition, the method
adequately segregates stocks on the basis of risk and return attributes. This calculation also
helps in detecting the combination of different weights, which can be used for investment
purposes. Therefore, it indicates that the use of diversified stocks in a portfolio allow investor
to segregate the investment and maximize the level of income from investment.
Understanding the low risk attributes of investment:
The minimum variance portfolio calculation also helps investor in making adequate
investment ion certain stocks, which reduce the overall risk attributes. This reduction in risk
attributes would eventually allow the investor to maximize the level of income that can be
generated from the specified risk attribute. Therefore, the lowest risk depicted by the
portfolio is taken into consideration by the investor, while making the adequate investment
decisions. The detection of adequate risk and return of a stock directly allows the investor to
formulate an adequate investment decision and maximize the level of returns.
Helping the investor for shielding against capital market movement:
The minimum variance portfolio also helps in shielding the investors against the
volatile capital market movement, which directly secures the investor against negative price
movement. The formulated portfolio also allows the investor to maximize the level of
income, which can be obtained from investment. Therefore, the investor can effectively
improve the level of returns from their investment with the help of Minimum variance
portfolio.
Creating an accurate portfolio for investment:
The minimum variance portfolio also ensures the investor to create an accurate
portfolio for investment, which does not have high risk, while generates adequate returns.
The minimum variance portfolio lists the combination of stock and the weights needed in the
Paraphrase This Document
Need a fresh take? Get an instant paraphrase of this document with our AI Paraphraser
CORPORATE FINANCIAL MANAGEMENT
7
portfolio adequately. Therefore, it can be assured that investor can use the measure for
selecting the combination of low risk and high-risk securities for generating high level of
income. Hence, the creation of minimum variance portfolio supports conservative investors
to maximize the level of income, while reducing the total risk attributes of the exposure.
Exploring why CAPM calculation is used for identifying the required rate of return by
investors:
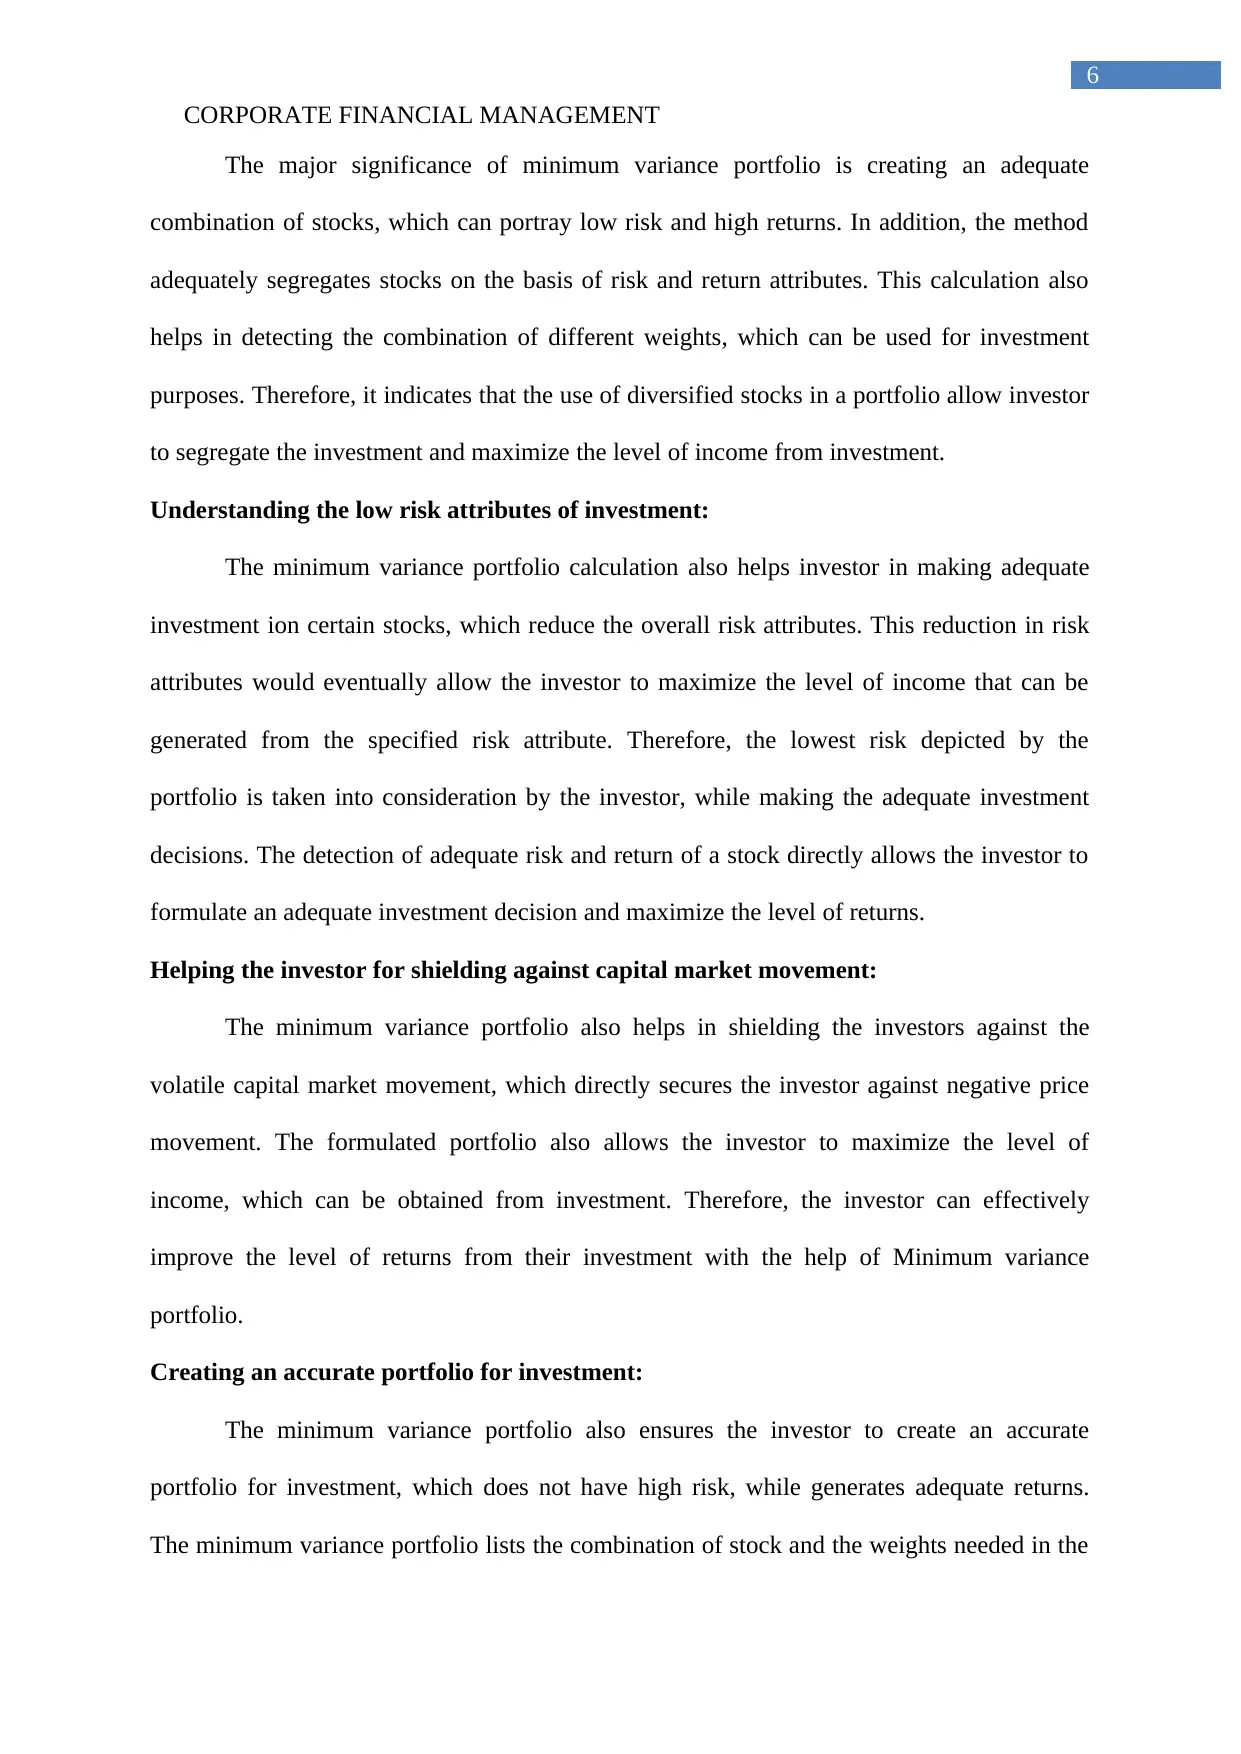
Figure 4: Capital Asset Pricing Model (CAPM)4
The formula of CAPM method is directly depicted in the above figure, which depicts
the level of minimum returns that can be generated from an investment. The investors for
detecting the expected returns from a particular stock directly use the CAPM model.
Furthermore, the valuation also utilizes the risk-free rate, risk premium and beta of the stock
to determine the minimum expected returns of an investment. CAPM model directly acts on
the beta level of a particular stock, where the rising risk level would push forward the
expected return of the stock. Therefore, it could be understood that investors use the CAPM
method for analyzing the expected return on the basis of risk factors that is affecting the price
structure of the stock. On the contrary, argued that the assumptions needed by CAPM model
relatively increases the reliability of the expected returns that has been calculated for a
4 Mackaya, Will, and Tariq Haque. "A study of industry cost of equity in Australia using the
Fama and French 5 Factor model and the Capital Asset Pricing Model (CAPM): A
pitch." Accounting and Management Information Systems 15.3 (2016): 618.
7
portfolio adequately. Therefore, it can be assured that investor can use the measure for
selecting the combination of low risk and high-risk securities for generating high level of
income. Hence, the creation of minimum variance portfolio supports conservative investors
to maximize the level of income, while reducing the total risk attributes of the exposure.
Exploring why CAPM calculation is used for identifying the required rate of return by
investors:
Figure 4: Capital Asset Pricing Model (CAPM)4
The formula of CAPM method is directly depicted in the above figure, which depicts
the level of minimum returns that can be generated from an investment. The investors for
detecting the expected returns from a particular stock directly use the CAPM model.
Furthermore, the valuation also utilizes the risk-free rate, risk premium and beta of the stock
to determine the minimum expected returns of an investment. CAPM model directly acts on
the beta level of a particular stock, where the rising risk level would push forward the
expected return of the stock. Therefore, it could be understood that investors use the CAPM
method for analyzing the expected return on the basis of risk factors that is affecting the price
structure of the stock. On the contrary, argued that the assumptions needed by CAPM model
relatively increases the reliability of the expected returns that has been calculated for a
4 Mackaya, Will, and Tariq Haque. "A study of industry cost of equity in Australia using the
Fama and French 5 Factor model and the Capital Asset Pricing Model (CAPM): A
pitch." Accounting and Management Information Systems 15.3 (2016): 618.
CORPORATE FINANCIAL MANAGEMENT
8
particular stock. However, it can be understood that due to the simplicity of CAPM
calculation investors are able to evaluate the current trajectory of the stock and understand the
level of returns that it could provide.
CAPM is considered to be a single Factor Model, which does not evaluate different
attributes of a particular stock. This is the main reason where different models have been
created, which can be used for detecting the return attributes of a particular stock. The major
alternatives to the CAPM model is the multi beta models, market price based model, and
accounting information based models, which are used by investors for analyzing the risk
attributes of a particular stock. However, the above depicted models relatively uses and
calculations which needs to be conducted by the investor to derive the expected return of a
particular stock. Nevertheless, the CAPM model does not force the investor to use hand
calculations for deriving a particular expected return of a stock, which reduces the excessive
work that needs to be conducted by the investor.
There are certain significance and limitations of CAPM model, which are depicted as
follows.
The major significance of CAPM is its Ease of use:
The reduction in complexity of the CAPM model has a relatively helped the equation
to be favorite of investors for a long duration. Investors have been using the model for
calculating the expected returns, where only the beta, market returns, and risk free rate is
needed for deriving the minimum returns that needs to be provided by the particular stock.
The easy calculation that is conducted by CAPM has mainly motivated the investors to utilize
the model for deriving the expected returns of the selected stocks.
The limitation of wide range of assumptions:
⊘ This is a preview!⊘
Do you want full access?
Subscribe today to unlock all pages.
Trusted by 1+ million students worldwide
CORPORATE FINANCIAL MANAGEMENT
9
However, there are certain limitations of the CAPM model, which relatively reduces
the reliability of the equation in delivering adequate expected returns of the stock. The
assumption that is made by the model is relatively unrealistic, as the accurate risk-free rate
and market returns cannot be determined for a particular stock. Furthermore, the equation is
relatively considered to be a single period model where it only provides the year and Returns
and does not evaluate the Future growth of the stock. However, the arbitrage pricing theory is
a relatively developed for overcoming the weaknesses of CAPM model, which can be used
by investors to detect more realistic output of the stock.
Conclusion:
The assessment directly helps in detecting the significance of an adequate portfolio
creation, which can be conducted with the help of minimum variance portfolio, capital
market line, security market line, and Capital Asset pricing model. The combination of the
above theories would eventually allow the investors to detect the adequate investment scope,
which might have low risk from investment. The further evaluation of capital market line and
security market line directly indicates that investors can use the measures to analyze a
particular stock or a Portfolio for generating high level of income from investment. Currently
investors use Capital Asset pricing model for detecting the expected returns of a particular
stock, which is essential in understanding the level of risk and return attributes of an
investment. Lastly, with the help of minimum variance portfolio investors are able to create
an adequate investment scope, which has the lowest risk possible with a certified amount of
return from investment.
Paraphrase This Document
Need a fresh take? Get an instant paraphrase of this document with our AI Paraphraser
CORPORATE FINANCIAL MANAGEMENT
10
References:
Hong, Harrison, and David A. Sraer. "Speculative betas." The Journal of Finance 71.5
(2016): 2095-2144.
Christensen, Hans B., Luzi Hail, and Christian Leuz. "Capital-market effects of securities
regulation: Prior conditions, implementation, and enforcement." The Review of Financial
Studies 29.11 (2016): 2885-2924.
Low, Rand Kwong Yew, Robert Faff, and Kjersti Aas. "Enhancing mean–variance portfolio
selection by modeling distributional asymmetries." Journal of Economics and Business 85
(2016): 49-72.
Mackaya, Will, and Tariq Haque. "A study of industry cost of equity in Australia using the
Fama and French 5 Factor model and the Capital Asset Pricing Model (CAPM): A
pitch." Accounting and Management Information Systems 15.3 (2016): 618.
1 out of 11
Related Documents


Your All-in-One AI-Powered Toolkit for Academic Success.
+13062052269
info@desklib.com
Available 24*7 on WhatsApp / Email
![[object Object]](/_next/static/media/star-bottom.7253800d.svg)
Unlock your academic potential
Copyright © 2020–2026 A2Z Services. All Rights Reserved. Developed and managed by ZUCOL.