Public Health Study: Analyzing Smoking's Link to Lung Cancer

Verified

Added on  2022/11/17

|4
|632
|420
Homework Assignment
AI Summary
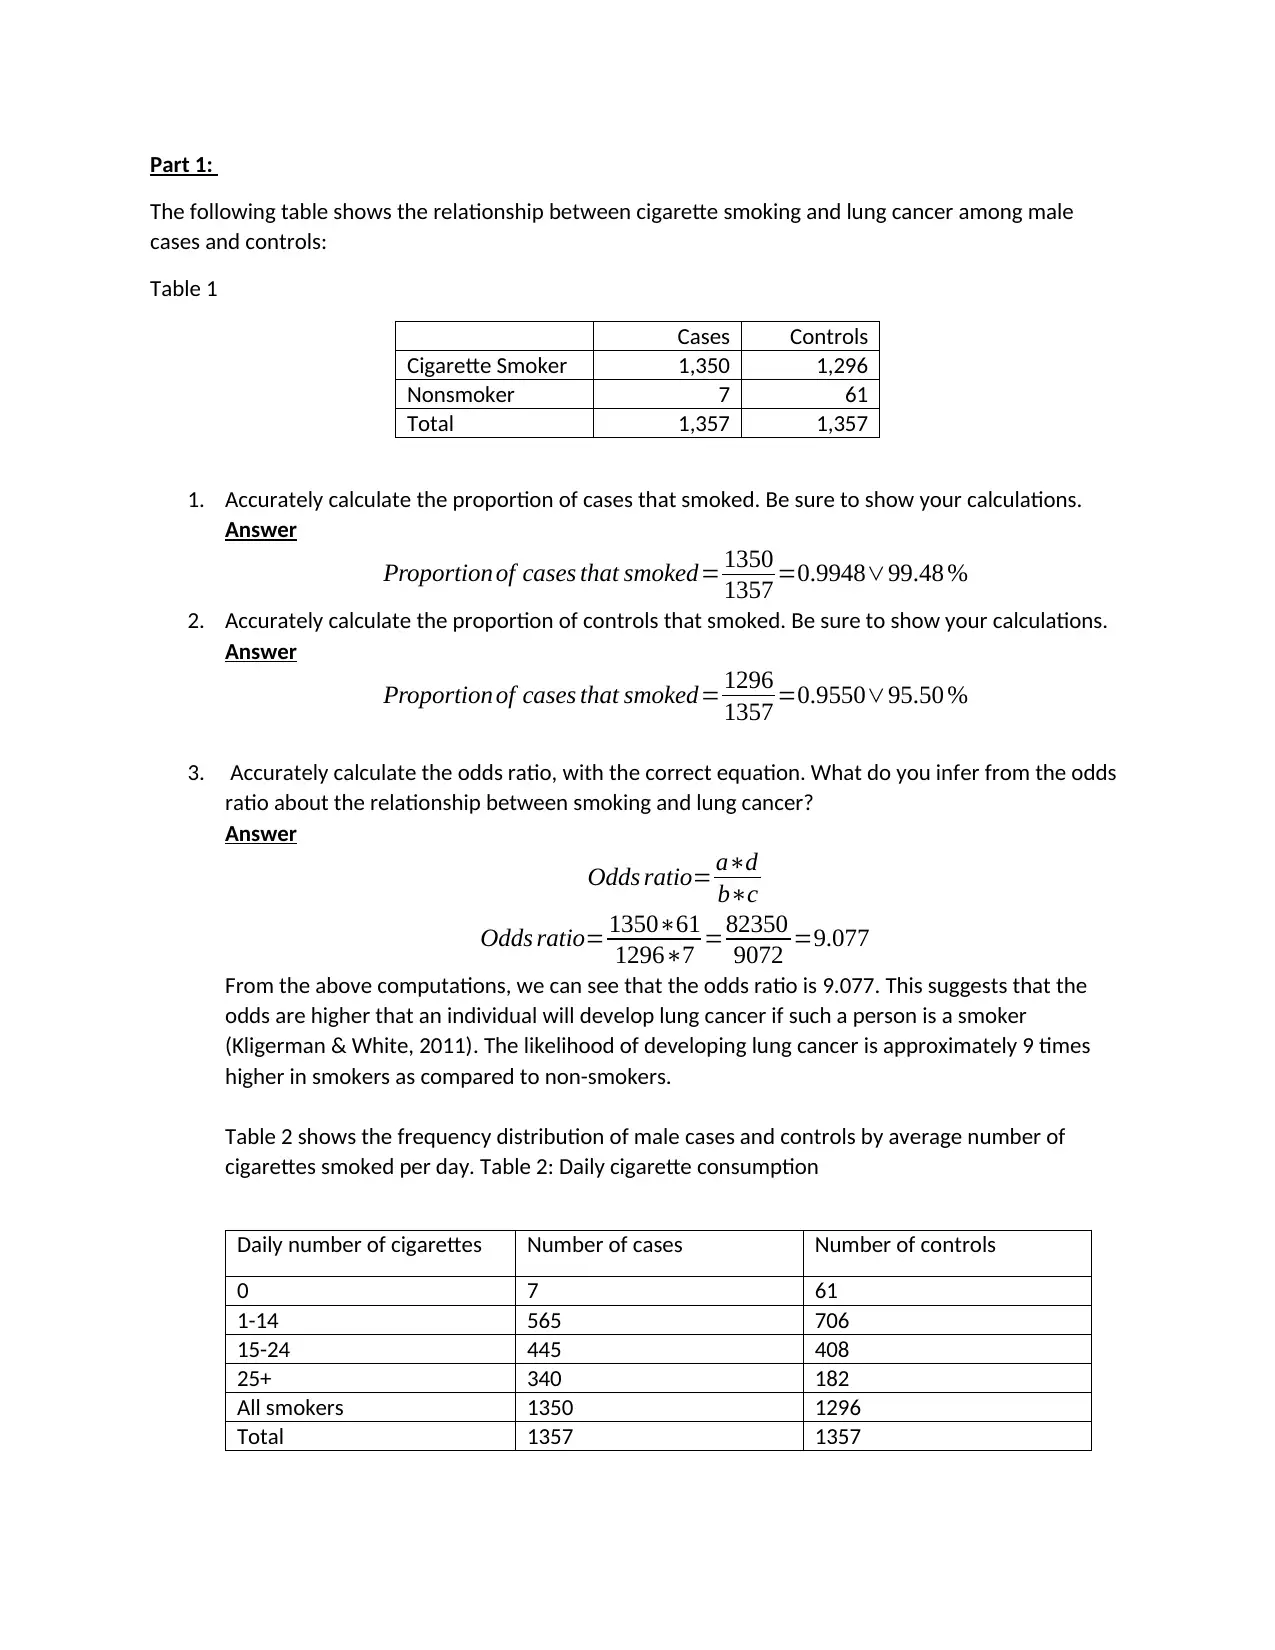
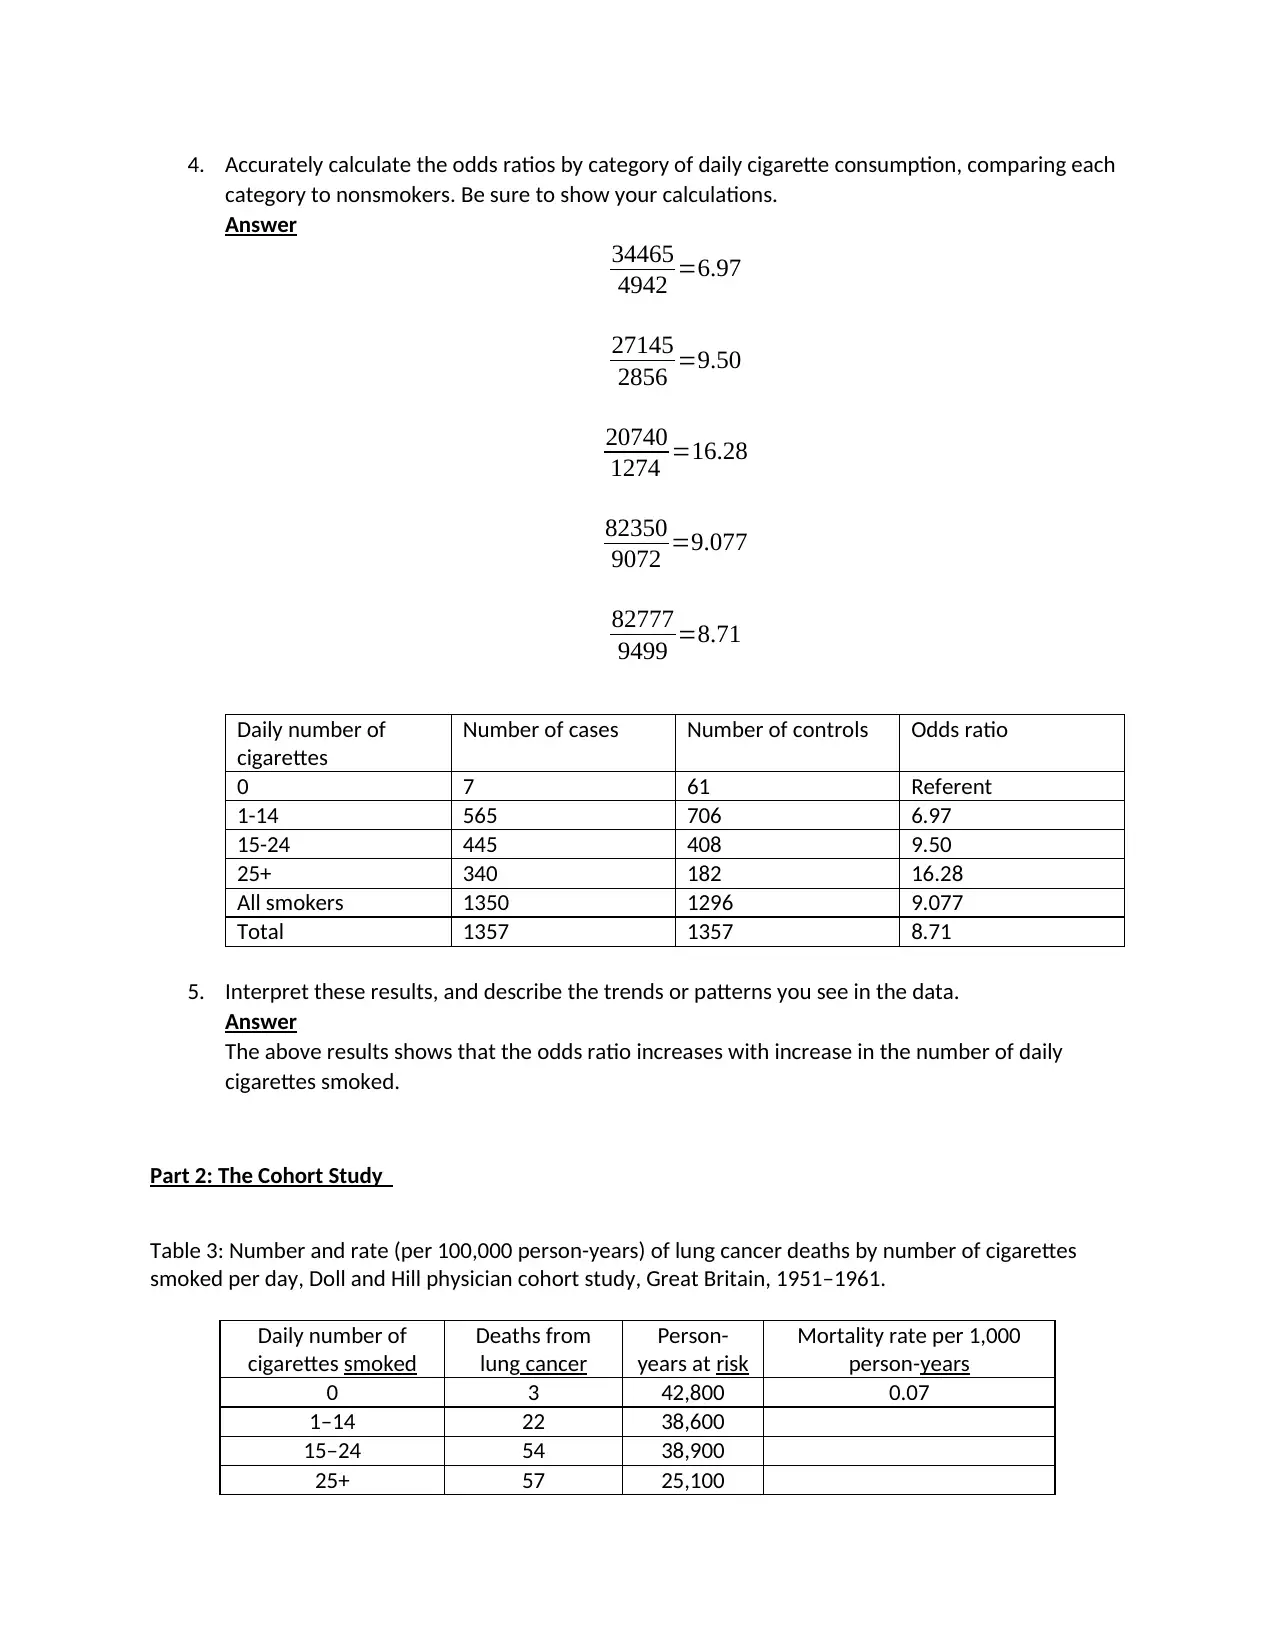
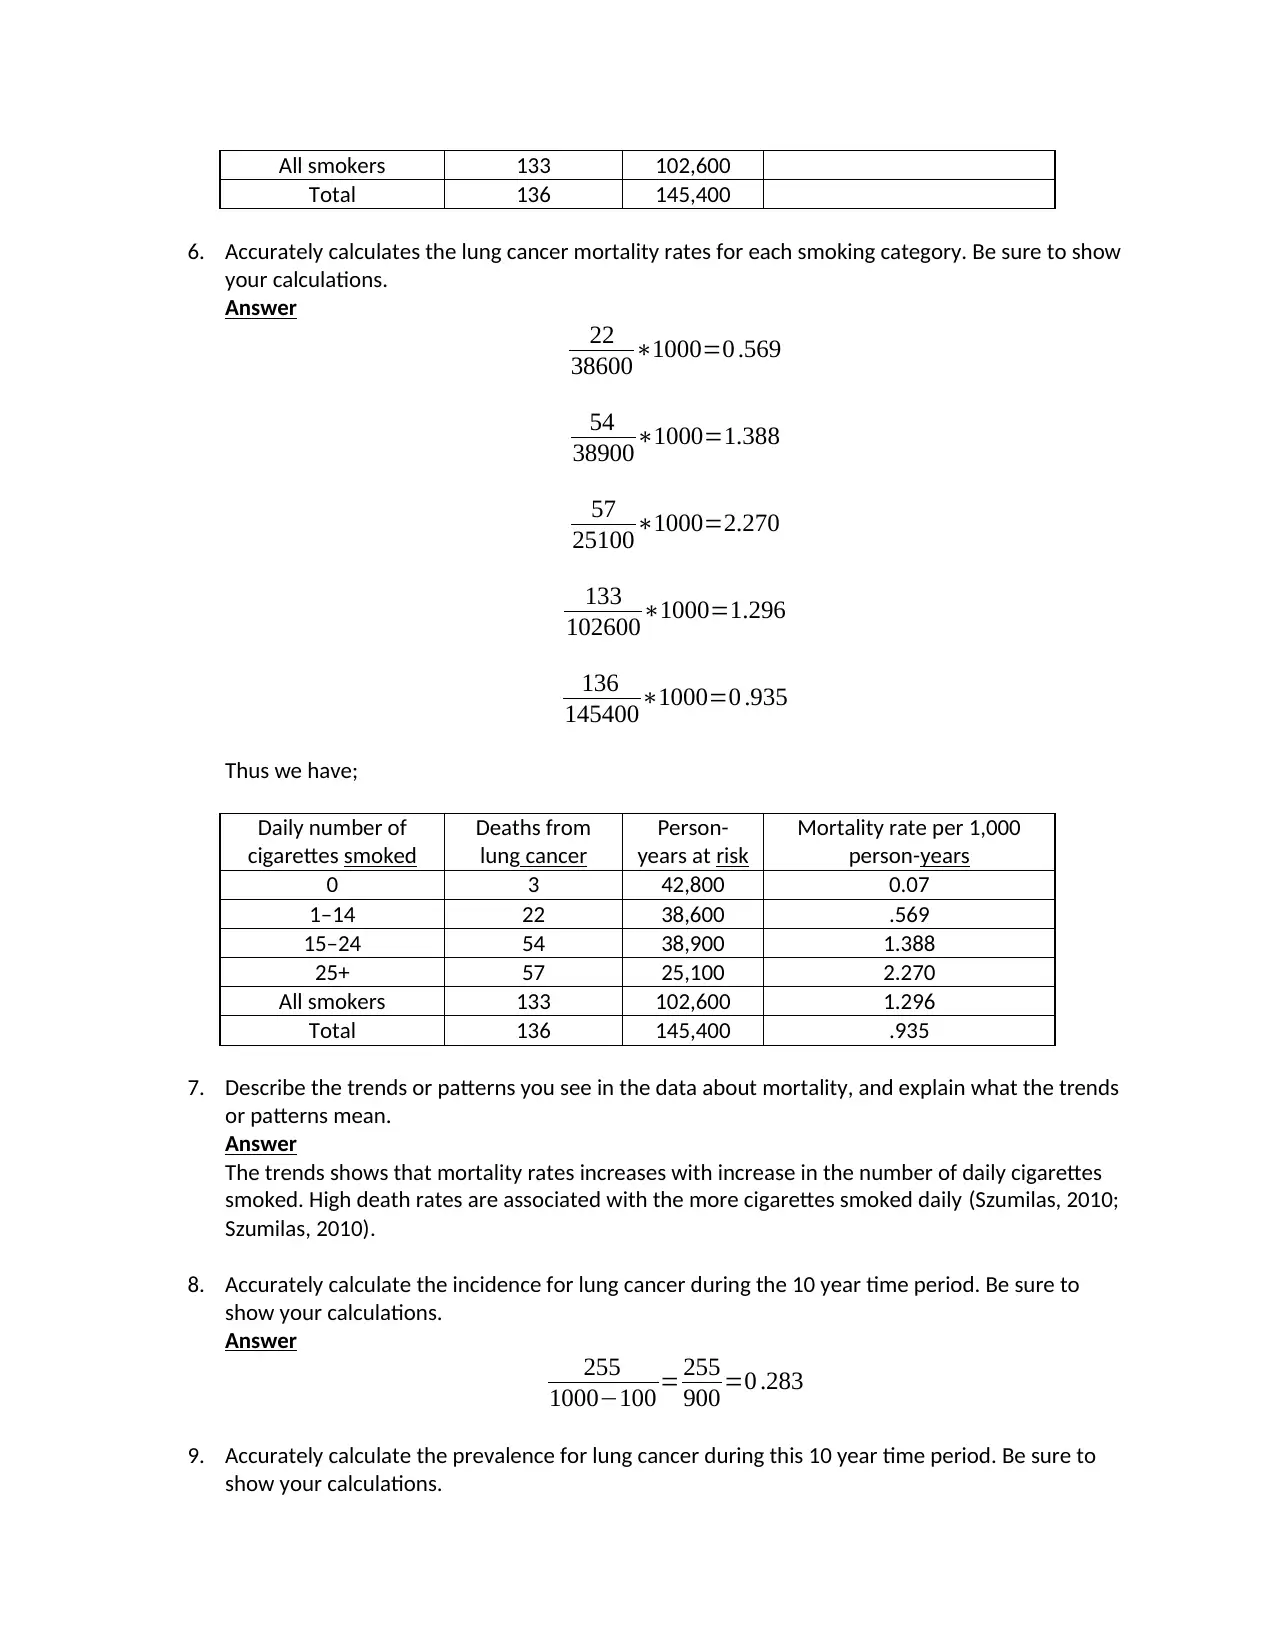
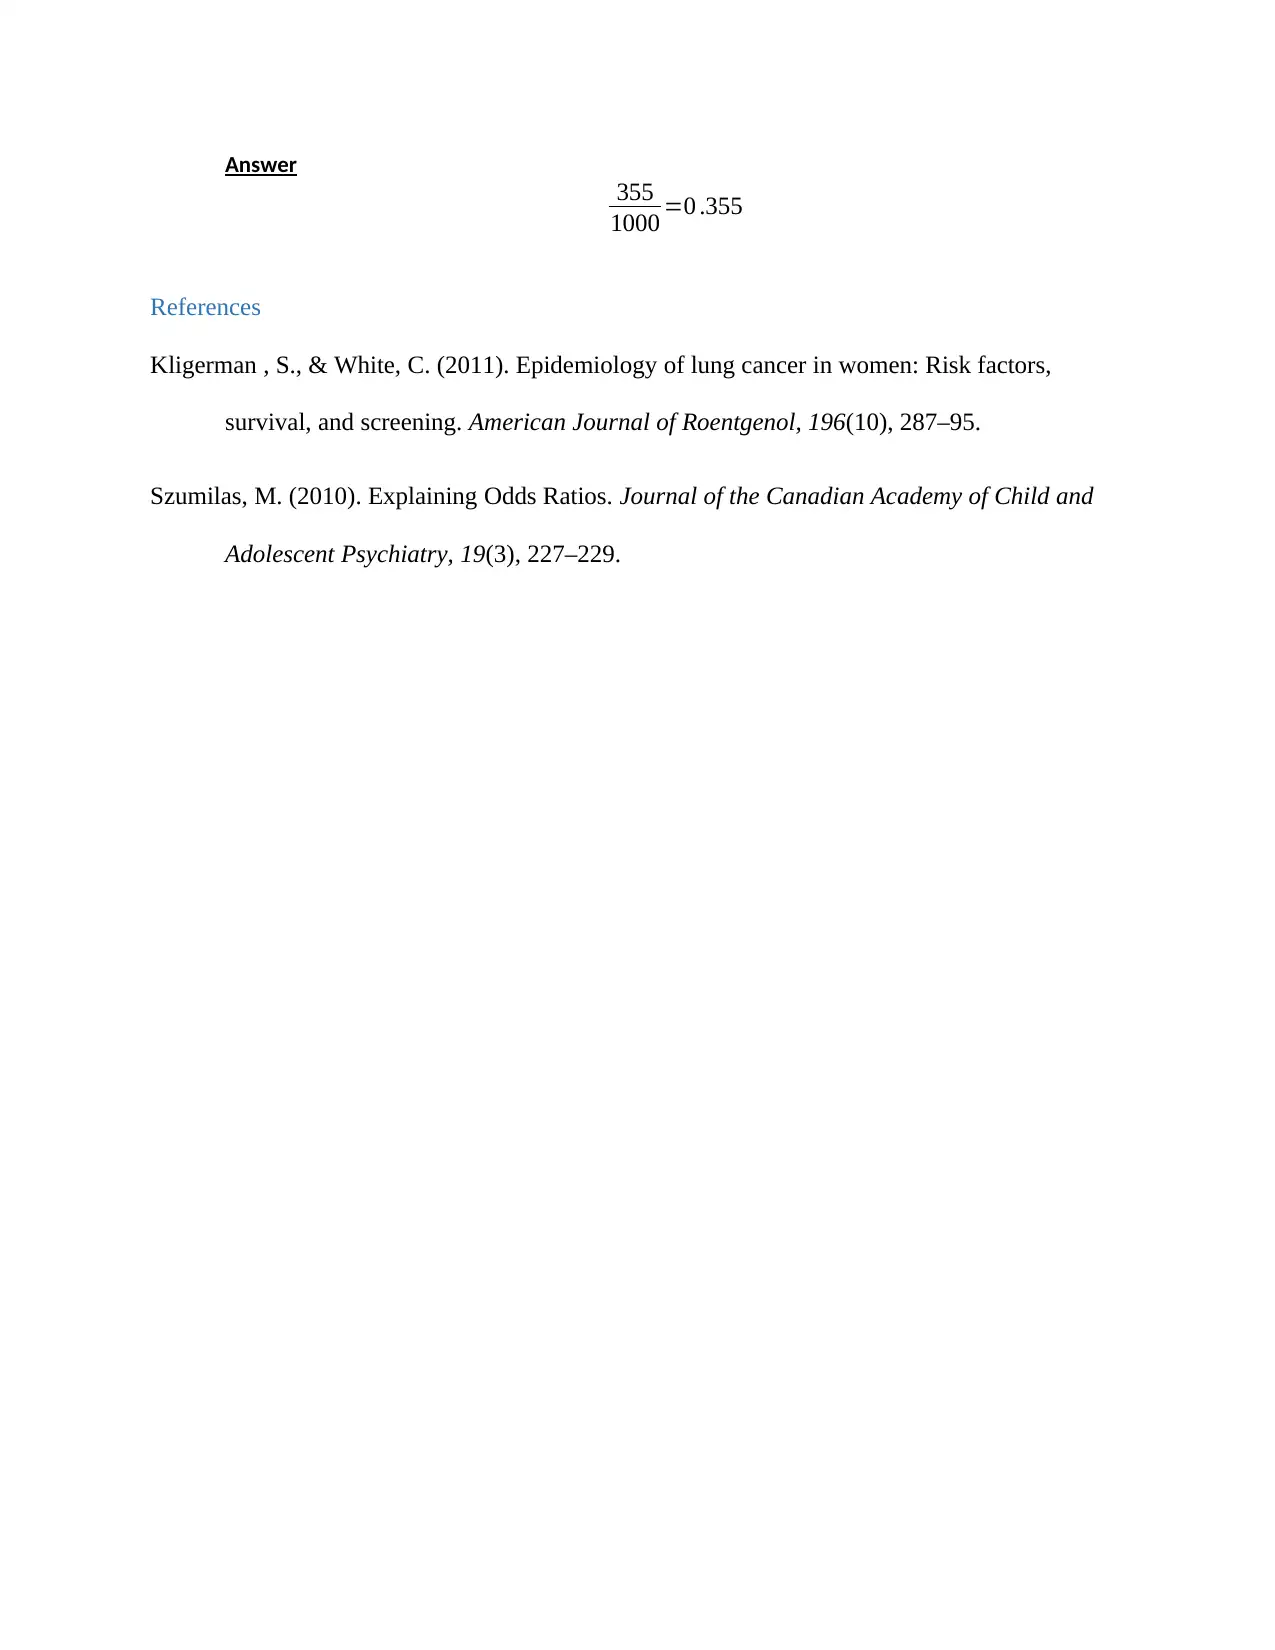
This assignment analyzes the relationship between cigarette smoking and lung cancer using both case-control and cohort study designs. Part 1 focuses on a case-control study, calculating the proportion of cases and controls who smoked, the odds ratio, and interpreting the association between smoking and lung cancer. Odds ratios are calculated for different categories of daily cigarette consumption, revealing trends in risk. Part 2 examines a cohort study, calculating and interpreting lung cancer mortality rates for various smoking categories, demonstrating the increasing risk with higher cigarette consumption. The assignment includes calculations of incidence and prevalence rates, providing a comprehensive analysis of smoking's impact on lung cancer risk and mortality within a public health context.
Document Page
Part 1:
The following table shows the relationship between cigarette smoking and lung cancer among male
cases and controls:
Table 1
Cases Controls
Cigarette Smoker 1,350 1,296
Nonsmoker 7 61
Total 1,357 1,357
1. Accurately calculate the proportion of cases that smoked. Be sure to show your calculations.
Answer
Proportion of cases that smoked= 1350
1357 =0.994899.48 %
2. Accurately calculate the proportion of controls that smoked. Be sure to show your calculations.
Answer
Proportion of cases that smoked= 1296
1357 =0.955095.50 %
3. Accurately calculate the odds ratio, with the correct equation. What do you infer from the odds
ratio about the relationship between smoking and lung cancer?
Answer
Odds ratio= ad
bc
Odds ratio= 135061
12967 =82350
9072 =9.077
From the above computations, we can see that the odds ratio is 9.077. This suggests that the
odds are higher that an individual will develop lung cancer if such a person is a smoker
(Kligerman & White, 2011). The likelihood of developing lung cancer is approximately 9 times
higher in smokers as compared to non-smokers.
Table 2 shows the frequency distribution of male cases and controls by average number of
cigarettes smoked per day. Table 2: Daily cigarette consumption
Daily number of cigarettes Number of cases Number of controls
0 7 61
1-14 565 706
15-24 445 408
25+ 340 182
All smokers 1350 1296
Total 1357 1357
tabler-icon-diamond-filled.svg

Paraphrase This Document

Need a fresh take? Get an instant paraphrase of this document with our AI Paraphraser
Document Page
4. Accurately calculate the odds ratios by category of daily cigarette consumption, comparing each
category to nonsmokers. Be sure to show your calculations.
Answer
34465
4942 =6.97
27145
2856 =9.50
20740
1274 =16.28
82350
9072 =9.077
82777
9499 =8.71
Daily number of
cigarettes
Number of cases Number of controls Odds ratio
0 7 61 Referent
1-14 565 706 6.97
15-24 445 408 9.50
25+ 340 182 16.28
All smokers 1350 1296 9.077
Total 1357 1357 8.71
5. Interpret these results, and describe the trends or patterns you see in the data.
Answer
The above results shows that the odds ratio increases with increase in the number of daily
cigarettes smoked.
Part 2: The Cohort Study
Table 3: Number and rate (per 100,000 person-years) of lung cancer deaths by number of cigarettes
smoked per day, Doll and Hill physician cohort study, Great Britain, 1951–1961.
Daily number of
cigarettes smoked
Deaths from
lung cancer
Person-
years at risk
Mortality rate per 1,000
person-years
0 3 42,800 0.07
1–14 22 38,600
15–24 54 38,900
25+ 57 25,100
Document Page
All smokers 133 102,600
Total 136 145,400
6. Accurately calculates the lung cancer mortality rates for each smoking category. Be sure to show
your calculations.
Answer
22
386001000=0 .569
54
389001000=1.388
57
251001000=2.270
133
1026001000=1.296
136
1454001000=0 .935
Thus we have;
Daily number of
cigarettes smoked
Deaths from
lung cancer
Person-
years at risk
Mortality rate per 1,000
person-years
0 3 42,800 0.07
1–14 22 38,600 .569
15–24 54 38,900 1.388
25+ 57 25,100 2.270
All smokers 133 102,600 1.296
Total 136 145,400 .935
7. Describe the trends or patterns you see in the data about mortality, and explain what the trends
or patterns mean.
Answer
The trends shows that mortality rates increases with increase in the number of daily cigarettes
smoked. High death rates are associated with the more cigarettes smoked daily (Szumilas, 2010;
Szumilas, 2010).
8. Accurately calculate the incidence for lung cancer during the 10 year time period. Be sure to
show your calculations.
Answer
255
1000100 = 255
900 =0 .283
9. Accurately calculate the prevalence for lung cancer during this 10 year time period. Be sure to
show your calculations.
Document Page
Answer
355
1000 =0 .355
References
Kligerman , S., & White, C. (2011). Epidemiology of lung cancer in women: Risk factors,
survival, and screening. American Journal of Roentgenol, 196(10), 287–95.
Szumilas, M. (2010). Explaining Odds Ratios. Journal of the Canadian Academy of Child and
Adolescent Psychiatry, 19(3), 227–229.
chevron_up_icon
1 out of 4
circle_padding
hide_on_mobile
zoom_out_icon
[object Object]