Dissertation Proposal: Smoking Cessation and Demographic Influences
VerifiedAdded on 2023/01/10
|23
|4283
|85
Report
AI Summary
This report presents a literature review proposal for a dissertation project examining the relationship between age, gender, and an individual's willingness to quit smoking. The study investigates barriers to quitting and potential methods to aid in smoking cessation, framing smoking as a public health issue. The methodology includes primary research with questionnaires administered to smokers, followed by data analysis using SPSS. The results section features frequency distributions and cross-tabulations to analyze the data. The report also evaluates the research's strengths and weaknesses, addresses ethical considerations, and provides conclusions and recommendations based on the findings. The study aims to identify patterns and influences related to smoking habits and quitting attempts, offering insights into public health interventions and support strategies. The data shows that out of 55 people, only 16 has ever tried to quit smoking and 39 others could not find any reason to even tried to quit smoking.

CW3
Paraphrase This Document
Need a fresh take? Get an instant paraphrase of this document with our AI Paraphraser
Contents
INTRODUCTION...........................................................................................................................1
BACKGROUND.............................................................................................................................1
METHODOLOGY..........................................................................................................................2
a) Defining primary research.......................................................................................................2
b) Factors considered for drafting the questionnaire...................................................................2
c) Administering the questionnaire..............................................................................................2
d) Strengths and weaknesses of search strategy..........................................................................2
e) Key ethical issues....................................................................................................................3
RESULTS........................................................................................................................................3
Five frequency distributions........................................................................................................3
Three cross tabulations................................................................................................................7
Using the “transform” tag create age ranges of young..............................................................15
FINDINGS & DISCUSSION........................................................................................................18
CRITICAL EVALUATION..........................................................................................................18
CONCLUSIONS & RECOMMENDATIONS..............................................................................19
REFERENCES..............................................................................................................................20

⊘ This is a preview!⊘
Do you want full access?
Subscribe today to unlock all pages.
Trusted by 1+ million students worldwide
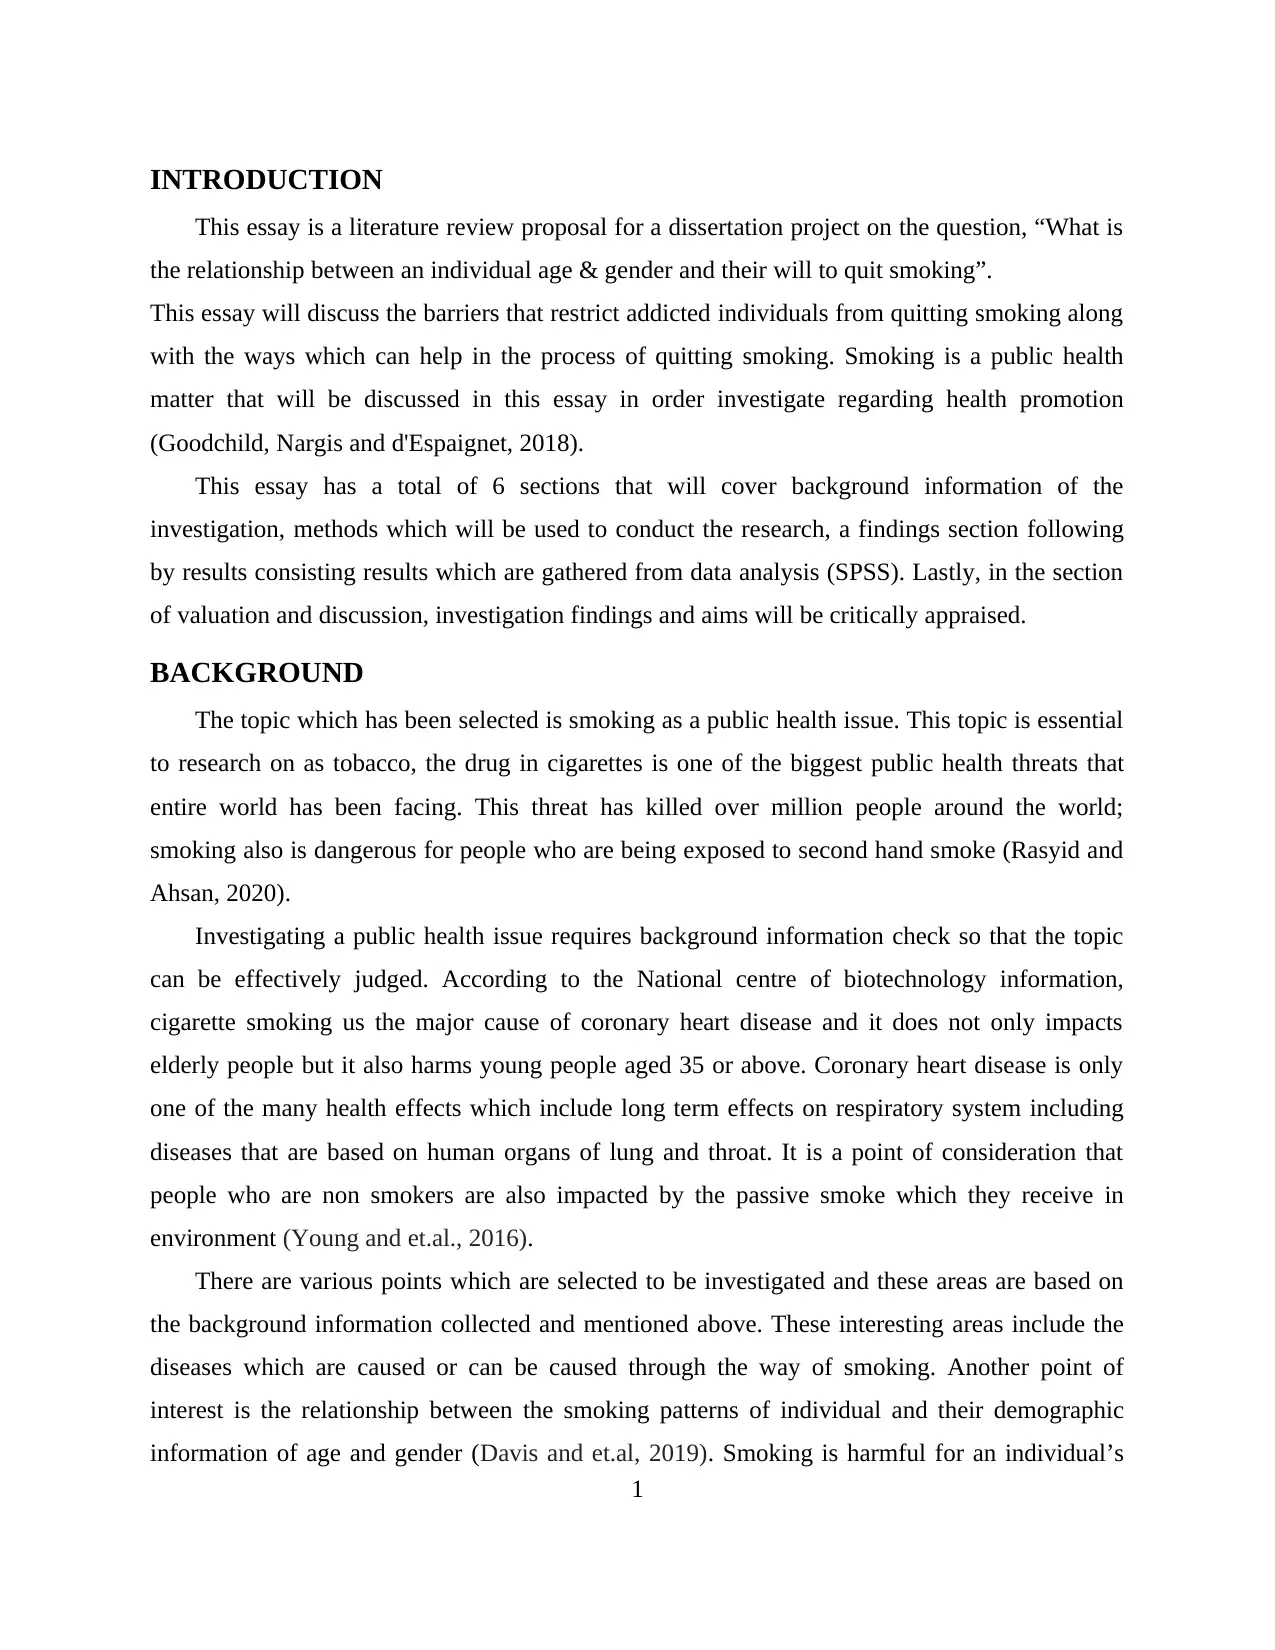
INTRODUCTION
This essay is a literature review proposal for a dissertation project on the question, “What is
the relationship between an individual age & gender and their will to quit smoking”.
This essay will discuss the barriers that restrict addicted individuals from quitting smoking along
with the ways which can help in the process of quitting smoking. Smoking is a public health
matter that will be discussed in this essay in order investigate regarding health promotion
(Goodchild, Nargis and d'Espaignet, 2018).
This essay has a total of 6 sections that will cover background information of the
investigation, methods which will be used to conduct the research, a findings section following
by results consisting results which are gathered from data analysis (SPSS). Lastly, in the section
of valuation and discussion, investigation findings and aims will be critically appraised.
BACKGROUND
The topic which has been selected is smoking as a public health issue. This topic is essential
to research on as tobacco, the drug in cigarettes is one of the biggest public health threats that
entire world has been facing. This threat has killed over million people around the world;
smoking also is dangerous for people who are being exposed to second hand smoke (Rasyid and
Ahsan, 2020).
Investigating a public health issue requires background information check so that the topic
can be effectively judged. According to the National centre of biotechnology information,
cigarette smoking us the major cause of coronary heart disease and it does not only impacts
elderly people but it also harms young people aged 35 or above. Coronary heart disease is only
one of the many health effects which include long term effects on respiratory system including
diseases that are based on human organs of lung and throat. It is a point of consideration that
people who are non smokers are also impacted by the passive smoke which they receive in
environment (Young and et.al., 2016).
There are various points which are selected to be investigated and these areas are based on
the background information collected and mentioned above. These interesting areas include the
diseases which are caused or can be caused through the way of smoking. Another point of
interest is the relationship between the smoking patterns of individual and their demographic
information of age and gender (Davis and et.al, 2019). Smoking is harmful for an individual’s
1
Paraphrase This Document
Need a fresh take? Get an instant paraphrase of this document with our AI Paraphraser
health, it has been known as a fact but them also people are addicted to it as a great extent, so
what are the reasons or barriers which limit people to quit smoking. Along with these points, the
area which is concerned with the people who try to quit smoking is also considered to be
discussed as it will result as a base for the reasons which influence people to fight their addiction
and make efforts to quit smoking (Prestwich, Kenworthy and Conner, 2017).
METHODOLOGY
a) Defining primary research
Primary investigation is a process of researching about a topic using primary data sources
of observations and interviews that can benefit in first hand information.
b) Factors considered for drafting the questionnaire
This particular research is focused towards the public health issue of smoking, considering
this, it was decided that the information collected will provide a capability to track down the
patterns of smoking. The target respondents are only the people who smoke cigarettes as an
addiction as these people can only help in tracking down their smoking patterns. The questions
that will be included in questionnaire will be easy and short so that genuine response can be
gathered. The length of the questionnaire is planned to check by letting off few questionnaires to
people so that before the actual investigation, a check on research can be done which is refereed
as pre test questionnaire. The respondents are planned to be reached by acquiring the data from
nursing homes so that data can be gathered from those people who will to quit smoking or has an
agenda in past to quit smoking (Suzuki and et.al., 2019).
c) Administering the questionnaire
The questionnaire has been distributed through physical document to 55 individuals in
which various issues were faced. Few people were not interested to be a part of investigation due
to which convincing them was a difficult bit to perform (Cleophas and Zwinderman, 2016). As
the method of distribution was physical form, all the questionnaires were returned immediately
after 5 minutes time that took to fill up the form as the questionnaire was short and easy. The
data which was gathered through the way of questionnaire was then digitalised so that it can be
analysed through the tools of BIS (Team, 2016).
2
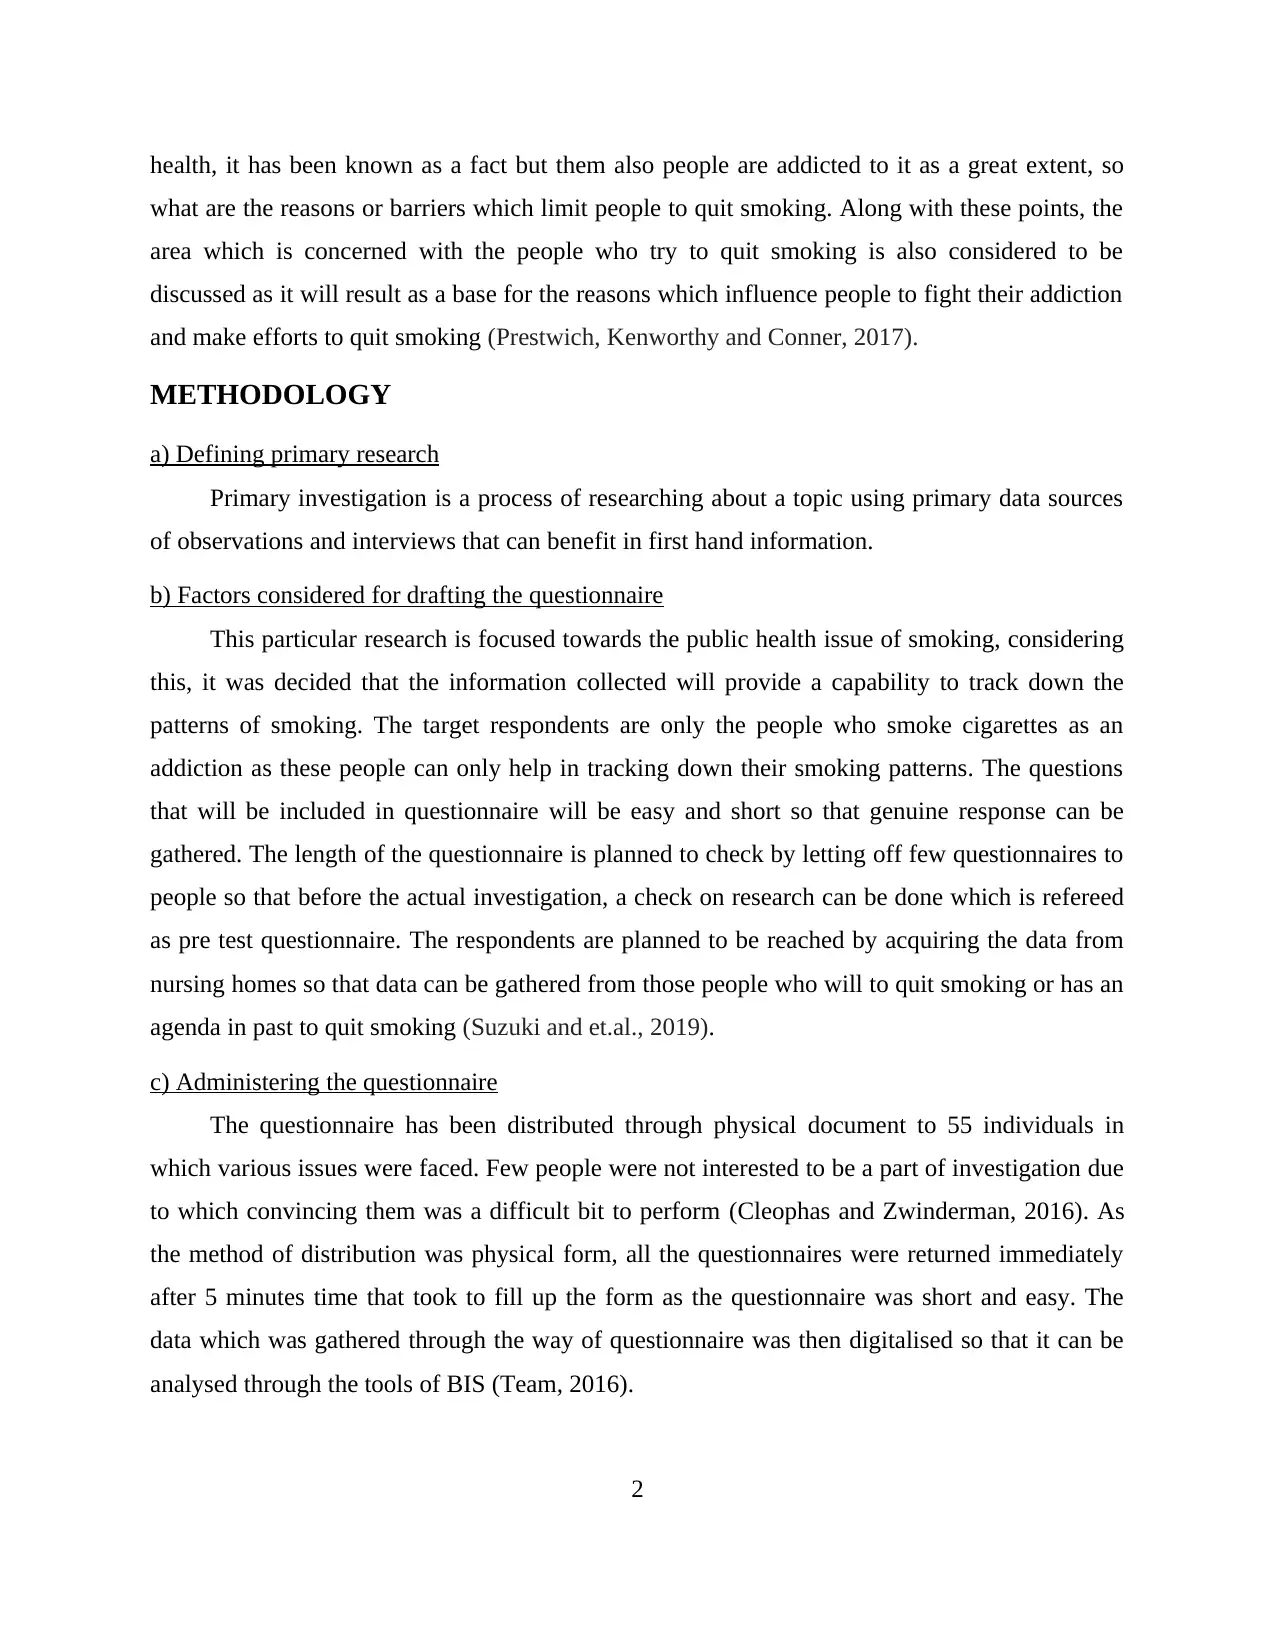
d) Strengths and weaknesses of search strategy
The search strategy which is used in this investigation is focused towards the gaining the
relevant and genuine data that lead towards few strengths and weaknesses. The strength of this
search strategy is that it is easy to be implemented and reliable as the data is collected through
the physical forms. There are few weaknesses of this strategy as well; the data that has been
collected is limited as only 5 questions were asked to each respondent and also the number of
responses was also low in number (Landtblom, 2018).
e) Key ethical issues
Questionnaire was limited to 5 questions as no questions regarding personal factors that
enforce addiction of smoking were allowed to be asked as it could have been result in ethical
evasion (Leech, Barrett and Morgan, 2013).
RESULTS
Five frequency distributions
3
⊘ This is a preview!⊘
Do you want full access?
Subscribe today to unlock all pages.
Trusted by 1+ million students worldwide
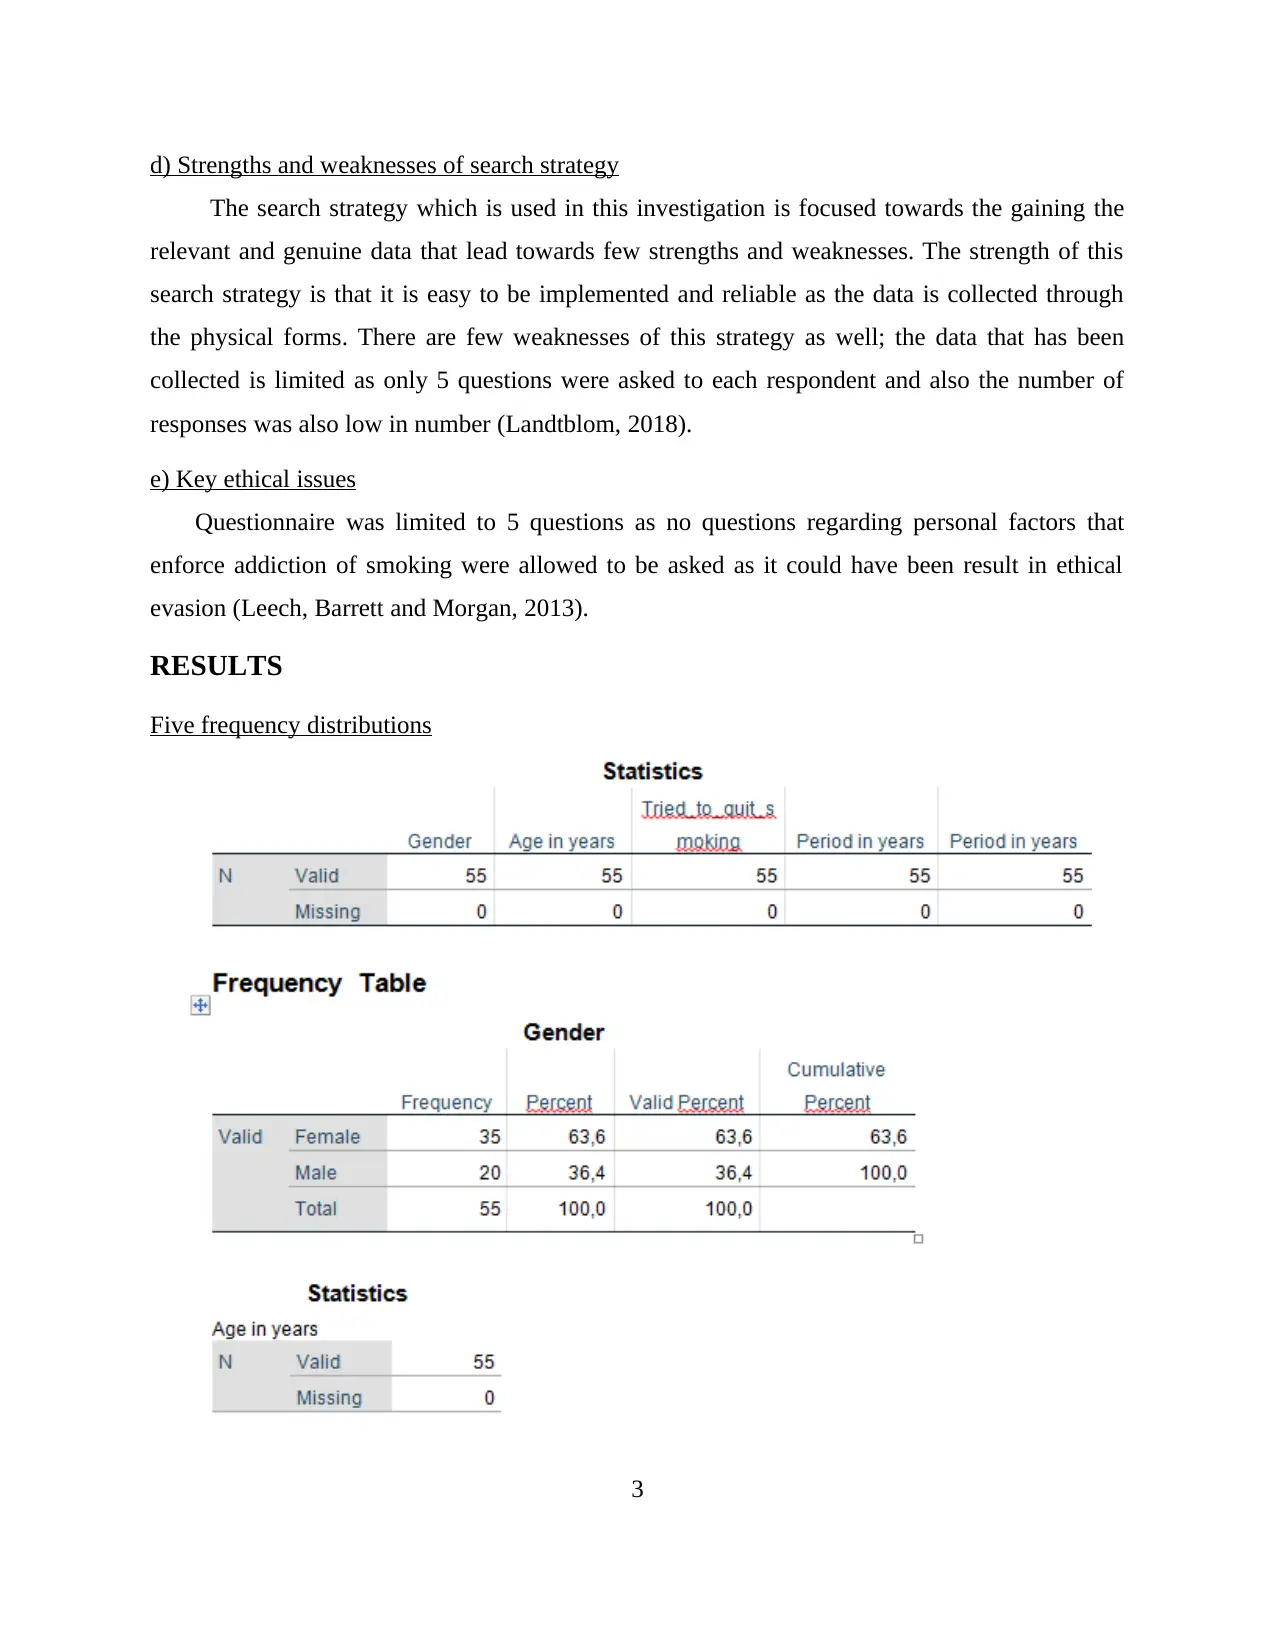
Mean 38,89
Median 40,00
Mode 35
Std. Deviation 13,742
Range 70
Age in years
Frequency Percent Valid Percent
Cumulative
Percent
Valid 18 1 1,8 1,8 1,8
19 1 1,8 1,8 3,6
20 1 1,8 1,8 5,5
21 2 3,6 3,6 9,1
22 2 3,6 3,6 12,7
23 4 7,3 7,3 20,0
25 1 1,8 1,8 21,8
26 1 1,8 1,8 23,6
27 2 3,6 3,6 27,3
29 1 1,8 1,8 29,1
31 2 3,6 3,6 32,7
32 1 1,8 1,8 34,5
33 1 1,8 1,8 36,4
35 5 9,1 9,1 45,5
36 1 1,8 1,8 47,3
37 1 1,8 1,8 49,1
40 1 1,8 1,8 50,9
41 1 1,8 1,8 52,7
42 3 5,5 5,5 58,2
43 3 5,5 5,5 63,6
44 1 1,8 1,8 65,5
45 1 1,8 1,8 67,3
47 2 3,6 3,6 70,9
48 1 1,8 1,8 72,7
49 4 7,3 7,3 80,0
50 1 1,8 1,8 81,8
51 1 1,8 1,8 83,6
52 2 3,6 3,6 87,3
4
Paraphrase This Document
Need a fresh take? Get an instant paraphrase of this document with our AI Paraphraser
53 1 1,8 1,8 89,1
54 1 1,8 1,8 90,9
55 2 3,6 3,6 94,5
57 1 1,8 1,8 96,4
65 1 1,8 1,8 98,2
88 1 1,8 1,8 100,0
Total 55 100,0 100,0
Tried_to_quit_smoking
Frequency Percent Valid Percent
Cumulative
Percent
Valid Yes 16 29,1 29,1 29,1
No 39 70,9 70,9 100,0
Total 55 100,0 100,0
Period in years
Frequency Percent Valid Percent
Cumulative
Percent
Valid 0 24 43,6 43,6 43,6
11 1 1,8 1,8 45,5
13 1 1,8 1,8 47,3
14 1 1,8 1,8 49,1
15 3 5,5 5,5 54,5
16 2 3,6 3,6 58,2
17 2 3,6 3,6 61,8
18 5 9,1 9,1 70,9
19 3 5,5 5,5 76,4
20 2 3,6 3,6 80,0
21 2 3,6 3,6 83,6
22 2 3,6 3,6 87,3
23 1 1,8 1,8 89,1
27 1 1,8 1,8 90,9
28 1 1,8 1,8 92,7
32 2 3,6 3,6 96,4
5
34 1 1,8 1,8 98,2
46 1 1,8 1,8 100,0
Total 55 100,0 100,0
Period in years
Frequency Percent Valid Percent
Cumulative
Percent
Valid 0 25 45,5 45,5 45,5
2 2 3,6 3,6 49,1
3 3 5,5 5,5 54,5
4 2 3,6 3,6 58,2
5 2 3,6 3,6 61,8
7 2 3,6 3,6 65,5
9 3 5,5 5,5 70,9
10 1 1,8 1,8 72,7
11 1 1,8 1,8 74,5
12 2 3,6 3,6 78,2
13 1 1,8 1,8 80,0
18 2 3,6 3,6 83,6
19 1 1,8 1,8 85,5
20 1 1,8 1,8 87,3
21 1 1,8 1,8 89,1
27 1 1,8 1,8 90,9
33 1 1,8 1,8 92,7
36 1 1,8 1,8 94,5
42 1 1,8 1,8 96,4
45 1 1,8 1,8 98,2
48 1 1,8 1,8 100,0
Total 55 100,0 100,0
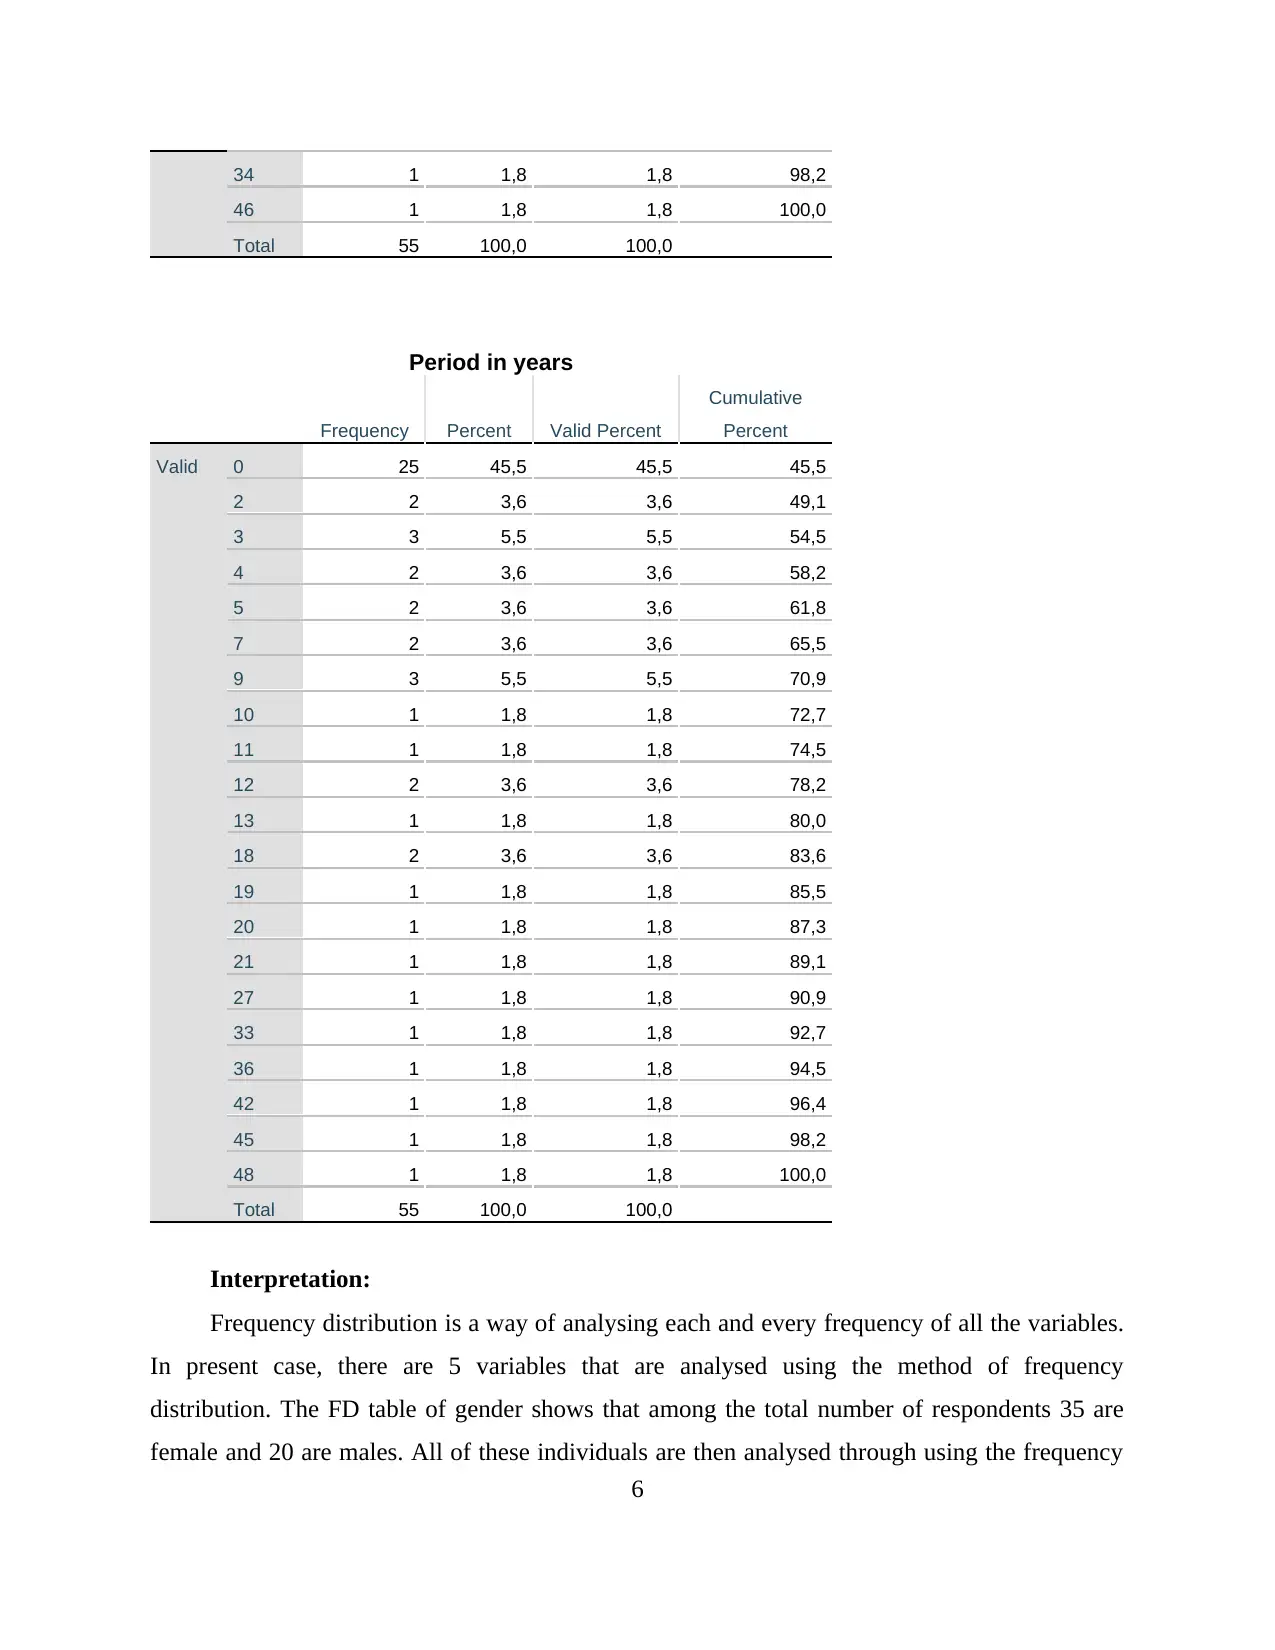
Interpretation:
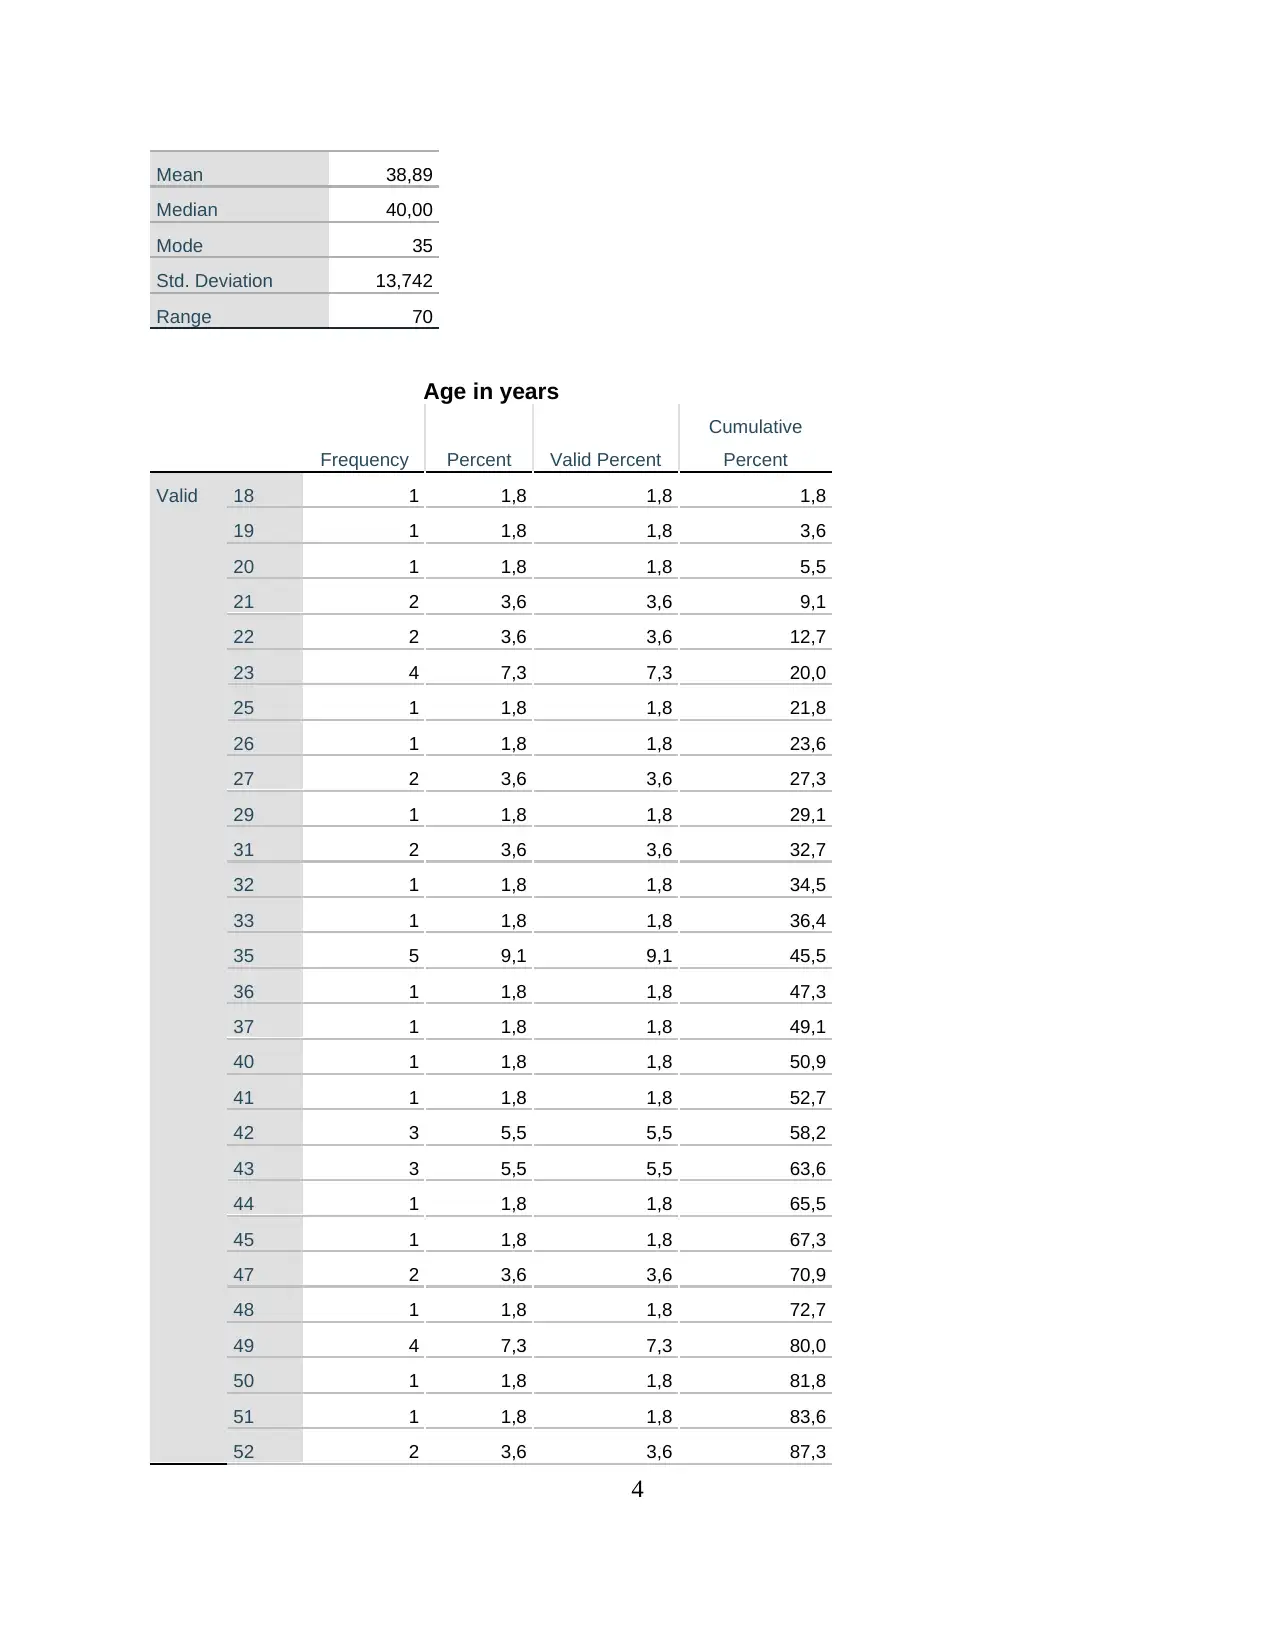
Frequency distribution is a way of analysing each and every frequency of all the variables.
In present case, there are 5 variables that are analysed using the method of frequency
distribution. The FD table of gender shows that among the total number of respondents 35 are
female and 20 are males. All of these individuals are then analysed through using the frequency
6
46 1 1,8 1,8 100,0
Total 55 100,0 100,0
Period in years
Frequency Percent Valid Percent
Cumulative
Percent
Valid 0 25 45,5 45,5 45,5
2 2 3,6 3,6 49,1
3 3 5,5 5,5 54,5
4 2 3,6 3,6 58,2
5 2 3,6 3,6 61,8
7 2 3,6 3,6 65,5
9 3 5,5 5,5 70,9
10 1 1,8 1,8 72,7
11 1 1,8 1,8 74,5
12 2 3,6 3,6 78,2
13 1 1,8 1,8 80,0
18 2 3,6 3,6 83,6
19 1 1,8 1,8 85,5
20 1 1,8 1,8 87,3
21 1 1,8 1,8 89,1
27 1 1,8 1,8 90,9
33 1 1,8 1,8 92,7
36 1 1,8 1,8 94,5
42 1 1,8 1,8 96,4
45 1 1,8 1,8 98,2
48 1 1,8 1,8 100,0
Total 55 100,0 100,0
Interpretation:
Frequency distribution is a way of analysing each and every frequency of all the variables.
In present case, there are 5 variables that are analysed using the method of frequency
distribution. The FD table of gender shows that among the total number of respondents 35 are
female and 20 are males. All of these individuals are then analysed through using the frequency
6
⊘ This is a preview!⊘
Do you want full access?
Subscribe today to unlock all pages.
Trusted by 1+ million students worldwide
distribution of age which shows the average age of every individual who is regarded as
respondent is 38 and the most of individuals are 35.
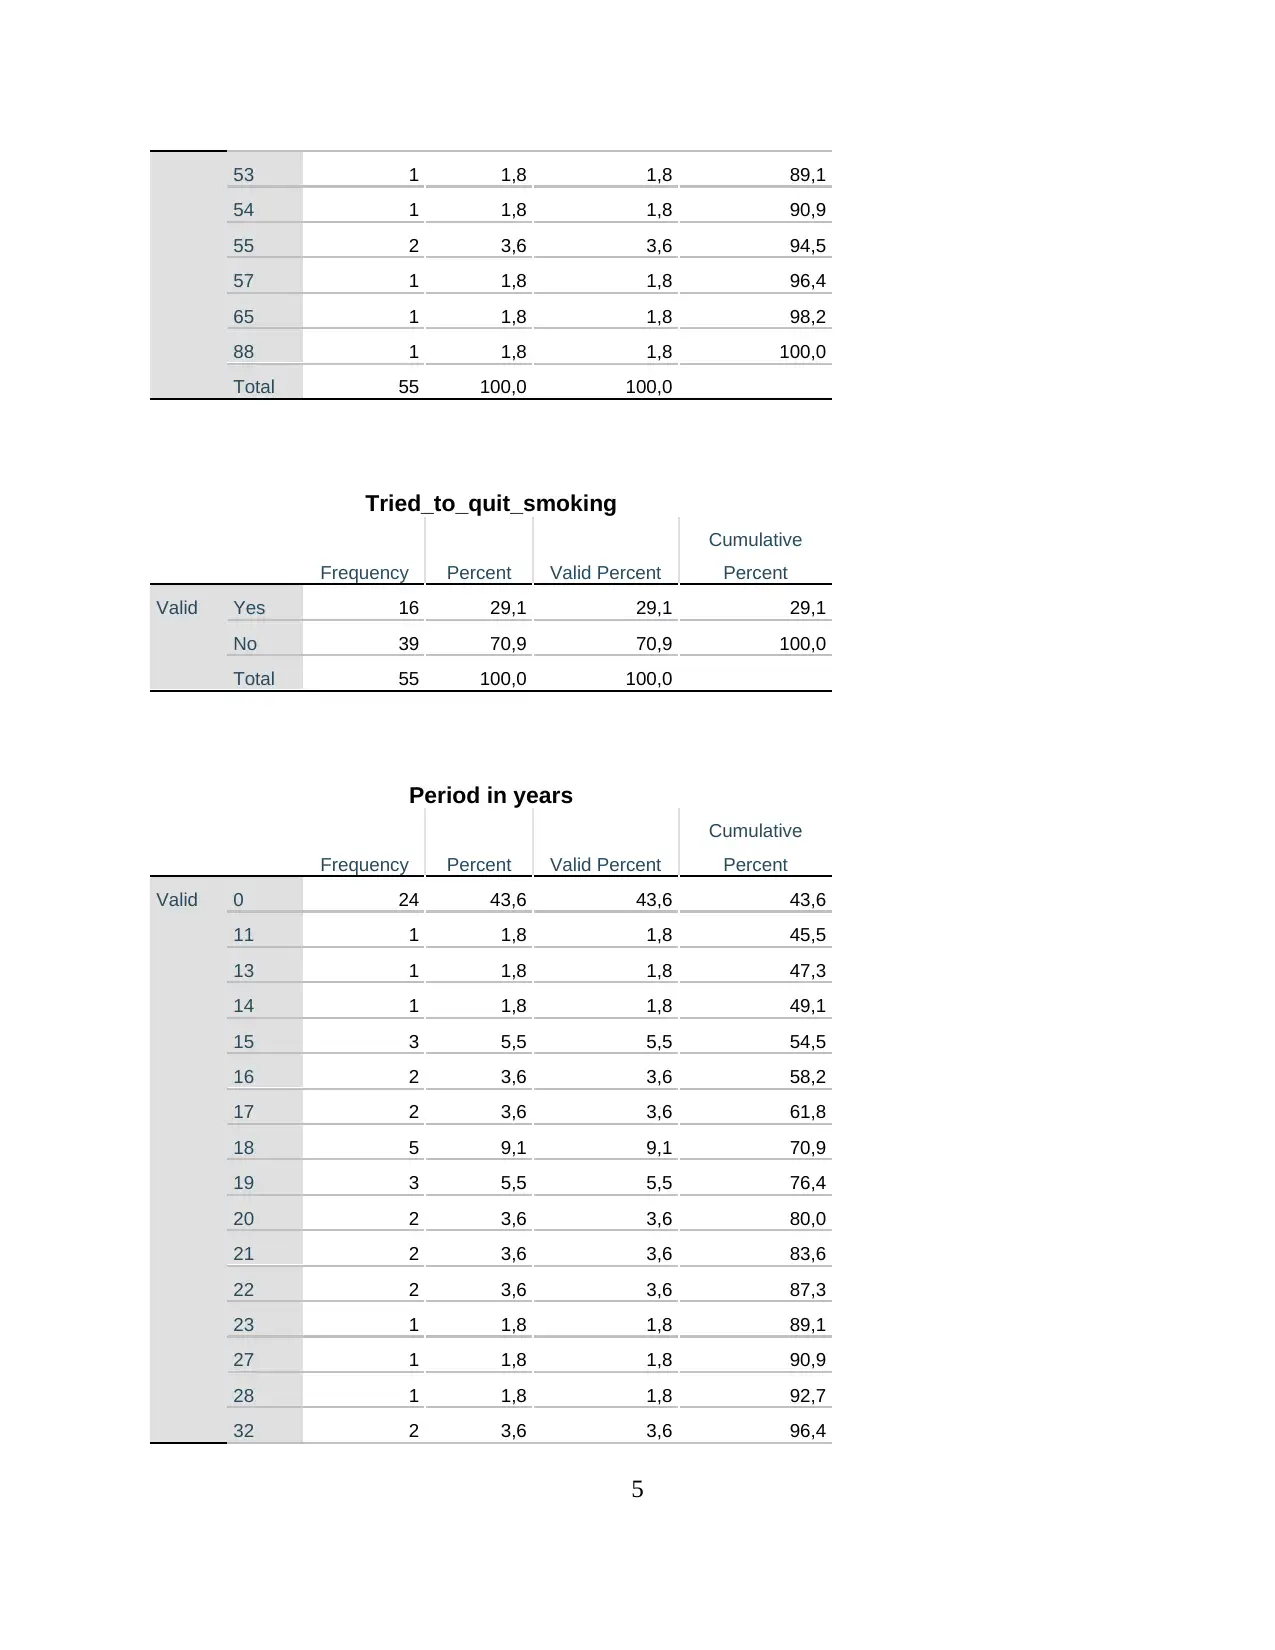
In addition, it has been seen that out of 55 people, only 16 has ever tried to quit smoking
and 39 others could not find any reason to even tried to quit smoking.
The frequency distribution table of period in years represents the period of years to which
people are smoking and it has been seen that maximum number of years of continuous smoking
is 46 whereas the maximum people has been addicted to smoking for 18 years.
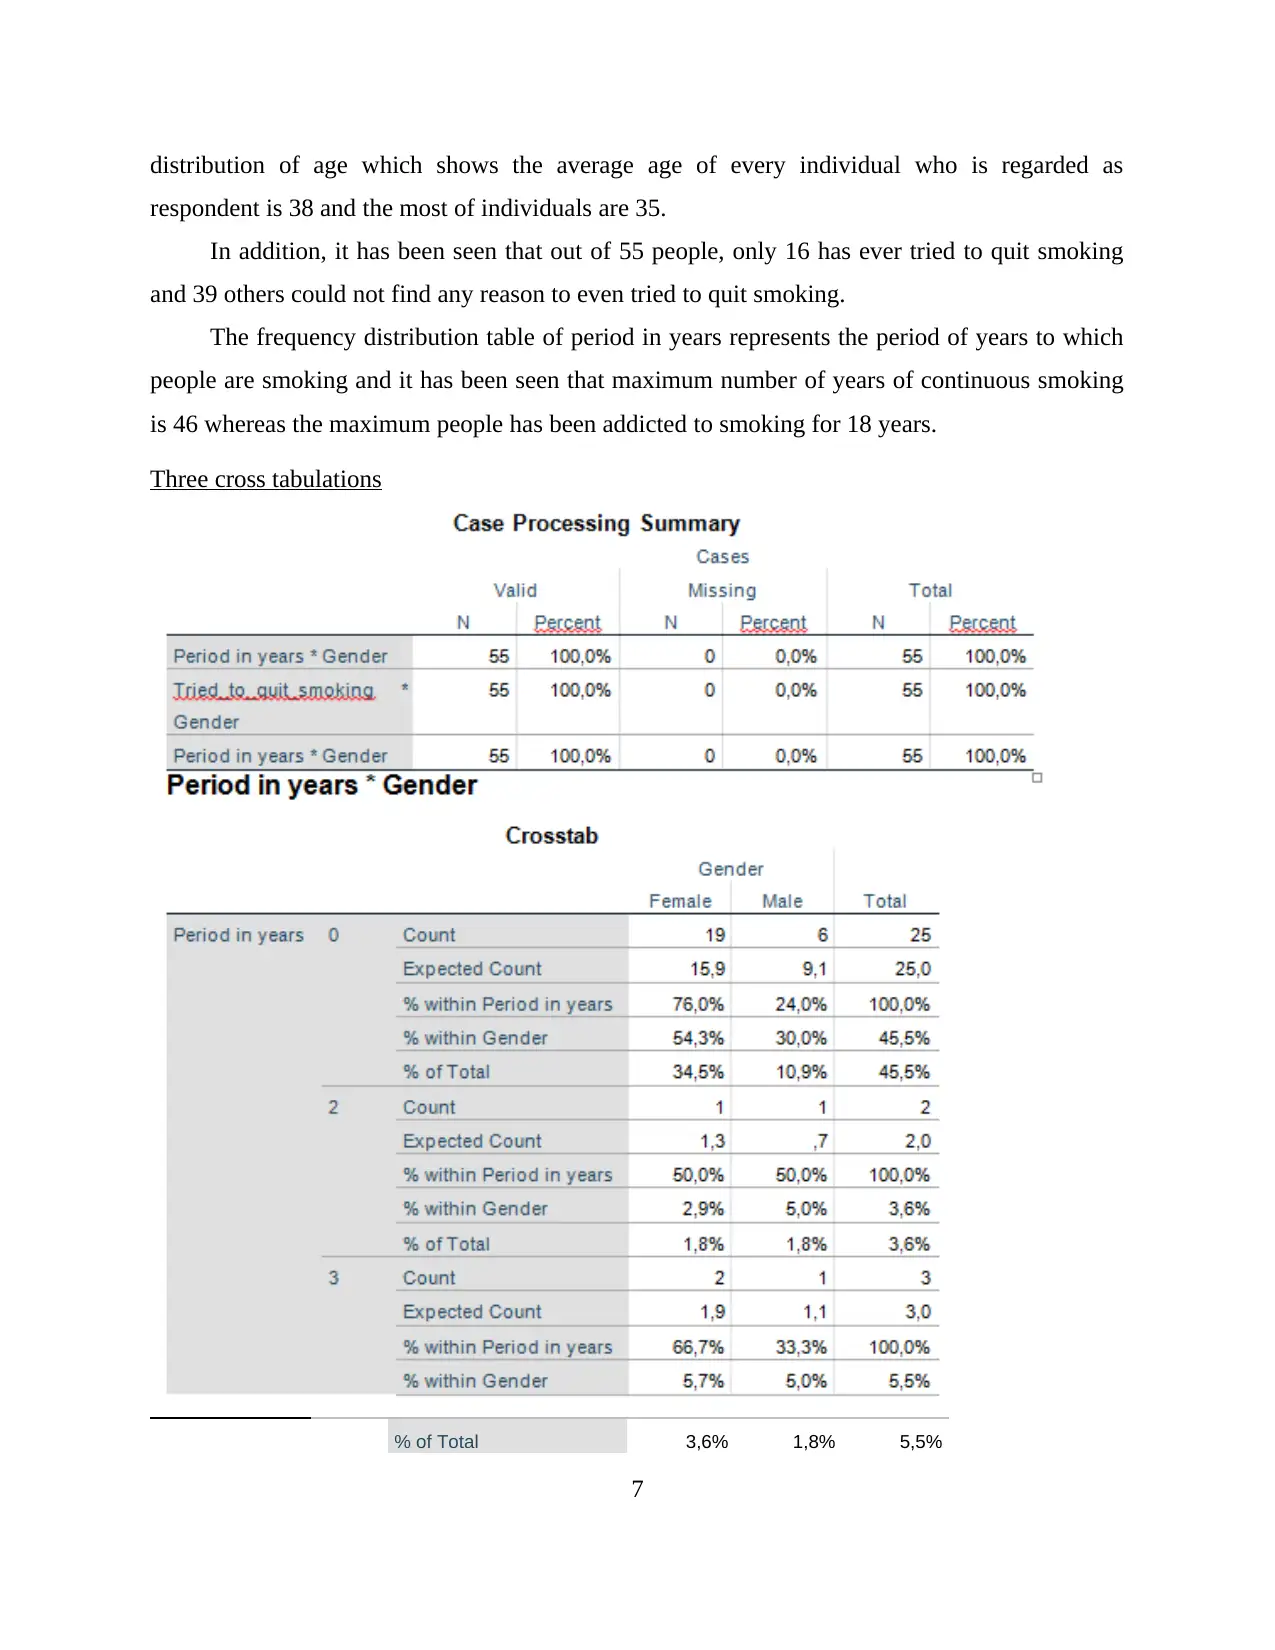
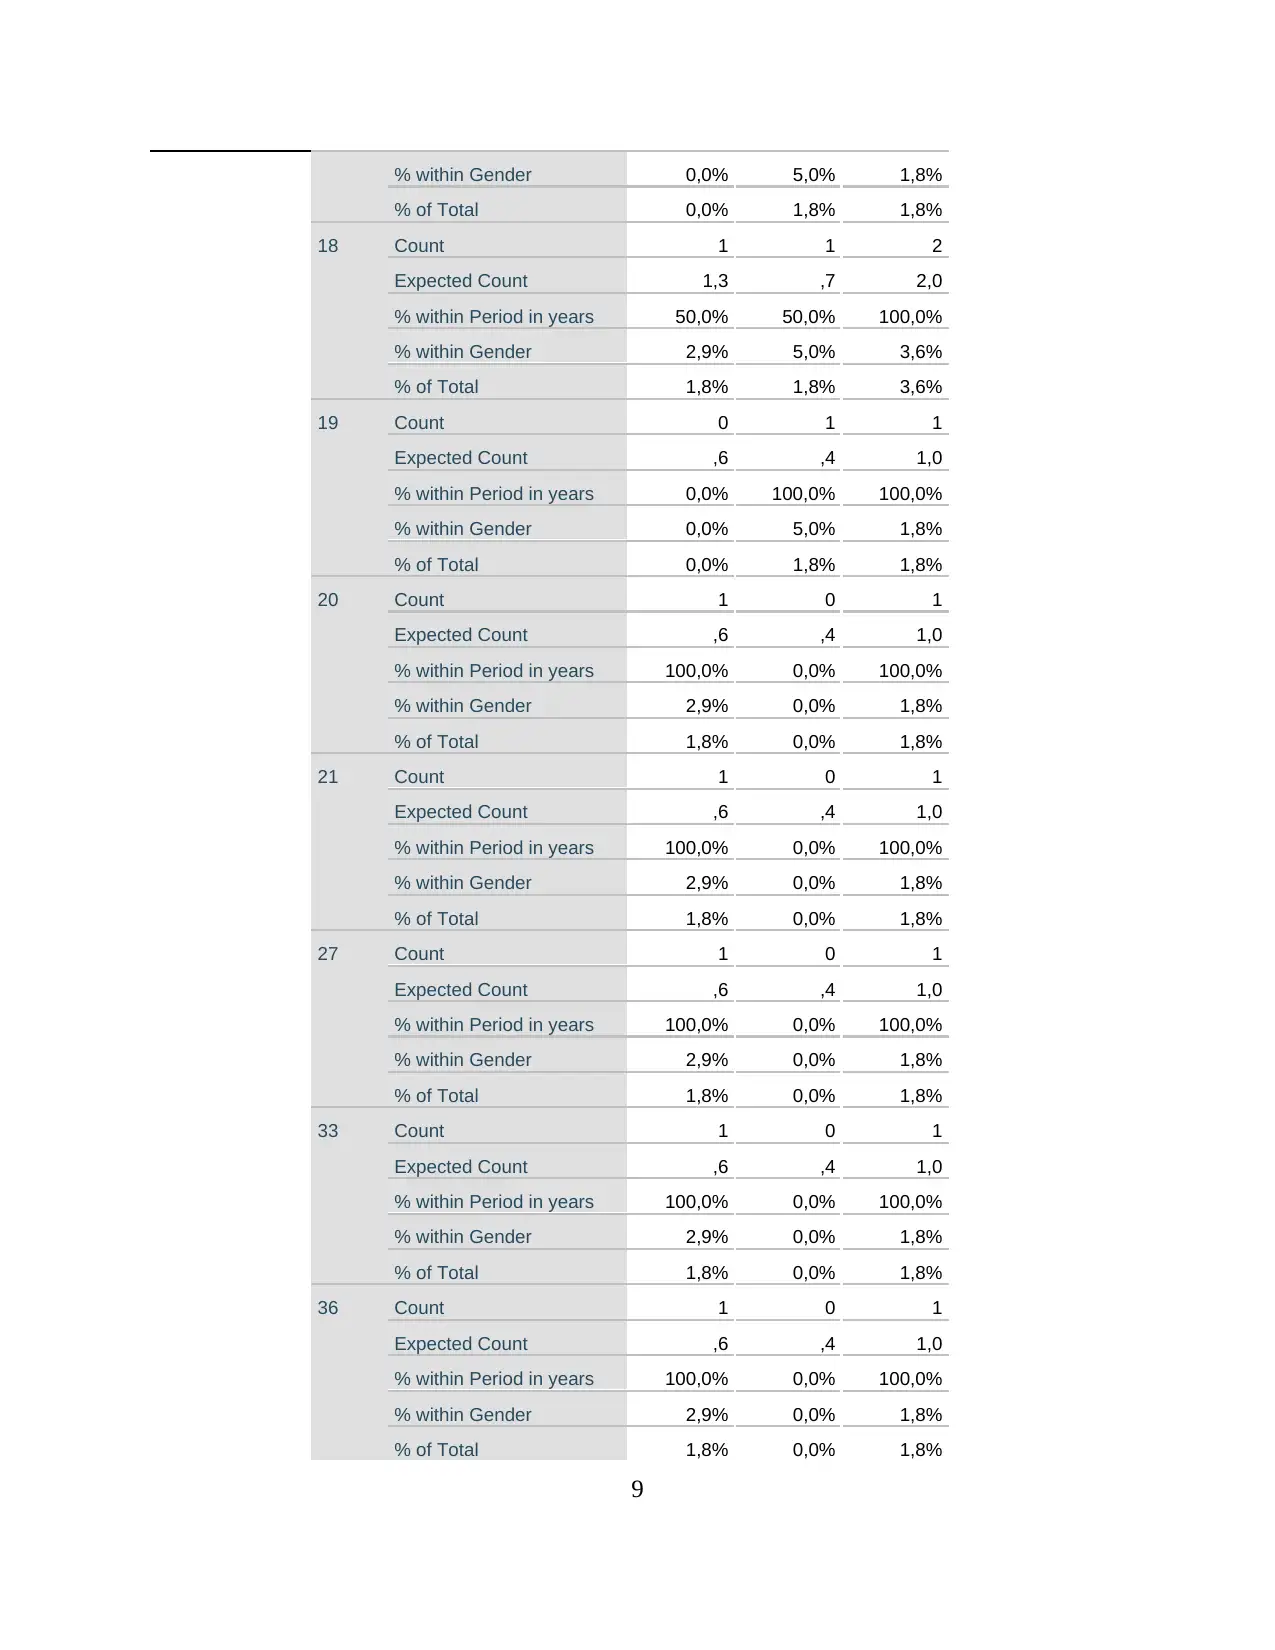
Three cross tabulations
% of Total 3,6% 1,8% 5,5%
7
respondent is 38 and the most of individuals are 35.
In addition, it has been seen that out of 55 people, only 16 has ever tried to quit smoking
and 39 others could not find any reason to even tried to quit smoking.
The frequency distribution table of period in years represents the period of years to which
people are smoking and it has been seen that maximum number of years of continuous smoking
is 46 whereas the maximum people has been addicted to smoking for 18 years.
Three cross tabulations
% of Total 3,6% 1,8% 5,5%
7
Paraphrase This Document
Need a fresh take? Get an instant paraphrase of this document with our AI Paraphraser
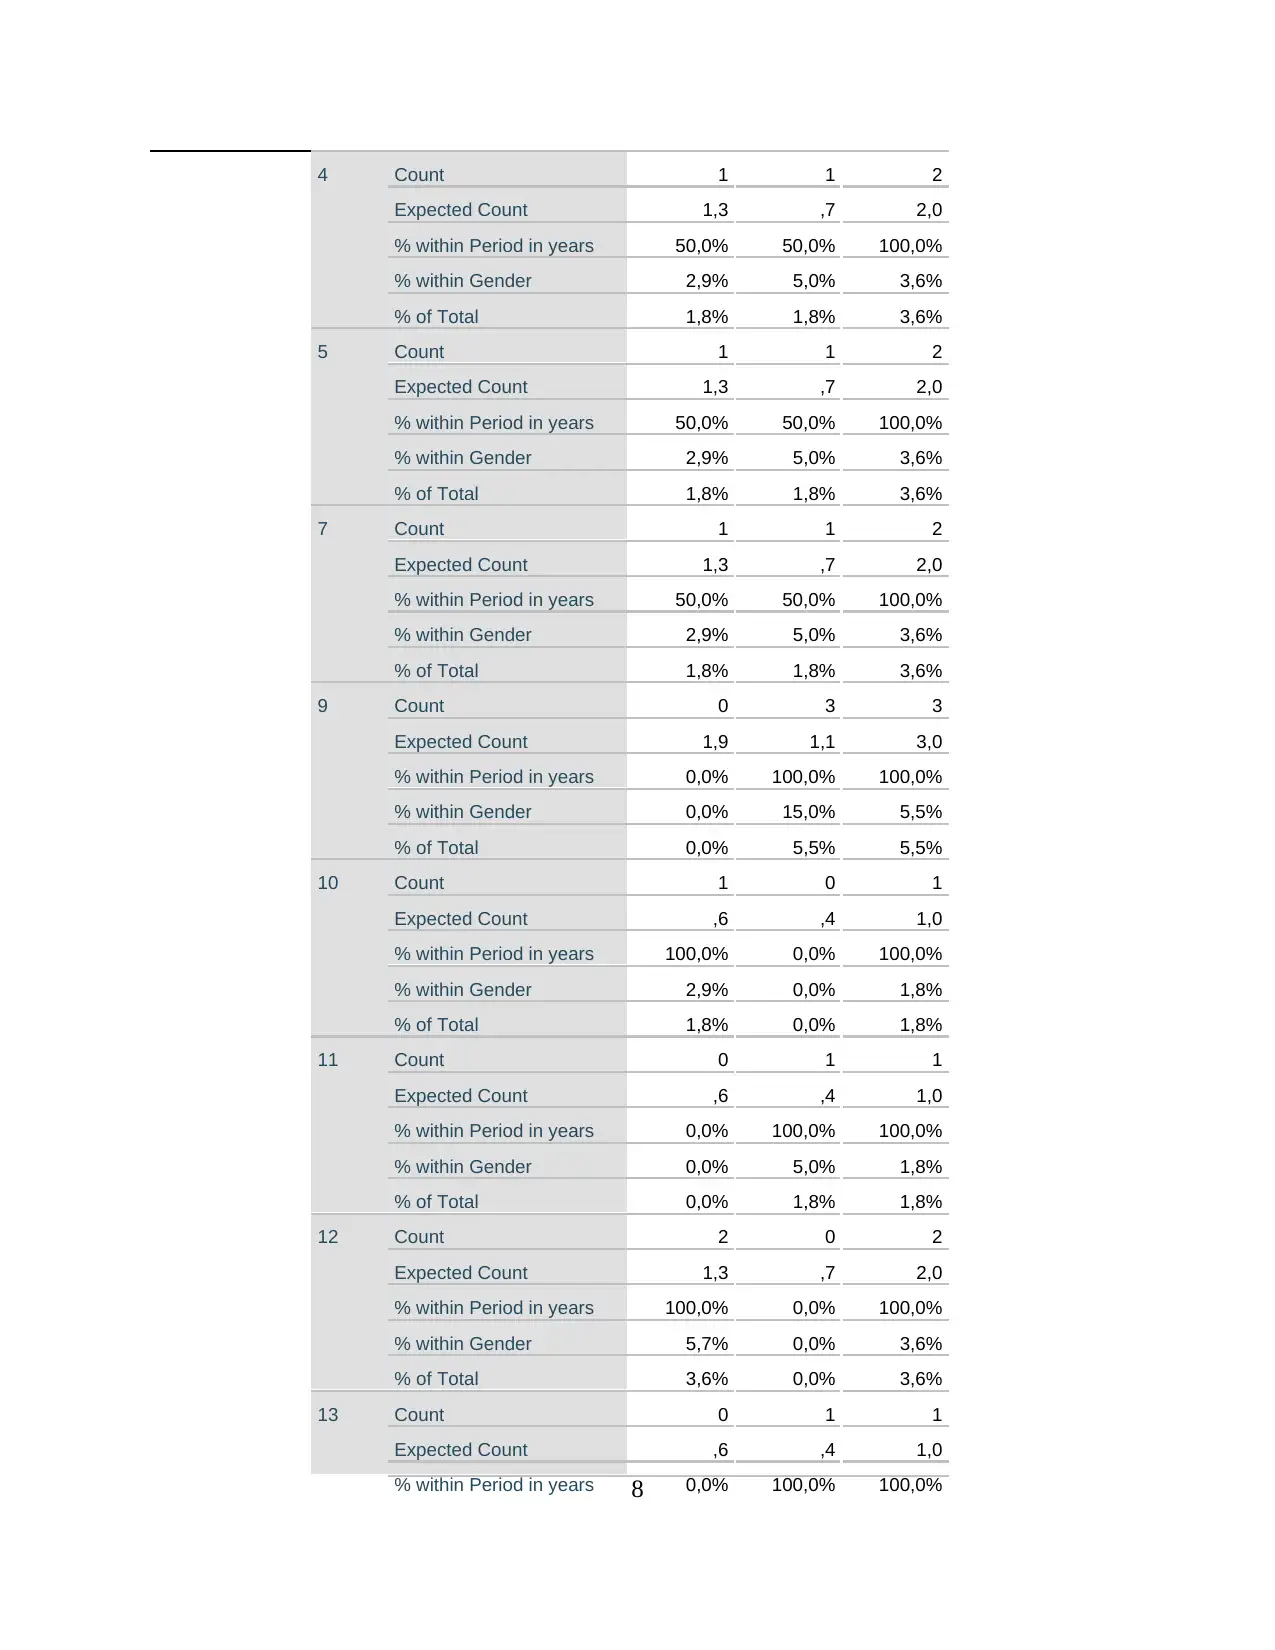
4 Count 1 1 2
Expected Count 1,3 ,7 2,0
% within Period in years 50,0% 50,0% 100,0%
% within Gender 2,9% 5,0% 3,6%
% of Total 1,8% 1,8% 3,6%
5 Count 1 1 2
Expected Count 1,3 ,7 2,0
% within Period in years 50,0% 50,0% 100,0%
% within Gender 2,9% 5,0% 3,6%
% of Total 1,8% 1,8% 3,6%
7 Count 1 1 2
Expected Count 1,3 ,7 2,0
% within Period in years 50,0% 50,0% 100,0%
% within Gender 2,9% 5,0% 3,6%
% of Total 1,8% 1,8% 3,6%
9 Count 0 3 3
Expected Count 1,9 1,1 3,0
% within Period in years 0,0% 100,0% 100,0%
% within Gender 0,0% 15,0% 5,5%
% of Total 0,0% 5,5% 5,5%
10 Count 1 0 1
Expected Count ,6 ,4 1,0
% within Period in years 100,0% 0,0% 100,0%
% within Gender 2,9% 0,0% 1,8%
% of Total 1,8% 0,0% 1,8%
11 Count 0 1 1
Expected Count ,6 ,4 1,0
% within Period in years 0,0% 100,0% 100,0%
% within Gender 0,0% 5,0% 1,8%
% of Total 0,0% 1,8% 1,8%
12 Count 2 0 2
Expected Count 1,3 ,7 2,0
% within Period in years 100,0% 0,0% 100,0%
% within Gender 5,7% 0,0% 3,6%
% of Total 3,6% 0,0% 3,6%
13 Count 0 1 1
Expected Count ,6 ,4 1,0
% within Period in years 0,0% 100,0% 100,0%8
Expected Count 1,3 ,7 2,0
% within Period in years 50,0% 50,0% 100,0%
% within Gender 2,9% 5,0% 3,6%
% of Total 1,8% 1,8% 3,6%
5 Count 1 1 2
Expected Count 1,3 ,7 2,0
% within Period in years 50,0% 50,0% 100,0%
% within Gender 2,9% 5,0% 3,6%
% of Total 1,8% 1,8% 3,6%
7 Count 1 1 2
Expected Count 1,3 ,7 2,0
% within Period in years 50,0% 50,0% 100,0%
% within Gender 2,9% 5,0% 3,6%
% of Total 1,8% 1,8% 3,6%
9 Count 0 3 3
Expected Count 1,9 1,1 3,0
% within Period in years 0,0% 100,0% 100,0%
% within Gender 0,0% 15,0% 5,5%
% of Total 0,0% 5,5% 5,5%
10 Count 1 0 1
Expected Count ,6 ,4 1,0
% within Period in years 100,0% 0,0% 100,0%
% within Gender 2,9% 0,0% 1,8%
% of Total 1,8% 0,0% 1,8%
11 Count 0 1 1
Expected Count ,6 ,4 1,0
% within Period in years 0,0% 100,0% 100,0%
% within Gender 0,0% 5,0% 1,8%
% of Total 0,0% 1,8% 1,8%
12 Count 2 0 2
Expected Count 1,3 ,7 2,0
% within Period in years 100,0% 0,0% 100,0%
% within Gender 5,7% 0,0% 3,6%
% of Total 3,6% 0,0% 3,6%
13 Count 0 1 1
Expected Count ,6 ,4 1,0
% within Period in years 0,0% 100,0% 100,0%8
% within Gender 0,0% 5,0% 1,8%
% of Total 0,0% 1,8% 1,8%
18 Count 1 1 2
Expected Count 1,3 ,7 2,0
% within Period in years 50,0% 50,0% 100,0%
% within Gender 2,9% 5,0% 3,6%
% of Total 1,8% 1,8% 3,6%
19 Count 0 1 1
Expected Count ,6 ,4 1,0
% within Period in years 0,0% 100,0% 100,0%
% within Gender 0,0% 5,0% 1,8%
% of Total 0,0% 1,8% 1,8%
20 Count 1 0 1
Expected Count ,6 ,4 1,0
% within Period in years 100,0% 0,0% 100,0%
% within Gender 2,9% 0,0% 1,8%
% of Total 1,8% 0,0% 1,8%
21 Count 1 0 1
Expected Count ,6 ,4 1,0
% within Period in years 100,0% 0,0% 100,0%
% within Gender 2,9% 0,0% 1,8%
% of Total 1,8% 0,0% 1,8%
27 Count 1 0 1
Expected Count ,6 ,4 1,0
% within Period in years 100,0% 0,0% 100,0%
% within Gender 2,9% 0,0% 1,8%
% of Total 1,8% 0,0% 1,8%
33 Count 1 0 1
Expected Count ,6 ,4 1,0
% within Period in years 100,0% 0,0% 100,0%
% within Gender 2,9% 0,0% 1,8%
% of Total 1,8% 0,0% 1,8%
36 Count 1 0 1
Expected Count ,6 ,4 1,0
% within Period in years 100,0% 0,0% 100,0%
% within Gender 2,9% 0,0% 1,8%
% of Total 1,8% 0,0% 1,8%
9
% of Total 0,0% 1,8% 1,8%
18 Count 1 1 2
Expected Count 1,3 ,7 2,0
% within Period in years 50,0% 50,0% 100,0%
% within Gender 2,9% 5,0% 3,6%
% of Total 1,8% 1,8% 3,6%
19 Count 0 1 1
Expected Count ,6 ,4 1,0
% within Period in years 0,0% 100,0% 100,0%
% within Gender 0,0% 5,0% 1,8%
% of Total 0,0% 1,8% 1,8%
20 Count 1 0 1
Expected Count ,6 ,4 1,0
% within Period in years 100,0% 0,0% 100,0%
% within Gender 2,9% 0,0% 1,8%
% of Total 1,8% 0,0% 1,8%
21 Count 1 0 1
Expected Count ,6 ,4 1,0
% within Period in years 100,0% 0,0% 100,0%
% within Gender 2,9% 0,0% 1,8%
% of Total 1,8% 0,0% 1,8%
27 Count 1 0 1
Expected Count ,6 ,4 1,0
% within Period in years 100,0% 0,0% 100,0%
% within Gender 2,9% 0,0% 1,8%
% of Total 1,8% 0,0% 1,8%
33 Count 1 0 1
Expected Count ,6 ,4 1,0
% within Period in years 100,0% 0,0% 100,0%
% within Gender 2,9% 0,0% 1,8%
% of Total 1,8% 0,0% 1,8%
36 Count 1 0 1
Expected Count ,6 ,4 1,0
% within Period in years 100,0% 0,0% 100,0%
% within Gender 2,9% 0,0% 1,8%
% of Total 1,8% 0,0% 1,8%
9
⊘ This is a preview!⊘
Do you want full access?
Subscribe today to unlock all pages.
Trusted by 1+ million students worldwide
1 out of 23
Related Documents


Your All-in-One AI-Powered Toolkit for Academic Success.
+13062052269
info@desklib.com
Available 24*7 on WhatsApp / Email
![[object Object]](/_next/static/media/star-bottom.7253800d.svg)
Unlock your academic potential
Copyright © 2020–2026 A2Z Services. All Rights Reserved. Developed and managed by ZUCOL.