Economics for Business: Smoking, Unemployment, and Policies
VerifiedAdded on 2023/06/05
|12
|3162
|257
Essay
AI Summary
This economics essay explores the economic aspects of cigarette smoking and unemployment, focusing on the Australian context. The essay begins by comparing cigarette smoking rates in India, Australia, and globally, followed by an analysis of supply and demand curves to illustrate the impact of excise taxes on cigarettes. It then delves into cost-benefit analysis, examining why governments aim to reduce smoking and why smokers should quit. The essay further evaluates various Australian policies designed to curb smoking, excluding taxes, and discusses the effectiveness of plain cigarette packaging. The second part of the essay examines the causes of different types of unemployment, including structural, cyclical, and frictional unemployment. It analyzes factors influencing the supply and demand of 15-24-year-old workers, and explores the reasons why young workers often prefer part-time or casual employment. The essay utilizes economic principles to provide a comprehensive analysis of these interconnected issues.

Running head: ECONOMICS FOR BUSINESS 1
Economics for business
Name of the student:
Name of the University:
Authors Note:
Economics for business
Name of the student:
Name of the University:
Authors Note:
Paraphrase This Document
Need a fresh take? Get an instant paraphrase of this document with our AI Paraphraser
1ECONOMICS FOR BUSINESS
Essay 1
1. Compare and contrast the rate of cigarette smoking in Australia with your country
and the world average rate.
For many years, India has been considered among the smoking nations. Smoking in India
is a common sight despite the government efforts trying to discourage it. In India, the habit of
smoking has affected both the young and old. According to reports, around six hundred twenty-
five children in India between the age of ten and fourteen smoke cigarettes daily. Noonan (2016)
noted that over 195,500 girls and 429,500 boys smoked cigarettes in 2015. While compared with
other nations across the world, India has a small percentage of young smokers compared to the
average number of smokers captured from other countries worldwide. To note most of the
cigarette companies have always been targeting the young population of India by using cunning
processes that were used in the United States. It is estimated that over 4,000 Indian women and
13men give every week as a result of long time smoking. In India, smoking is regarded as a public
health problem that requires the government to design measures for protecting the young
generation (Norton, 2012).
According to the Australian welfare and Health institution, smoking in Australia started
way back in 1945. it is estimated that around 14,900 Australian people die every financial year as
a result of smoke-related diseases (Oreopoulos et al., 2012). In addition, Australia always has
four preventable deaths daily. Further, most of the smoking death occurs at the age of sixty-five
compared to India (Cassidy & Parsons, 2017). However, the young generation between the age
of 35 and 64 also die of smoking tobacco. According to records, around seventy-five percent of
people who died in the fiscal year 2004-05 was due to cancer In Australi, lung cancer is
considered to be the most cause of death (Oreopoulos & Petronijevic, 2013). In Australia,
2ECONOMICS FOR BUSINESS
fourteen percent of people within the age of 18 smoke. According to 2016 statistics, the rate of
the male who smoked was sixteen percent and twelve percent for female including those who
smoked weekly and daily. To note, the adult age groups smoked more compared to the young
ones. In addition, the age group of 40-49 and 25-29 had a higher rate of smoking compared to
other groups. Reviewing the Global Health Observatory data of 2015, around 1.1 billion
individuals smoked tobacco worldwide. Male smoked tobacco compared to female. In addition,
it is noted that tobacco smoking has declined worldwide. However, tobacco smoking is
considered to be increasing in the Mediterranean regions and Africa (Kemp & Norton, 2014).
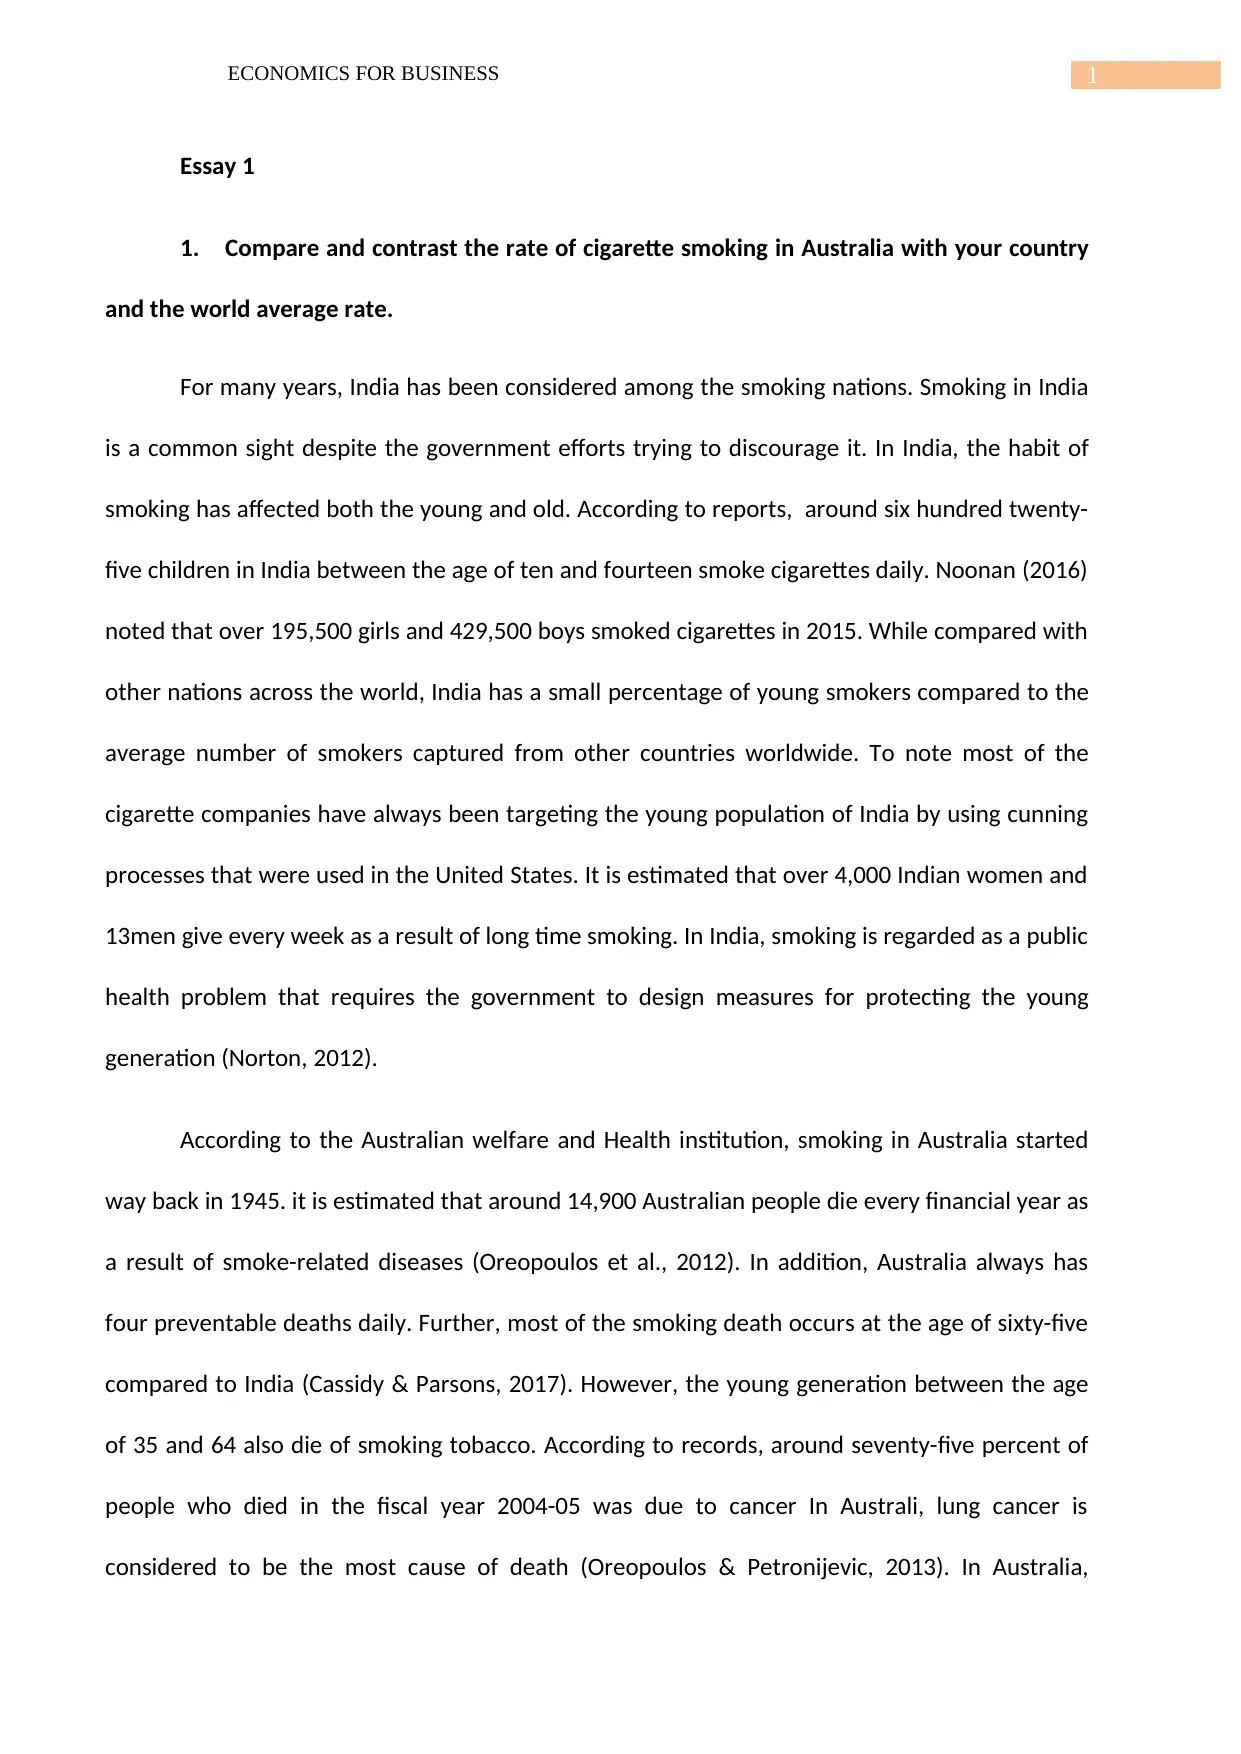
2. Draw and label fully a supply and demand curve diagram to explain how an excise
tax on cigarette affects
- Demand for the cigarette when demand is inelastic compared with elastic.
- Tax revenue for the government
Figure1. Graph showing inelastic demand and elastic demand for cigarettes (Kemp &
Norton, 2014).
Discussion:
fourteen percent of people within the age of 18 smoke. According to 2016 statistics, the rate of
the male who smoked was sixteen percent and twelve percent for female including those who
smoked weekly and daily. To note, the adult age groups smoked more compared to the young
ones. In addition, the age group of 40-49 and 25-29 had a higher rate of smoking compared to
other groups. Reviewing the Global Health Observatory data of 2015, around 1.1 billion
individuals smoked tobacco worldwide. Male smoked tobacco compared to female. In addition,
it is noted that tobacco smoking has declined worldwide. However, tobacco smoking is
considered to be increasing in the Mediterranean regions and Africa (Kemp & Norton, 2014).
2. Draw and label fully a supply and demand curve diagram to explain how an excise
tax on cigarette affects
- Demand for the cigarette when demand is inelastic compared with elastic.
- Tax revenue for the government
Figure1. Graph showing inelastic demand and elastic demand for cigarettes (Kemp &
Norton, 2014).
Discussion:
⊘ This is a preview!⊘
Do you want full access?
Subscribe today to unlock all pages.
Trusted by 1+ million students worldwide
3ECONOMICS FOR BUSINESS
When the demand for cigarette elastic, most of the tax burden is suffered by the
producers leading to the slight shift of quantity demanded from Q2-Q1. On the other hand,
when demand for the cigarette is inelastic, the consumer safer a bigger tax burden. The quantity
of cigarette of supplied shifts from Q1 -Q2 while prices slow down form P1-P0 (Kahn, 2010).
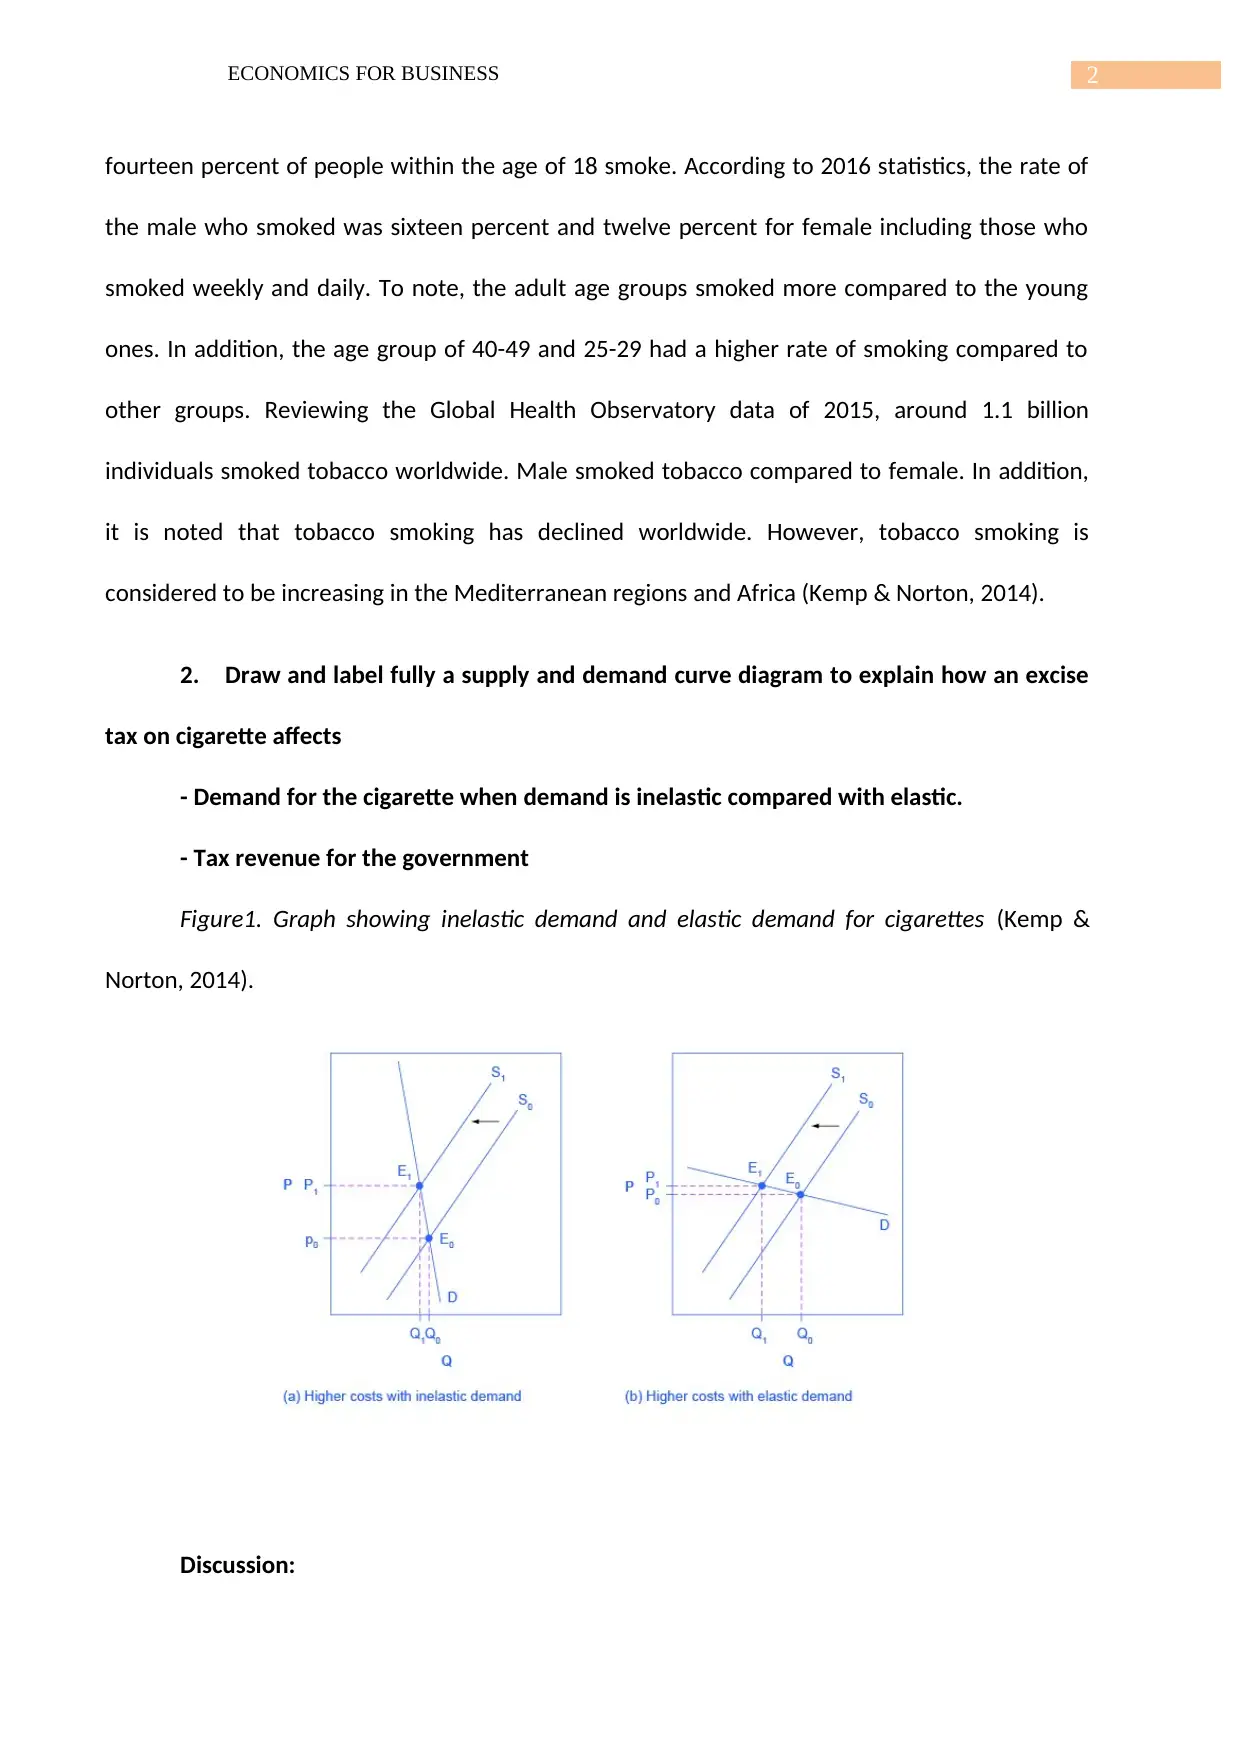
Figure two: Graph showing the impact of the excise tax on cigarette towards the revenue
for the government
-
Discussion
In the figure above, the deadweight loss illustrates the cost of imposing excise duty on
the consumption of cigarettes. The figure indicates that the government revenue reduces in case
it imposes excise duty on cigarettes. The reduction in government revenue form 20-10 is a result
of higher elastic demand and higher elastic supply of the product (Dow, 2013).
3. Explain the idea of cost versus benefit when making decisions. Use the idea to
analyze as to why: the government wishes to reduce the rate of smoking and a smoker as they
age should quit smoking.
When the demand for cigarette elastic, most of the tax burden is suffered by the
producers leading to the slight shift of quantity demanded from Q2-Q1. On the other hand,
when demand for the cigarette is inelastic, the consumer safer a bigger tax burden. The quantity
of cigarette of supplied shifts from Q1 -Q2 while prices slow down form P1-P0 (Kahn, 2010).
Figure two: Graph showing the impact of the excise tax on cigarette towards the revenue
for the government
-
Discussion
In the figure above, the deadweight loss illustrates the cost of imposing excise duty on
the consumption of cigarettes. The figure indicates that the government revenue reduces in case
it imposes excise duty on cigarettes. The reduction in government revenue form 20-10 is a result
of higher elastic demand and higher elastic supply of the product (Dow, 2013).
3. Explain the idea of cost versus benefit when making decisions. Use the idea to
analyze as to why: the government wishes to reduce the rate of smoking and a smoker as they
age should quit smoking.
Paraphrase This Document
Need a fresh take? Get an instant paraphrase of this document with our AI Paraphraser
4ECONOMICS FOR BUSINESS
The idea of cost versus benefits refers to the act of choosing the advantage of a given
action to be more likely to out compete the other. The action involves the engagement of
analyzing the cost benefits of a given action. For example, the government may decide to reduce
the rate of smoking with an intention of limiting its disadvantages. Therefore, the government
considers reducing the rate of smoking as the benefit because of smoking of cigarettes causes
diseases to people (Daniels, 2017). The government indicates smoking as a cost because it
causes diseases to people such as lung cancer. Further, the government considers smoking as a
cost because it invests the high amount of money treating people suffering from lung cancer
every year. However, smoking is also considered as a benefit to the government a benefit
because it generates revenue for the government through taxing companies which manufacture
the product and imports of cigarettes. Therefore, if the government wishes to reduce the rate of
smoking, I should look at the most impact of the decision. Further, the government exerts that
the revenue generated from taxing cigarette importation and production is then invested in
treating the sick people. Therefore, smoking is a cost not a benefit to the government
(Department of Education and Training, 2015).
As smokers age, they should quit smoking because it causes diseases to their health. As
people continue smoking they become addicted and suffer from various physical and health
diseases such as a cough. therefore, smoking in aging people is a cost because it has no benefit
to them rather causing diseases. In addition, smoking is a cost because it wastes an individual’s
money in purchasing it and treating diseases that result from form continued use (Dandolo,
2014).
4. Describe and evaluate the various policies over the years (other than tax on
smoking) that the Australian and state governments have enacted in order to reduce smoking
5ECONOMICS FOR BUSINESS
As a way of reducing the rate of smoking, the government of Australia has enacted
various policies other than tax on smoking. In this case, the government of Australia put a law
that regulates smoking while in a car driving in case children below 16byears are inside. the ban
or policy applies to passengers and drivers whether the vehicle is either stationary or moving. If
an individual is convicted of violating the law, it is penalized with a minimum penalty of $75 and
a maximum of $200. The government of Australia also imposed a ban on smoking from drinking
place and outdoors apart forms the outdoors that are licensed and meant for smoking. In
addition, smoking is banned at the time when food is being provided created or consumed.
Further, all areas where tables and tables are provided for people to consume their purchased
food. Further, liquor license rates such as taverns, clubs, and pubs may design a given portion of
their licensed area as an outdoor for smoking (Productivity Commission, 2016).
5. Finally, in this easy, you must answer the implications of the topic by answering
the following questions based on the above article
i. What does the article argue about the effectiveness of plain packaging of cigarettes
in reducing rates?
The article argues that plain cigaret packing has been implemented as a policy of
reducing the use of cigarettes and its associated mortality and mobility. In addition, the article
illustrates that the policy is intended to create awareness of the use of cigarette inform of
recommended warning labels converting the message about the risk associated with smoking. in
addition, the article argues that the graphics should contain warning labels on both the front and
the back surface of the pack (Productivity Commission, 2016).
ii. What ramification and implication are drawn by this research?
⊘ This is a preview!⊘
Do you want full access?
Subscribe today to unlock all pages.
Trusted by 1+ million students worldwide
6ECONOMICS FOR BUSINESS
The ramifications and implications are drawn from the research indicate that plain
packing of cigarette is a way of reducing the use of cigarette in the public. In addition, plain
packaging helps in regulating the strips of different cigarette packs for various branding elements
such as logos, and colors that all packages have a single color for example red but just indicate
their brand names (Productivity Commission, 2016).
Essay 2
1. What are the causes of the following types of unemployment?
Structural unemployment, this is caused by the advancement in technology.
Technological advancement takes place in manufacturing industries for example robotics which
has been used instead of the unskilled workers. Structural unemployment may also be caused
by supply break down or rigidities with the economy. It is one the types of unemployment that is
unavoidable especially where the economy is advancing from one level to another. Cyclical
unemployment, this is caused by a reduction or drop in demand. The type of unemployment
starts with a reduction in the consumption. Unemployment. This type of unemployment is
clearly explained by JB Keynes. In other words the fall in the total demand of goods and services
in an economy causes cyclical form of Friction unemployment, this is caused by individual staying
on a single job until when they get another one. Underemployment, this is caused by changes in
the technology such as ATM machine. Hidden unemployment, this is caused by individuals who
work with companies but they don't demonstrate their skills (Organisation for Economic Co-
operation and Development, 2016).
2. Using the information from the captioned article as your guide, use supply and
demand curve and analyze the factors causing changes in the supply of 15 to 24-year-old
workers over time and factors causing an increase in demand for 15 to 24-year-old workers.
Paraphrase This Document
Need a fresh take? Get an instant paraphrase of this document with our AI Paraphraser
7ECONOMICS FOR BUSINESS
Considering the information from the captioned article the changes in the supply of 15 to
24-year-old workers over time are; high levels of education in Australia. In this case, if the area
has very many educated people, there will be more supply of the labor force. On the other hand,
the decrease in the supply of workers between 15-24years is as a result of limited skills or
qualification to perform the task. in this case, if the majority of the youth are still in school,
companies labor supply becomes law. Further, a decrease in the supply of 15 to 24-year-old
workers could also be as a result of poor working poor working conditions which is forcing the
workers to lose morale (Quality Indicators for Learning and Teaching, 2018).
On the other hand, an increase in the demand for 15 to 24-year-old workers as illustrated
on the graph maybe as a result of industrialization. In this case, industrial development requires
more labor both skilled and unskilled. In addition, the high demand for labor could be as a result
of increased productivity for manufacturing industries. To note, if the company is producing
more product, it will require more labor to assist it production (Watson, 2018).
3. Describe and evaluate the factors that are driving the fact that 15-24yera old work
part-time or casual rather than full time.
In this case, 15-24-year-old workers are part-time or casual rather than full time because
most of the youth at that age in Australia are students. In addition, very many fresh graduates in
Australia lack skills that can enable them to be full-time employees. Further, there could also be
a problem of mismatch in qualification or skills. In this case, most graduates find a challenge of
finding full-time jobs which are in line with their skills. In this case, most of the graduates are
required to first part-time or volunteer in order to gain the skills in the job obtained (Australian
Government, 2009).
8ECONOMICS FOR BUSINESS
4. Describe and evaluate the factors that are driving the fact that 15-24yera old work
part-time or casual rather than full time.
For the past years, the rate of underemployment among the youth has increased. As a
result of the decline in full-time employment among the youth by 20%, the rate of
underemployment. Since 2014, the rate of unemployment among the youth has declined. The
underemployed youth in Australia have an opportunity to work for an extra eleven hours in a
week. Therefore, the increase in the working hours for most of the Australian jobs has limited
the chances of students to work. Before the world financial crisis, the unemployment rate was
below ten percent compared to underemployment which was eleven percent. An increase in the
rate of underemployment is as a result of few working hours by most of the youth. On the other
hand, the higher rate of unemployed youth is due to the domination of the old people who don't
wish to retire (Anlezak, 2011).
5. Compare and contrast rates of youth unemployment in Australia with your home
country and the world average. Analyse the factors behind these differences or similarities.
The rate of unemployed youth in Australia has greatly increased from 11.10% in July to
11.70% in July 2018. The average rate of the unemployed youth across Australia is 13.43%
compared to 20.10% in 1992. On the other hand, the rate of unemployment among the youth in
India is considered to be 12.90% in 2018 compared to 15.50% in 2012. According to GENEVA
news, the rate of unemployed youth across the globe is estimated to be 13.6% for 2018
compared to 12.9% in 2017. The similarities in the rate of youth unemployment are as a result of
the slow development of economies across the world. In this case, the economic growth rate of
the world for 2016 was estimated at 3.2% compared to 0.4% in 2015. To note, most of the
emerging countries face a high rate of youth unemployment (Bishop et al., 2016).
⊘ This is a preview!⊘
Do you want full access?
Subscribe today to unlock all pages.
Trusted by 1+ million students worldwide
9ECONOMICS FOR BUSINESS
References
Anlezark, A. (2011). ‘Young People in an Economic Downturn', Longitudinal Surveys of
Australian Youth. Briefing Paper 23, NCVER. Available at.
Australian Government. (2009). ‘Compact with Young Australians’.
Bishop J, L Gustafsson and M Plumb. (2016). ‘Jobs or Hours? Cyclical Labour Market
Adjustment in Australia’, RBA Research Discussion Paper No 2016-06.
Cassidy, N., and S, Parsons. (2017). ‘The Rising Share of Part-time Employment’, RBA
Bulletin,
Dandolo, Partners. (2014). ‘Evaluation of the National Partnership on Youth Attainment and
Transitions', a report for the Department of Education.
Daniels, D. (2017). ‘Student Income Support: A Chronology’, Parliament of Australia
Research Paper Series.
Department of Education and Training. (2015). ‘Higher Education Funding in Australia: A
review of reviews from Dawkins to today’.
Dow, C. (2013). ‘Higher Education: Sustainability of a Demand-driven System’, Parliamentary
Library Briefing Book: Key Issues for the 44th Parliament.
Paraphrase This Document
Need a fresh take? Get an instant paraphrase of this document with our AI Paraphraser
10ECONOMICS FOR BUSINESS
Kahn, L. (2010). ‘The Long-Term Labor Market Consequences of Graduating from College in
a Bad Economy’, Labour Economics, Elsevier, vol. 17(2), pp 303-16, April.
Kemp, D., and A, Norton. (2014). ‘Review of the Demand Driven Funding System Report’,
Department of Education.
Noonan, P. (2016). ‘VET Funding in Australia: Background, trends, and future directions',
Mitchell Institute, Melbourne, March. Available at <
http://www.mitchellinstitute.org.au/wp-content/uploads/2016/03/VET_funding_in_
Australia_Background_trends_and_future_directions.pdf>.
Norton, A. (2012). ‘Graduate Winners: Assessing the public and private benefits of higher
education’, Grattan Institute, August. Available at < https://grattan.edu.au/wp-
content/uploads/2014/04/ 162_graduate_winners_report.pdf>.
Oreopoulos P and U Petronijevic. (2013). ‘Making College Worth It: A Review of Research on
the Returns to Higher Education’, NBER (National Bureau of Economic Research)
Working Paper No. 19053.
Oreopoulos P, T von Wachter and A Heisz. (2012). ‘The Short- and Long-Term Career Effects
of Graduating in a Recession’, American Economic Journal: Applied Economics, 4 (1),
pp 1–29.
Organisation for Economic Co-operation and Development (OECD). (2016). ‘Investing in
Youth: Australia’, Investing in Youth, OECD Publishing, Paris, September.
Productivity Commission (2016), ‘Migrant Intake into Australia’, Inquiry Report No.
77, Canberra,

11ECONOMICS FOR BUSINESS
Quality Indicators for Learning and Teaching (QILT). (2018). ‘2017 Graduate Outcomes
Survey’, National Report, January.
Watson, I. (2018), ‘Life Course Research Using Sequence Analysis: Insights into the Youth
Labour Market', Seminar at the Social Policy Research Centre, UNSW, 13 March.
Available at.
⊘ This is a preview!⊘
Do you want full access?
Subscribe today to unlock all pages.
Trusted by 1+ million students worldwide
1 out of 12
Related Documents


Your All-in-One AI-Powered Toolkit for Academic Success.
+13062052269
info@desklib.com
Available 24*7 on WhatsApp / Email
![[object Object]](/_next/static/media/star-bottom.7253800d.svg)
Unlock your academic potential
Copyright © 2020–2026 A2Z Services. All Rights Reserved. Developed and managed by ZUCOL.