An Investigation: SNAP Program and Household Food Consumption
VerifiedAdded on 2023/01/13
|22
|5220
|63
Report
AI Summary
This report examines the impact of the Supplemental Nutrition Assistance Program (SNAP) on food consumption among low-income households in the United States. Using a difference-in-differences approach and data from 2000 to 2018, the study investigates the relationship between SNAP benefits and weekly household food expenditures. The research addresses the research objective to examine how SNAP influences food consumption among the low-income work force in the United States, and the research questions, "Is there a difference between the household food expenditures of SNAP beneficiaries and those who do not receive SNAP benefits?" and "Does SNAP affect the beneficiaries’ food consumption?" The study found that SNAP participation impacts household expenditures allocated to food, with recipients spending less per week on food overall, but increasing expenditures after the 2009 expansion. The methodology includes regression analysis using OLS regression, and the study makes use of nutrition survey data. The findings suggest that SNAP benefits play a significant role in shaping food consumption patterns among low-income populations.
IMPACT OF THE SNAP PROGRAM ON FOOD CONSUMPTION
Paraphrase This Document
Need a fresh take? Get an instant paraphrase of this document with our AI Paraphraser
Executive Summary
Hunger, food insecurity and malnutrition are major public health challenges affecting
many low-income Americans. The Supplemental Nutrition Assistance Program (SNAP) serves
as the US agency to assist low-income sections of the US population towards improving food
security and improving nutrition. SNAP has grown rapidly over the past few years, with the
number of participants increasing by roughly 300% between 2000 to 2015. The dramatic
increase has led to a series of studies being conducted to investigate its impact on recipients’
food consumption habits.
Various researchers have proved that SNAP is highly effective at alleviating food
insecurity and improving nutrition. “SNAP has improved food security and reduced poverty for
millions of Americans” (U.S. Department of Agriculture, 2015).” SNAP has helped “an average
of 45.8 million individuals per month in the year 2015. (U.S. Department of Agriculture, 2015).”
The program has been found to have far-reaching short-term and long-term benefits on
participants from low-income households. “A recent study (by Nord and Prell, 2011) suggests
that ARRA (American Recovery and Reinvestment Act of 2009) led to roughly a 12 percent
increase in benefits for the typical SNAP recipient and lifted roughly 8 percent, or 530,000
households, out of food insecurity.” Food assistance to the low-income earners leads to a
reduction in hunger rates and improvements in health and academic performance among
beneficiary children.
The primary aim of the current study was to investigate the impact of receiving SNAP
benefits on weekly household food expenditures. The study used the difference in differences
technique where subjects were studied for the differential impacts of SNAP program benefits on
food expenditure. The study examined the impact of SNAP benefits on food expenditures from
2000-2018, using an interaction variable that compares expenditures before 2009 with
expenditures from 2009 to 2018 (after an expansion of SNAP benefits took place). Regression
analysis (using OLS regression) was conducted for purposes of analyzing the data. The study
made use of nutrition survey data available at https://cps.ipums.org/cps/index.shtml.
A key finding of the study is that participation in the SNAP program impacts household
expenditures allocated to food. In general, respondents who received SNAP benefits spent about
$10 less per week on food than households that did not receive SNAP benefits. However,
household food expenditures were about $1.50 higher among respondents who received SNAP
benefits from 2009-2018. This appears to show that people who participate in the SNAP program
end up increasing resource allocation to food expenditure during the time period studied.
⊘ This is a preview!⊘
Do you want full access?
Subscribe today to unlock all pages.
Trusted by 1+ million students worldwide
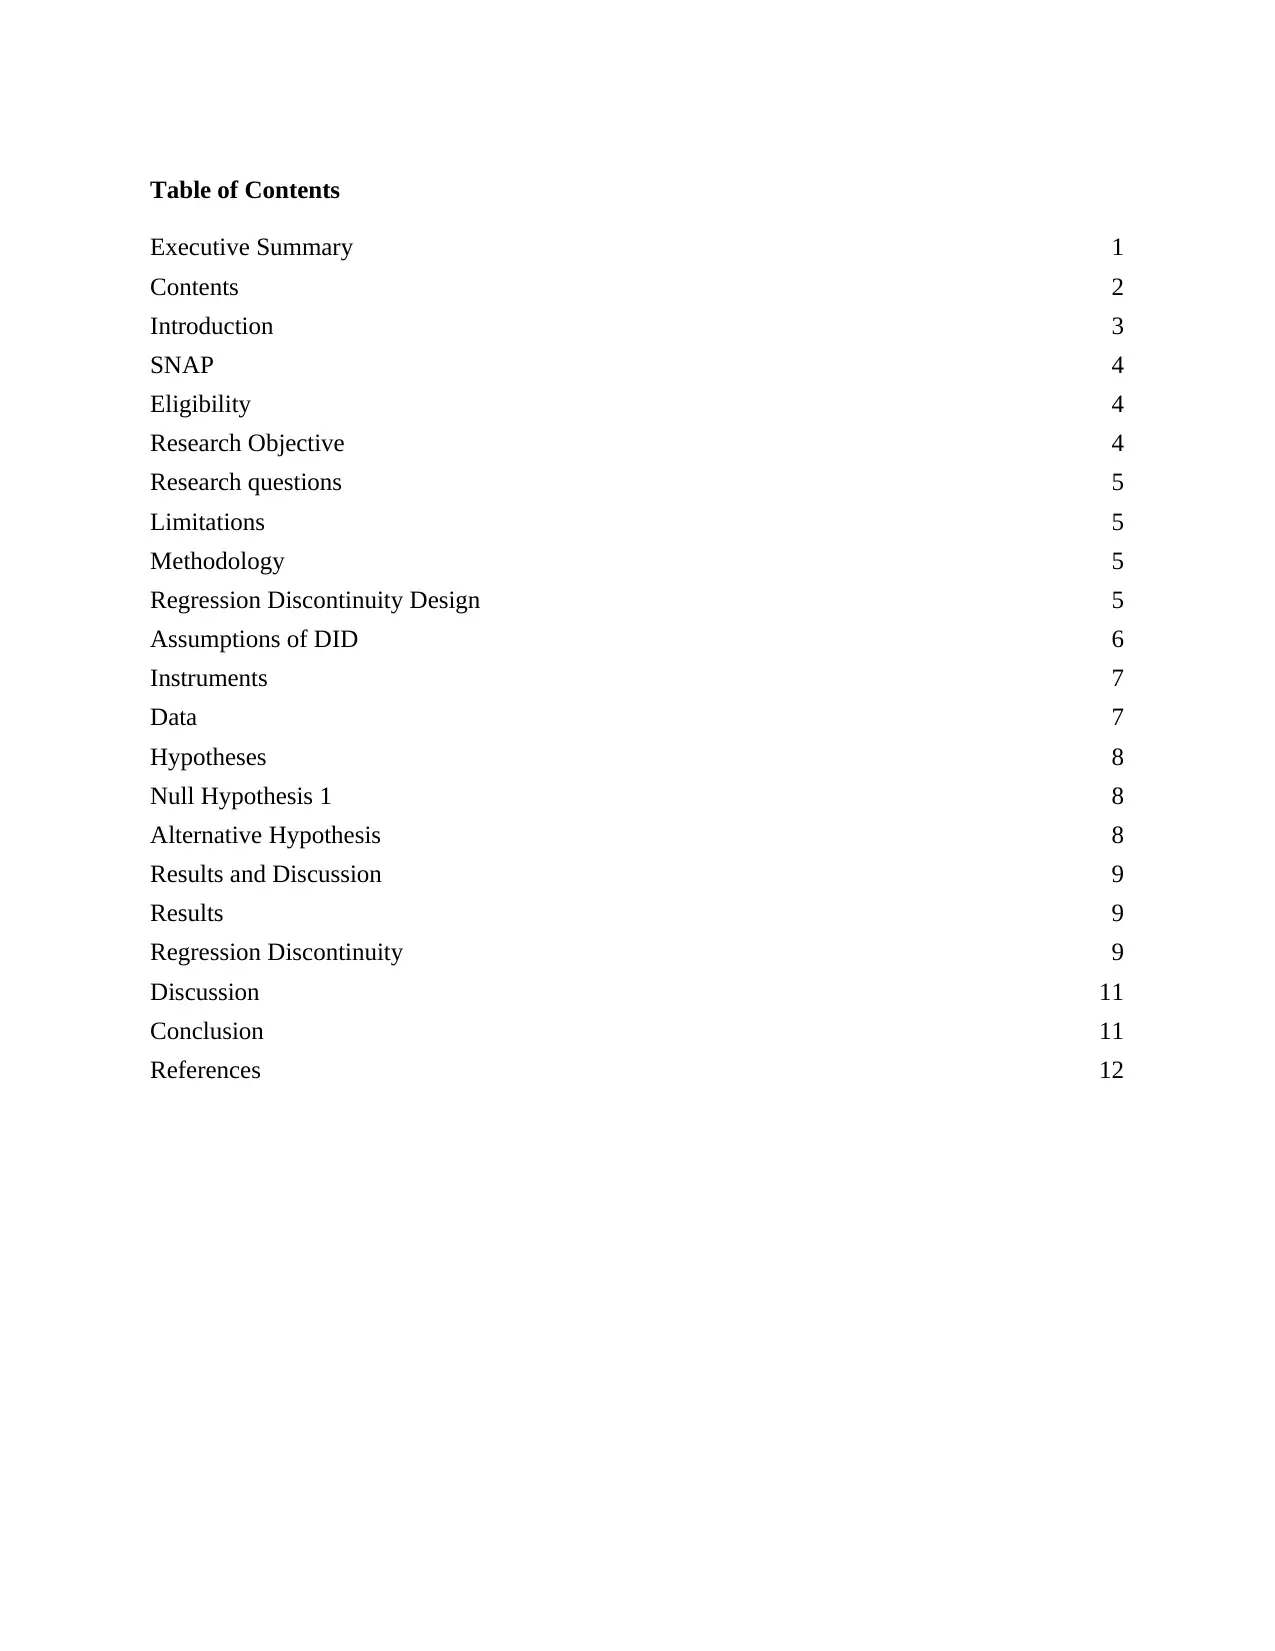
Table of Contents
Executive Summary 1
Contents 2
Introduction 3
SNAP 4
Eligibility 4
Research Objective 4
Research questions 5
Limitations 5
Methodology 5
Regression Discontinuity Design 5
Assumptions of DID 6
Instruments 7
Data 7
Hypotheses 8
Null Hypothesis 1 8
Alternative Hypothesis 8
Results and Discussion 9
Results 9
Regression Discontinuity 9
Discussion 11
Conclusion 11
References 12
Paraphrase This Document
Need a fresh take? Get an instant paraphrase of this document with our AI Paraphraser
Introduction
The primary objectives of the United States Department of Agriculture (USDA) are
improvement of food security, reduction of hunger through enabling more access to food,
promoting consumption of healthy diets, and conducting nutrition education among low-income
Americans (Ratcliffe, McKernan, & Zhang, 2011). To realize the department’s objective, some
of the programs designed by USDA include the “Supplemental Nutrition Assistance Program
(SNAP), Special Supplemental Nutrition Program for Women, Infants, and Children (WIC), and
the National School Lunch and School Breakfast (School Meals) Programs” (Fraker and
Devaney, 2013).
SNAP is the largest program that assists people and families in the United States who are
suffering from hunger issues. “It offers nutrition assistance to millions of eligible, low-income
individuals and families” who are in need of it and “provides economic benefits to communities”
(U.S. Department of Agriculture, 2015). It has “helped over more than 40 million Americans”
(Center on Budget and Policy Priorities, 2018). Snap is very well known for the infamous
program it is offering to people that need it which is the Food Stamp Program. The cost to use
SNAP in the United states is covered by the government and the different states who use SNAP.
The total cost of SNAP sums up to approximately 70 billion USD per fiscal year (Nord & Prell,
2011). After the 2009 expansion that occurred “food expenditures increased by 5.4% and food
insecurity declined by 2.2%” (Nord & Prell, 2011).
SNAP benefits can be enjoyed by almost all households with low incomes. Who gets
SNAP benefit is set by the government and the choice that the government makes of who is
eligible to get SNAP is the same across the nation, although some states can alternate specific
rules of the program. An example is that in some states have different qualifications of who can
get SNAP depending on the “value of a vehicle or a household they might own”. In most cases in
order to be able to get SNAP one must be making under a specific income per year or the
families income is not enough to support it. There are also specific “categories of people who are
not eligible for SNAP regardless of how small their income or assets may be” (U.S. Department
of Agriculture, 2015). These categories of people include “strikers, college students, legal
immigrants and illegal immigrants also are not eligible for SNAP” (U.S. Department of
Agriculture, 2015).
According to Center on Budget and Policy Priorities an “average SNAP recipient
receives $126 a month which $4.20 a day or $1.40 per meal” (Center on Budget and Policy
Priorities, 2018). Depending on the specific income of a household SNAP benefits received are a
bit different and offer a more suitable food program which is more appropriate to it. This means
that in some cases poorer households enjoy more benefits than wealthier households (Center on
Budget and Policy Priorities, 2018).
Today, the SNAP program is implemented through issuance of monthly benefits to
beneficiaries i.e. in the form of Electronic Benefit Transfer (EBT) which are used when making
purchases at selected consumer stores (Carlson et al., 2017). In 2013 there was an estimated $275
per benefits for each household per month, that is $133 per person (Schmier, 2015). However,
the program’s implementation and benefits have changed very little over time with just the same
framework adopted approximately 50 years ago being adopted in the program today (Kim,
2015). The foods included in the SNAP program include breads and cereals, fruits and
vegetables, meats, fish and poultry, dairy products, seeds and plants that produce food for
household consumption.
⊘ This is a preview!⊘
Do you want full access?
Subscribe today to unlock all pages.
Trusted by 1+ million students worldwide
Many people across the country believe that SNAP has affected positively the United
States a big deal and the hunger rate has fallen (Center on Budget and Policy Priorities, 2018).
SNAP had more than 42 million participants in the fiscal year 2017 which amounts to 13 % of
the total population (Center on Budget and Policy Priorities, 2018). More than “68 % of SNAP
participants were families with children”. SNAP has benefited also a lot of people who are
currently not in the workforce or are unemployed. SNAP helps the unemployed to be able to buy
groceries so they can support their family (Center on Budget and Policy Priorities, 2018).
Research Objective
The objective of this study is to examine how the Supplemental Nutrition Assistance
Program influences food consumption among the low-income work force in the United States.
As such, using data from 2000-2018, a regression model is used to examine whether a
relationship exists between receipt of SNAP benefits and weekly household expenditures on food
after the expansion of the SNAP program that happened in 2009. In this particular research 2009
was identified as the cutoff point for performing this experiment. The year 2009 was selected
because that was the year that the expansion happened in the SNAP program and it would be an
ideal cutoff point because results would show clear differences of household expenditures on
food consumption for families that received SNAP before and after that point. Moreover, the
research adopts a DID (difference in differences) design which upon proper design,
implementation and analysis, provides an unbiased estimate of the local treatment effect, making
it approximately as good as a randomized experiment when trying to measure a treatment effect.
Paraphrase This Document
Need a fresh take? Get an instant paraphrase of this document with our AI Paraphraser
Research questions
After addressing the research objective, we hope to answer the following questions:
Is there a difference between the household food expenditures of SNAP beneficiaries and
those who do not receive SNAP benefits?
Does SNAP affect the beneficiaries’ food consumption?
Eligibility for SNAP Benefits
The SNAP program is funded by the federal government and eligibility criteria are
determined by the federal government. For households to be eligible for SNAP benefits, they
must have a monthly income less that 130 percent of the official poverty line. The eligible
households receive SNAP benefits every month. Since 2004, eligible households have benefited
in form of Electronic Benefit Transfer cards, which they can use to purchase food items.
The sample in the data which was used for this study was restricted to a subsample of the
data with a higher probability of being eligible for participation in the SNAP program. Only
households with gross income below 130% of the poverty line were considered for the analyses
(Findeis, 2011). The calculation of the poverty line was conducted using the 1998-2009 poverty
guidelines issued by the U.S. Department of Health & Human Services (HHS). The SNAP
benefits are intended to help improve nutrition among low-income households in the United
States.
Limitations
The model used in this study has estimated effects which are only unbiased as long as the
functional form of the relationship between the treatment and outcome is correctly modeled
otherwise the results are prone to bias. Moreover, other treatments might contaminate the chosen
t. Treatment variable if different treatments occur on the same cut-off points of the original
assignment variables.
Limitations that are identified in this research is that the treated group differs from
untreated group in important ways and so interaction is correlated with error. Additionally, there
are time trends such as the expenditures that were already rising faster among the newly eligible
group. In the research conducted something else changed at the same time so one can’t tell
what is responsible for the results obtained.
Methodology
Difference in Differences
The difference in differences (DID) design is a statistical analysis technique used in
quantitative research. It tries to emulate the experimental design technique of research. Using the
difference in differences technique, we investigate the differential impact of a treatment on an
experimental group in comparison with the control group in a natural experiment. The impact of
treatment on the response variables is calculated. That is, the average change in the response
variable over time on the experimental group is compared to the average change in the response
variable over time for the control group. In this particular research, they DID method is useful
because the SNAP program changed in 2009. Testing the effects of the SNAP expansion is
similar to studying the results of an experiment by comparing the experimental group – SNAP
recipients after 2009 – to the control group households before 2009.
The essence of this technique of research is that it helps in mitigating some effects of
extraneous variables and bias as a result of group selection. This is because the difference in
differences technique makes use of randomization in the selection of groups and subjects.
⊘ This is a preview!⊘
Do you want full access?
Subscribe today to unlock all pages.
Trusted by 1+ million students worldwide
However, the difference in differences method may still be subject to some biases, for instance
regression bias, reverse causality bias and the omitted variable bias, which I discuss in greater
detail in the “Discussion” section.
To guarantee the accuracy of the DID model, the characteristics of subjects of the
experimental and control groups are expected to remain unchanged over periods. This is because
extraneous factors such as change in subject characteristics over time may adversely compromise
results of the model.
Instruments
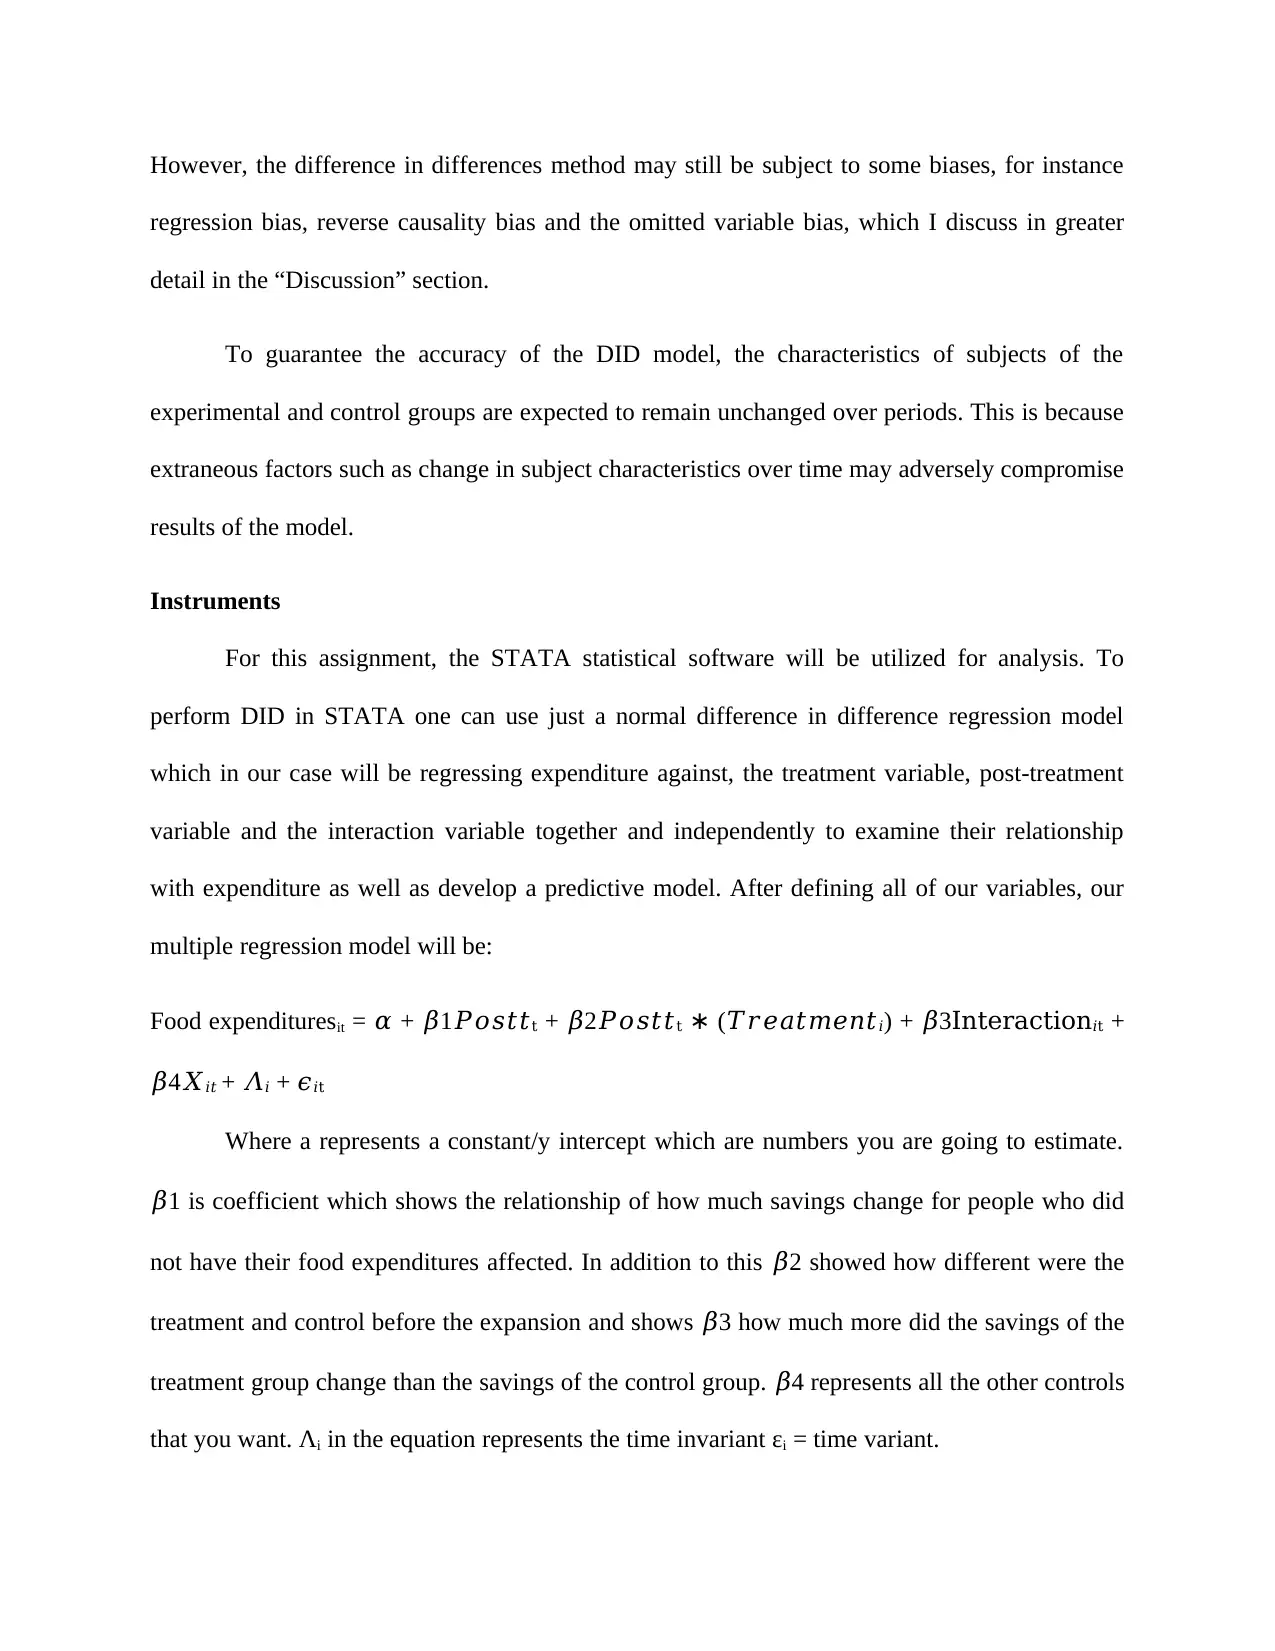
For this assignment, the STATA statistical software will be utilized for analysis. To
perform DID in STATA one can use just a normal difference in difference regression model
which in our case will be regressing expenditure against, the treatment variable, post-treatment
variable and the interaction variable together and independently to examine their relationship
with expenditure as well as develop a predictive model. After defining all of our variables, our
multiple regression model will be:
Food expendituresit = 𝛼 + 𝛽1𝑃𝑜𝑠𝑡𝑡t + 𝛽2𝑃𝑜𝑠𝑡𝑡t ∗ (𝑇𝑟𝑒𝑎𝑡𝑚𝑒𝑛𝑡𝑖) + 𝛽3Interaction𝑖t +
𝛽4𝑋𝑖𝑡 + 𝛬𝑖 + 𝜖𝑖t
Where a represents a constant/y intercept which are numbers you are going to estimate.
𝛽1 is coefficient which shows the relationship of how much savings change for people who did
not have their food expenditures affected. In addition to this 𝛽2 showed how different were the
treatment and control before the expansion and shows 𝛽3 how much more did the savings of the
treatment group change than the savings of the control group. 𝛽4 represents all the other controls
that you want. Λi in the equation represents the time invariant εi = time variant.
regression bias, reverse causality bias and the omitted variable bias, which I discuss in greater
detail in the “Discussion” section.
To guarantee the accuracy of the DID model, the characteristics of subjects of the
experimental and control groups are expected to remain unchanged over periods. This is because
extraneous factors such as change in subject characteristics over time may adversely compromise
results of the model.
Instruments
For this assignment, the STATA statistical software will be utilized for analysis. To
perform DID in STATA one can use just a normal difference in difference regression model
which in our case will be regressing expenditure against, the treatment variable, post-treatment
variable and the interaction variable together and independently to examine their relationship
with expenditure as well as develop a predictive model. After defining all of our variables, our
multiple regression model will be:
Food expendituresit = 𝛼 + 𝛽1𝑃𝑜𝑠𝑡𝑡t + 𝛽2𝑃𝑜𝑠𝑡𝑡t ∗ (𝑇𝑟𝑒𝑎𝑡𝑚𝑒𝑛𝑡𝑖) + 𝛽3Interaction𝑖t +
𝛽4𝑋𝑖𝑡 + 𝛬𝑖 + 𝜖𝑖t
Where a represents a constant/y intercept which are numbers you are going to estimate.
𝛽1 is coefficient which shows the relationship of how much savings change for people who did
not have their food expenditures affected. In addition to this 𝛽2 showed how different were the
treatment and control before the expansion and shows 𝛽3 how much more did the savings of the
treatment group change than the savings of the control group. 𝛽4 represents all the other controls
that you want. Λi in the equation represents the time invariant εi = time variant.
Paraphrase This Document
Need a fresh take? Get an instant paraphrase of this document with our AI Paraphraser
Post is a dummy variable equal to 1 after 2009 which is the cut-off point in our
hypothesis and Interaction is the product of the two other dummy variables. Moreover, 𝛬𝑖 is a
year fixed effect 𝑋𝑖𝑡 is a vector of controls (number of children, family size).
t represents could be years from 2000 until 2018. Sub i = means that is varies across
observations and sub t it means that is varies across time
Food expenditures it which includes sub i + sub t, varies for individuals and time t is the
amount saved by an individual I in year t. If the individual received SNAP benefits or not after
2009.
Post does not vary among individuals, but varies over time, dummy variable equal to 1 if
for years after 2009. Treatment varies for individuals but does not vary over time, a dummy
variable equal to 1 if an individual received SNAP benefits, and 0 if he is not.
Interaction changes through time and for individuals. It is dummy variable to the product
of post and treatment of the dummy variable post and treatment. X varies among people and time
and a only changes individuals. ε which is the Error must have an i because it is individual
component and It changes for individuals in that specific situation.
Furthermore, fixed effects are a way of controlling characteristic about individuals that
do not changed over time and their race, gender do not change as well. Fixed effects are
variables that do no change over time. Location is also very common fixed effect.
The difference in differences technique operates on a set of assumptions, similar to the
Ordinary Least Squares (OLS) technique. In addition to the assumptions shared with the OLS
model, DID assumes a parallel trend. The parallel trend assumption requires that in the absence
of treatment, the difference between the experimental and control groups remains constant over
time. Violation of this assumption shall lead to biased estimation of the treatment effect.
Data
For this study, I used data from the IPUMS’ Current Population Survey (CPS), which can
be found at https://cps.ipums.org/cps/index.shtml. The website consolidates and harmonizes
census and survey data acquired by the monthly U.S. labor force survey, called the Current
Population Survey (CPS). Each month, the Census Bureau and the Bureau of Labor Statistics
survey approximately 60,000 households across the United States, gathering demographic and
employment data and providing an estimate of the unemployment rate. IPUMS data is available
for free and can be obtained from the website. For this study, I used data on household food
expenditures and food security, which is released in December of each year.
The dataset used for this study contained 2,524,267 observations (of individual
households) and 12 variables. The dependent variable was a self-reported measure of weekly
household food expenditures. The main independent variable was a binary variable that
measured whether or not a household receives SNAP benefits. Other variables included the
respondent’s state of residence, family income, number of children in the household, educational
attainment, and labor force status.
Research Questions/Hypotheses
Over the course of this study, I tested three research questions about the relationship
between receiving SNAP benefits and household food expenditures.
First, I examined the relationship between receiving SNAP benefits and weekly
household food expenditures using basic linear (OLS) regression. Second, I examined the same
relationship using the DID method and an interaction variable that combined the SNAP benefits
⊘ This is a preview!⊘
Do you want full access?
Subscribe today to unlock all pages.
Trusted by 1+ million students worldwide
1 out of 22
Related Documents


Your All-in-One AI-Powered Toolkit for Academic Success.
+13062052269
info@desklib.com
Available 24*7 on WhatsApp / Email
![[object Object]](/_next/static/media/star-bottom.7253800d.svg)
Unlock your academic potential
Copyright © 2020–2026 A2Z Services. All Rights Reserved. Developed and managed by ZUCOL.