Report: Social Infrastructure Development in Carlingford, NSW

Verified

Added on  2022/09/26

|9
|1141
|20
Report
AI Summary
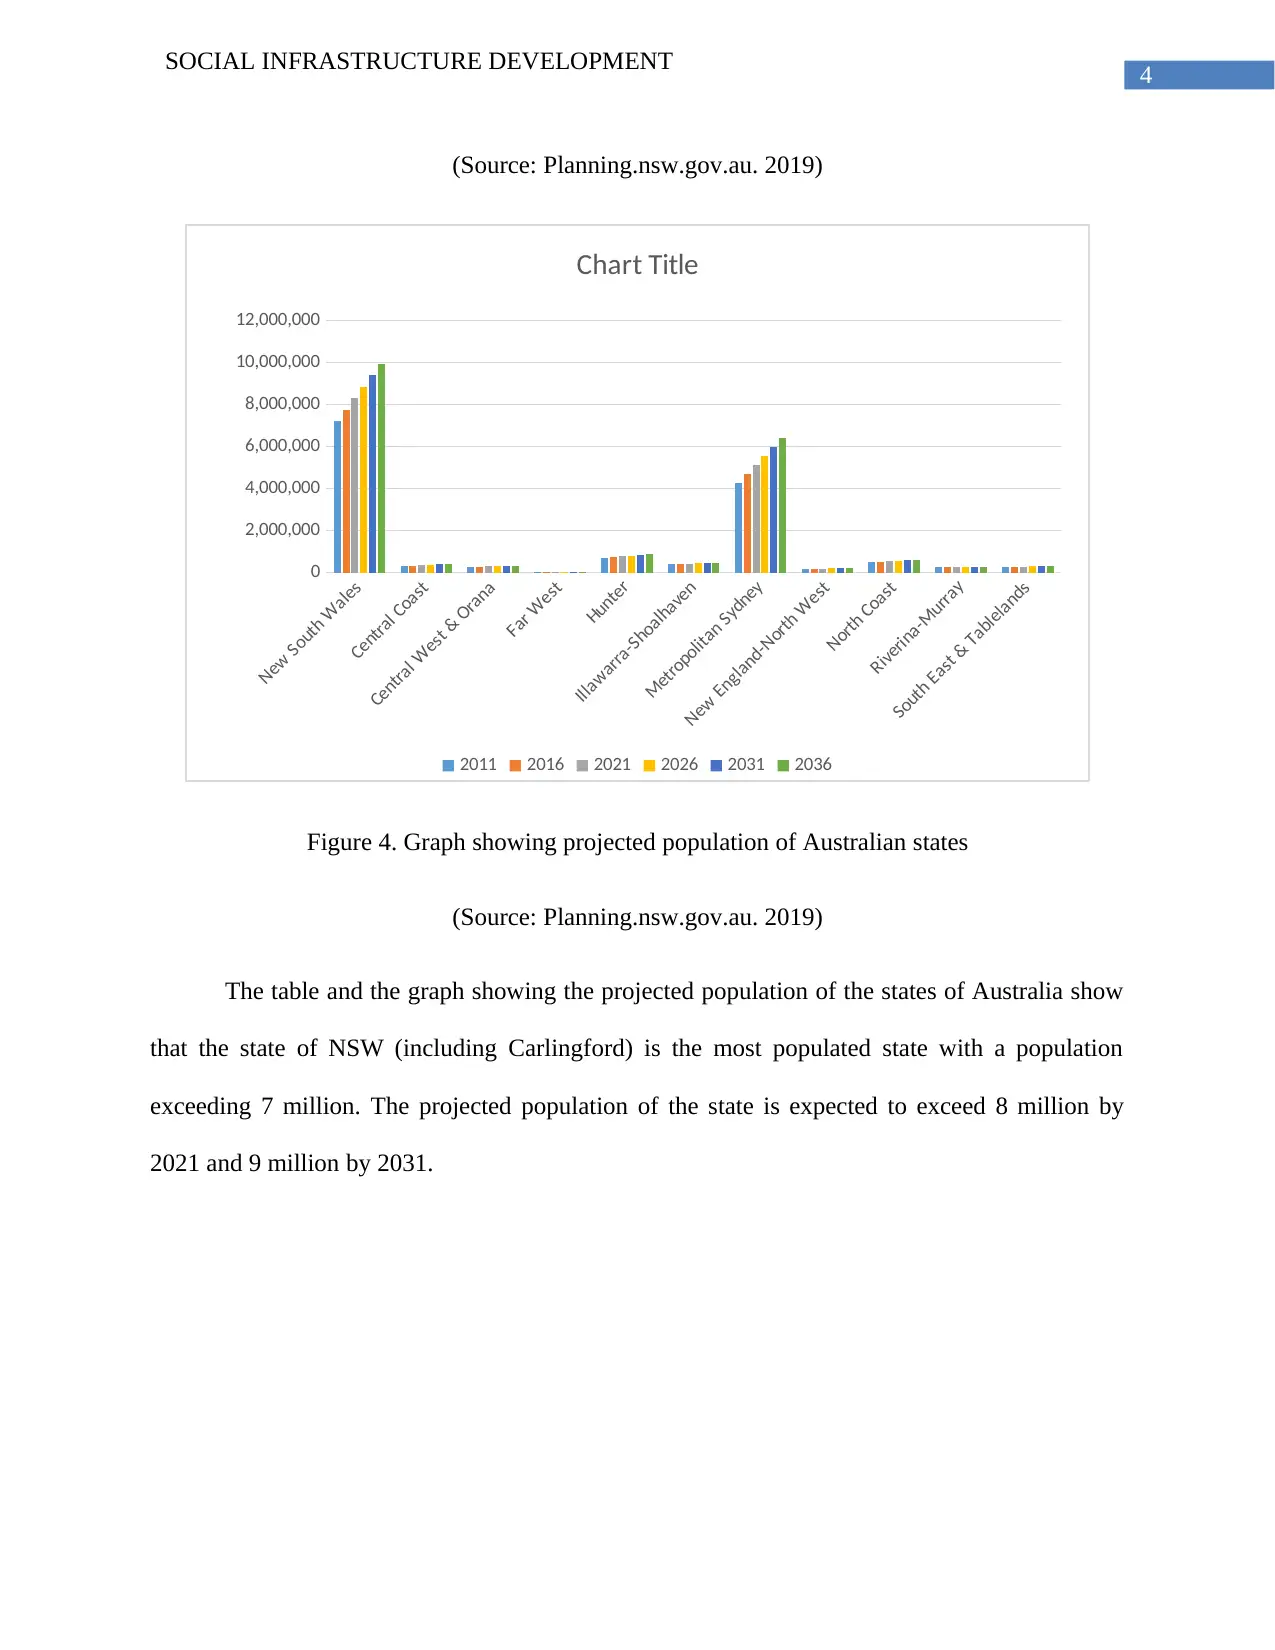
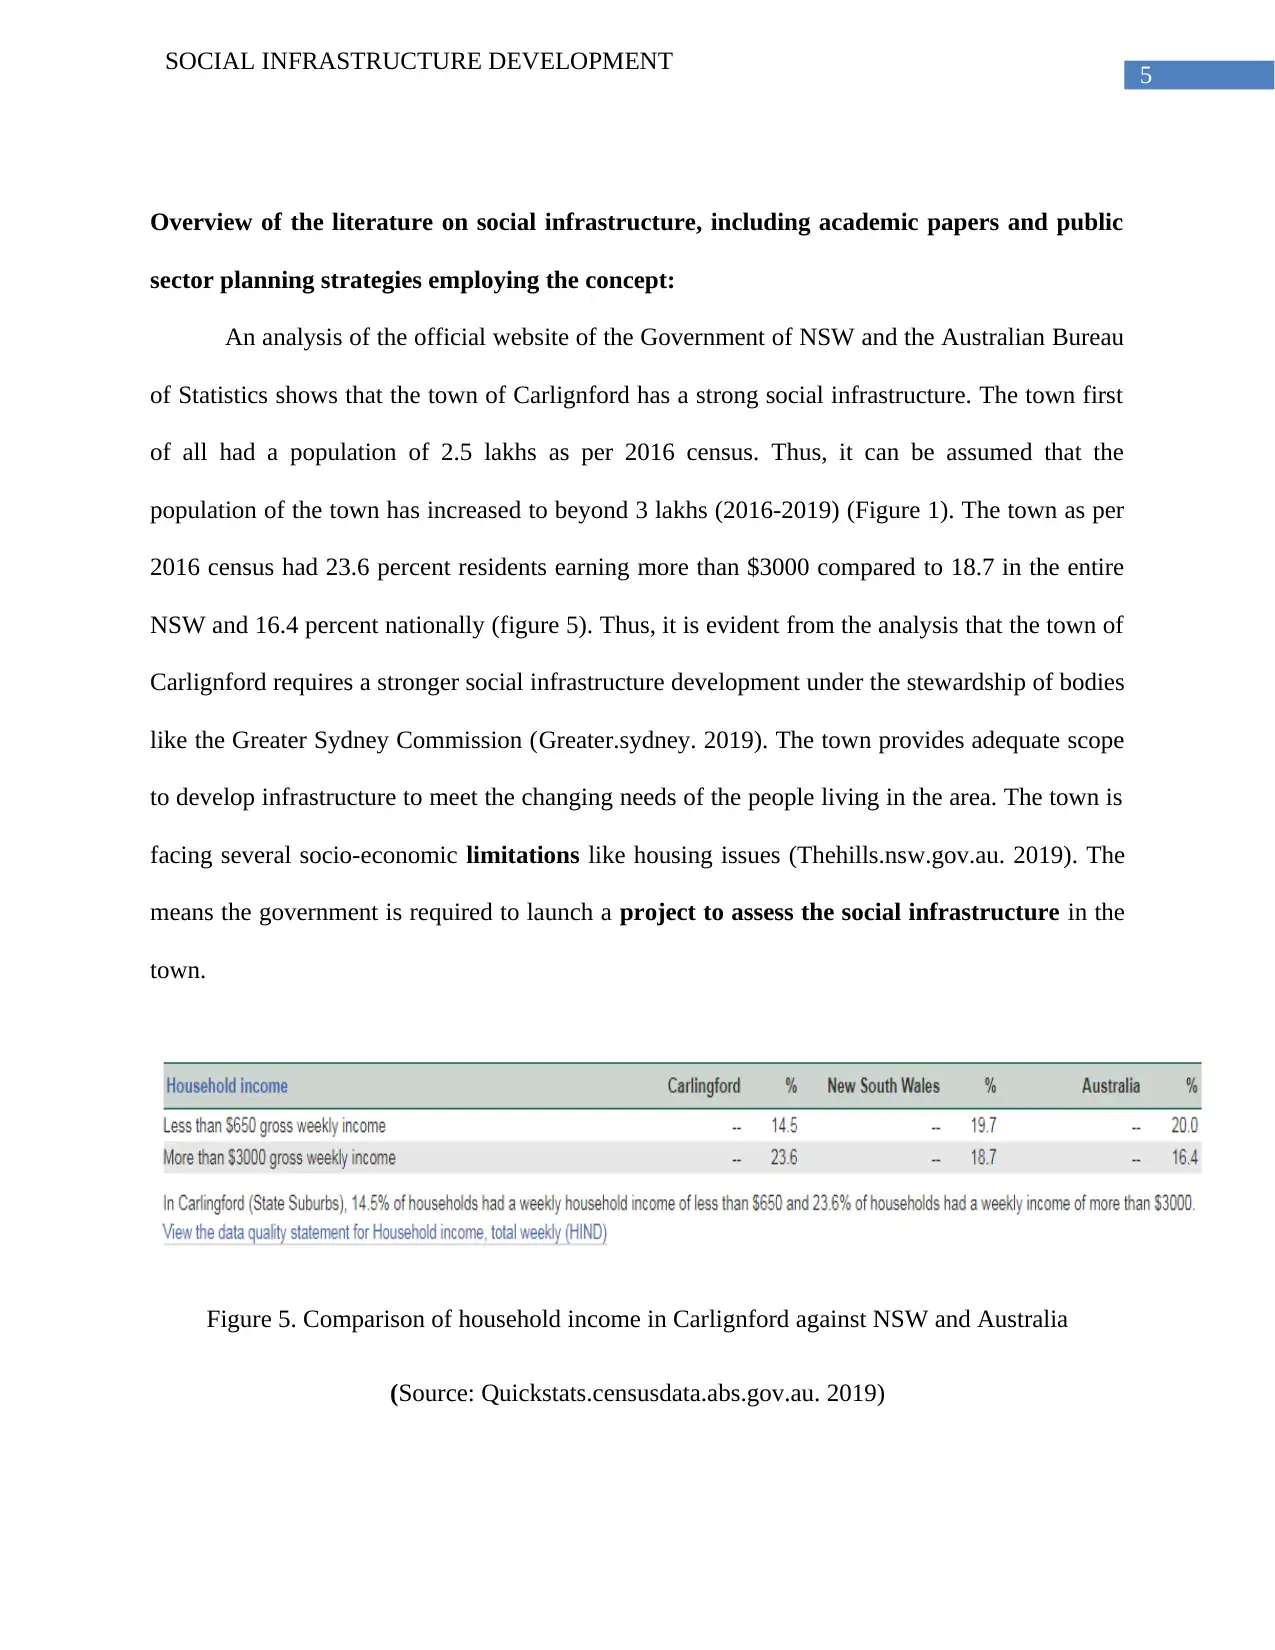
This report examines the social infrastructure development in Carlingford, New South Wales. It begins by defining social infrastructure and identifying the types needed in the community. The report investigates the current state of Carlingford's infrastructure, noting existing provisions like transport and education, and highlighting their inadequacy for the growing population. Demographic data from the Australian Bureau of Statistics and NSW government websites are analyzed, including population size, gender distribution, and ethnic backgrounds. The report projects future population trends and assesses the literature on social infrastructure. It identifies key population groups, focuses on the gap between required and sanctioned financial resources, and proposes a project to assess social infrastructure, detailing its scope, activities, and timeline. The project aims to evaluate social attributes, including population, education, income, and ethnicity, and includes a step-by-step plan with timelines for various stages, from gaining approvals to submitting the final report. The report references several sources, including government websites and statistical data.
Document Page
Running head: SOCIAL INFRASTRUCTURE DEVELOPMENT
Social Infrastructure Development
Name of the Student:
Name of the University:
Author Note:
tabler-icon-diamond-filled.svg

Paraphrase This Document

Need a fresh take? Get an instant paraphrase of this document with our AI Paraphraser
Document Page
1
SOCIAL INFRASTRUCTURE DEVELOPMENT
Step 1. Define and list types of social infrastructure typically provided by local councils:
The communities in Carlingford, New South Wales would require different types of
social infrastructure which has to be provided by the local councils. The infrastructure
components can be defined as the basic facilities which the people of Carlingford would require
to lead a standard lifestyle. The infrastructure would consist of schools, colleges, markets, roads
and banks.
Step 2. Investigate the presence of these in Carlingford:
An investigation into the present level of infrastructure of Carlington shows that the city
require a stronger infrastructure in order to be able to provide better lifestyle to its residents. The
city is served by basic necessities like transport networks and educational institutes. However,
these provisions are not sufficient to meet the requirements of the rising population of the city.
Step 3. Document current and likely future demographic profile of Carlingford residents
Brief description of the demographic and residential composition of the suburb and the
forecast trend:
The two tables shown below show that demographic profile of Carlingford, New South
Wales, Australia. As far as the demography of the town is concerned, several findings come into
light. The first finding is that the population of the city stands around 25000 as per 2016 census.
The second finding which transpires is that the place on average has equal number of male and
female residents. As far as the background of the residents are concerned, the place is dominated
by people of Australian origin and Asian origin.
Document Page
2
SOCIAL INFRASTRUCTURE DEVELOPMENT
Figure 1. Table showing demographics of Carlingford, NSW and map
(Source: Quickstats.censusdata.abs.gov.au. 2019)
Document Page
3
SOCIAL INFRASTRUCTURE DEVELOPMENT
Figure 2. Table showing background of people of Carlingford
(Source: Quickstats.censusdata.abs.gov.au. 2019)
TOTAL PROJECTED
POPULATION
2011 2016 2021 2026 2031 2036
New South Wales
7,218,55
0
7,748,00
0
8,297,50
0
8,844,70
0
9,386,85
0
9,925,55
0
Central Coast 322,650 339,550 357,250 374,900 391,050 415,050
Central West & Orana 276,850 285,500 293,100 299,550 304,800 308,950
Far West 48,150 47,500 46,700 45,600 44,300 42,850
Hunter 693,400 732,400 769,750 805,250 839,350 862,250
Illawarra-Shoalhaven 385,300 404,650 423,150 440,600 456,800 471,700
Metropolitan Sydney
4,286,20
0
4,681,95
0
5,106,30
0
5,537,85
0
5,975,55
0
6,421,85
0
New England-North West 182,600 188,350 193,150 197,000 200,000 202,150
North Coast 495,300 519,300 541,350 561,700 579,850 595,450
Riverina-Murray 266,350 273,150 278,350 281,750 283,650 284,300
South East & Tablelands 261,750 275,650 288,450 300,500 311,450 321,050
Figure 3. Projected population of Australia including NSW
tabler-icon-diamond-filled.svg

Paraphrase This Document

Need a fresh take? Get an instant paraphrase of this document with our AI Paraphraser
Document Page
4
SOCIAL INFRASTRUCTURE DEVELOPMENT
(Source: Planning.nsw.gov.au. 2019)
New South Wales
Central Coast
Central West & Orana
Far West
Hunter
Illawarra-Shoalhaven
Metropolitan Sydney
New England-North West
North Coast
Riverina-Murray
South East & Tablelands
0
2,000,000
4,000,000
6,000,000
8,000,000
10,000,000
12,000,000
Chart Title
2011 2016 2021 2026 2031 2036
Figure 4. Graph showing projected population of Australian states
(Source: Planning.nsw.gov.au. 2019)
The table and the graph showing the projected population of the states of Australia show
that the state of NSW (including Carlingford) is the most populated state with a population
exceeding 7 million. The projected population of the state is expected to exceed 8 million by
2021 and 9 million by 2031.
Document Page
5
SOCIAL INFRASTRUCTURE DEVELOPMENT
Overview of the literature on social infrastructure, including academic papers and public
sector planning strategies employing the concept:
An analysis of the official website of the Government of NSW and the Australian Bureau
of Statistics shows that the town of Carlignford has a strong social infrastructure. The town first
of all had a population of 2.5 lakhs as per 2016 census. Thus, it can be assumed that the
population of the town has increased to beyond 3 lakhs (2016-2019) (Figure 1). The town as per
2016 census had 23.6 percent residents earning more than $3000 compared to 18.7 in the entire
NSW and 16.4 percent nationally (figure 5). Thus, it is evident from the analysis that the town of
Carlignford requires a stronger social infrastructure development under the stewardship of bodies
like the Greater Sydney Commission (Greater.sydney. 2019). The town provides adequate scope
to develop infrastructure to meet the changing needs of the people living in the area. The town is
facing several socio-economic limitations like housing issues (Thehills.nsw.gov.au. 2019). The
means the government is required to launch a project to assess the social infrastructure in the
town.
Figure 5. Comparison of household income in Carlignford against NSW and Australia
(Source: Quickstats.censusdata.abs.gov.au. 2019)
Document Page
6
SOCIAL INFRASTRUCTURE DEVELOPMENT
Step 4: Population groups to be catered to:
The population group which would be catered to consist would consist of the younger
population. The population group would essentially consist the working people and their family.
Step 5. Gap:
The gap which has been identified would be gap between the actual financial resources
required to achieve the infrastructural growth and the amount sanction by the state and the
central government. The government bodies should take steps to ensure that this gap is
minimized to the required extent.
Name of the
project Project to assess the social infrastructure (Step by step breakup)
Scope of the
project
The scope of the project would include assessing the social
attributes of the people living in Carlignford including aspects like
population, educational qualification, household income and
ethnicity
SLNo. Activity
Time
(months
)
The local government of the City of Parramatta holds meeting with
the representatives of the government of NSW and government of
Australia to propose launch of the Project to assess the social
infrastructure 2
Local government of Parramatta gains approval 1
Local government of Parramatta form layout of the project,
including draft plans and financial requirements 2
Submit the draft plan before the NSW govt. and central
government 3
Local government of Parramatta gains final approval and financial
sanctions 4
Assesses social infrastcture pf Carlingford (coming under its
jurisdiction) 2
Submits final report 4
tabler-icon-diamond-filled.svg

Paraphrase This Document

Need a fresh take? Get an instant paraphrase of this document with our AI Paraphraser
Document Page
7
SOCIAL INFRASTRUCTURE DEVELOPMENT
StartMo
n
10/12/0
9
Finish
Fri
2/25/
11
1st
Quar
ter
2nd
Quart
er
3rd
Quart
er
4th
Quart
er
1st
Quar
ter
Document Page
8
SOCIAL INFRASTRUCTURE DEVELOPMENT
References:
Planning.nsw.gov.au. 2019. Planning.nsw.gov.au. [online] Available at:
https://www.planning.nsw.gov.au/Research-and-Demography/Demography/Population-
projections [Accessed 21 Aug. 2019].
Quickstats.censusdata.abs.gov.au. 2019. Quickstats.censusdata.abs.gov.au. [online] Available at:
https://quickstats.censusdata.abs.gov.au/census_services/getproduct/census/2016/quickstat/
SSC10818 [Accessed 21 Aug. 2019].
Greater.sydney. 2019. Greater.sydney. [online] Available at:
https://www.greater.sydney/strategic-planning [Accessed 21 Aug. 2019].
Thehills.nsw.gov.au. 2019. Thehills.nsw.gov.au. [online] Available at:
https://www.thehills.nsw.gov.au/.../carlingford_precinct_public_domain_pl... [Accessed 21 Aug.
2019].
chevron_up_icon
1 out of 9
circle_padding
hide_on_mobile
zoom_out_icon
[object Object]