Comparative Data Analysis and Interpretation of Social Media Platforms

Verified

Added on  2023/01/10

|14
|1086
|32
Report
AI Summary
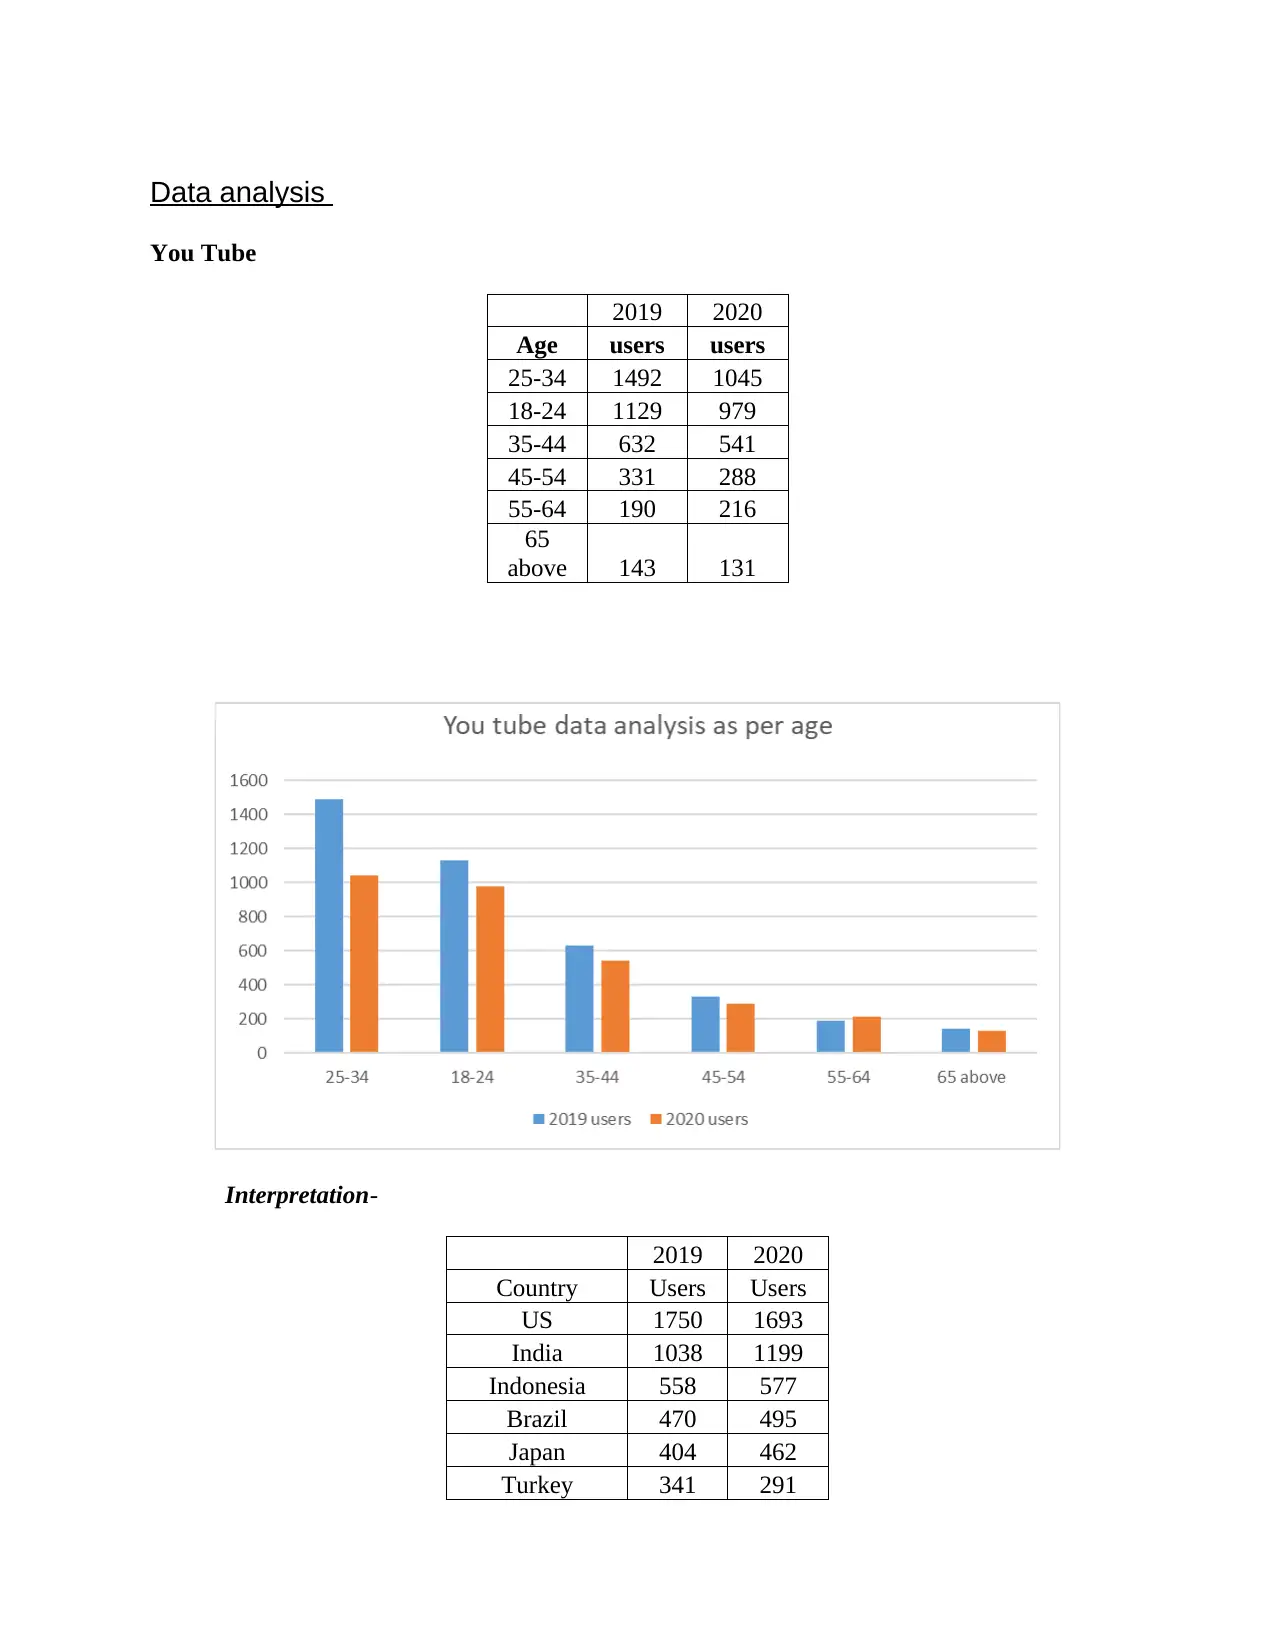
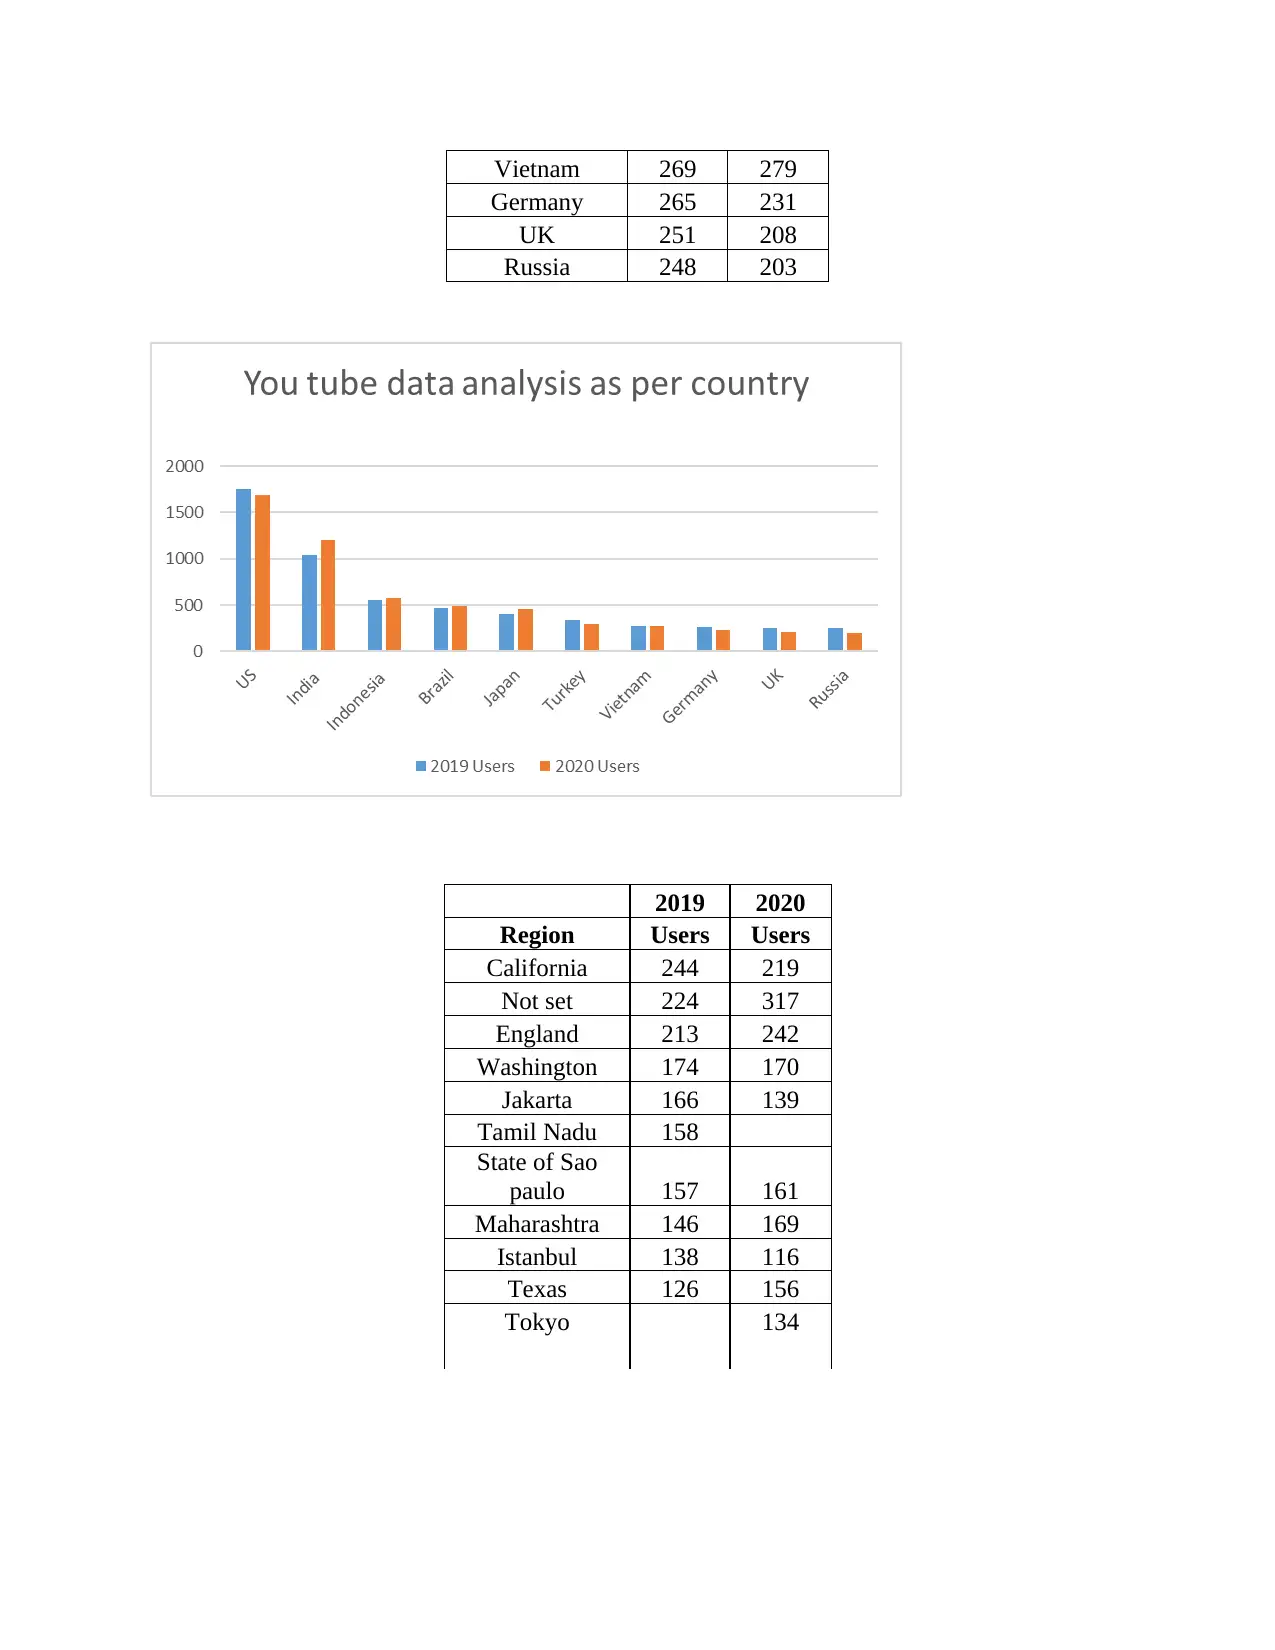
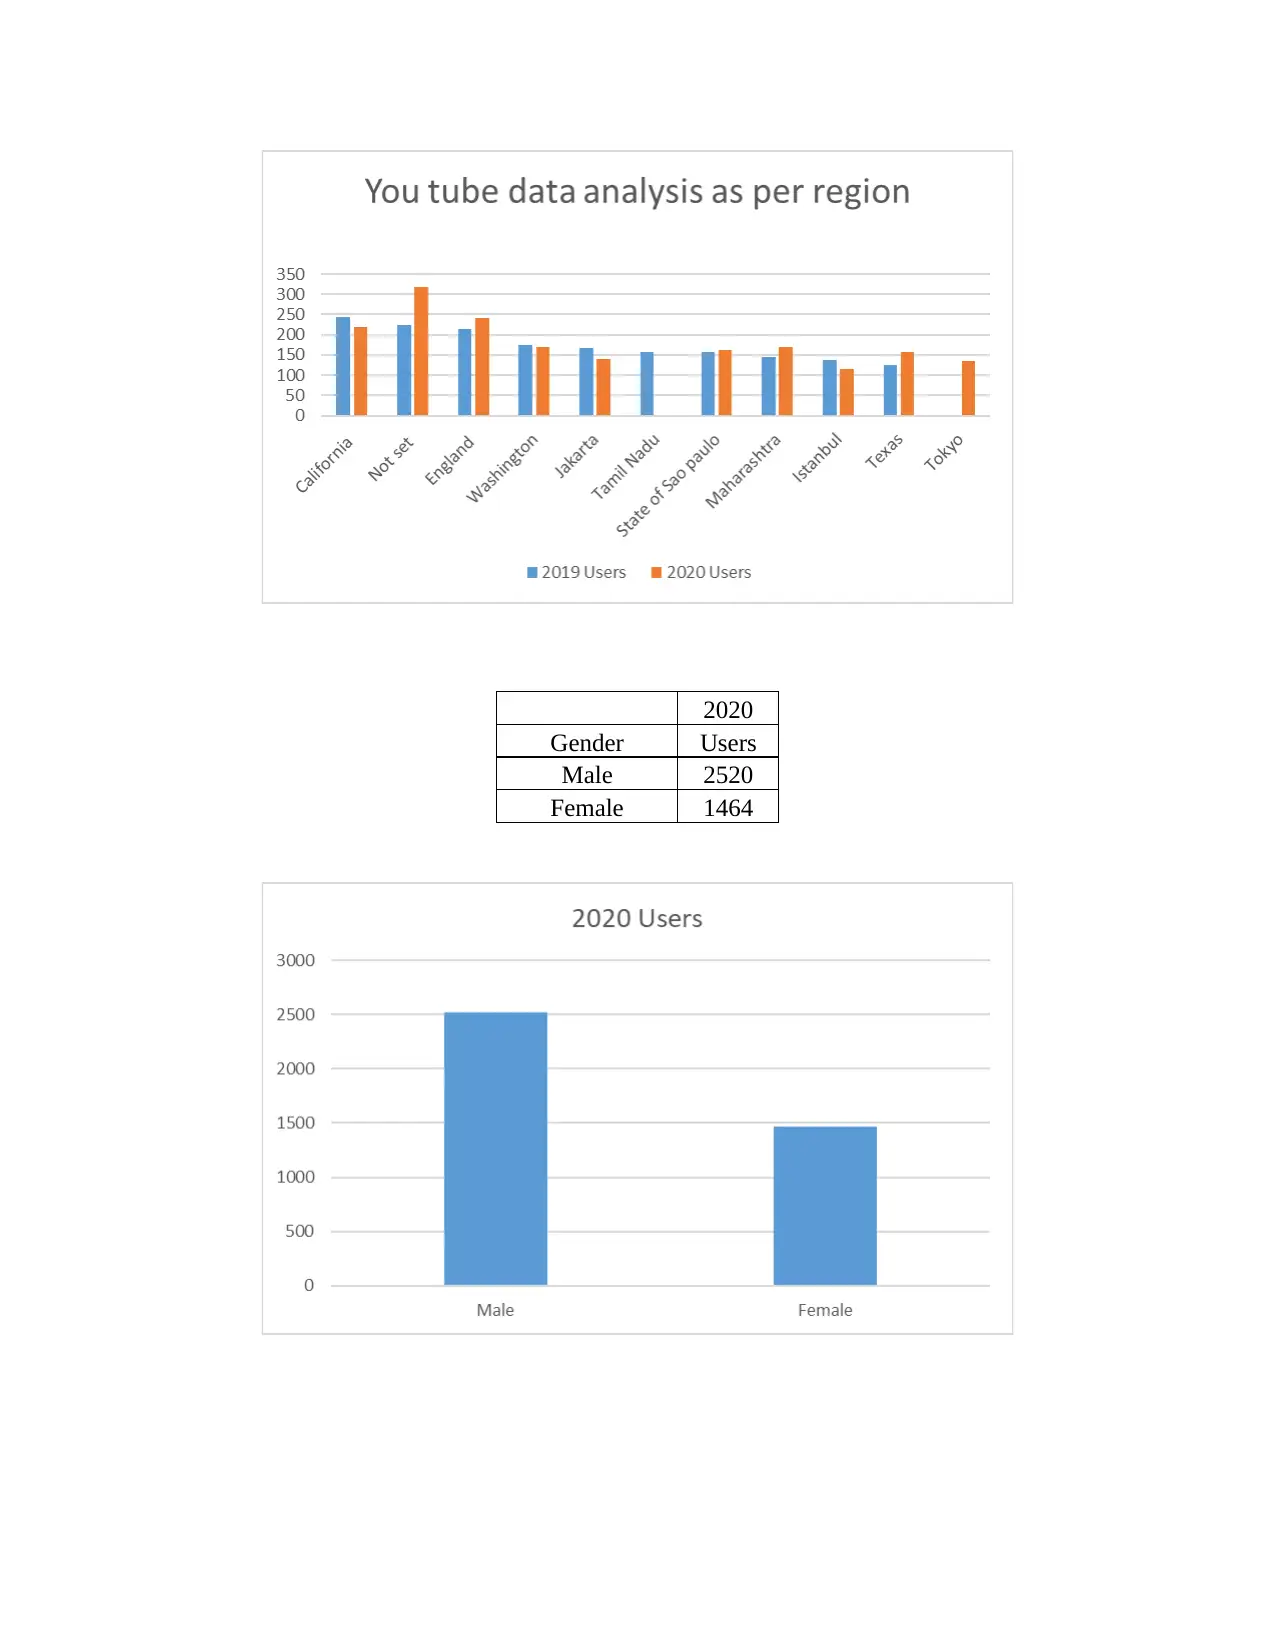
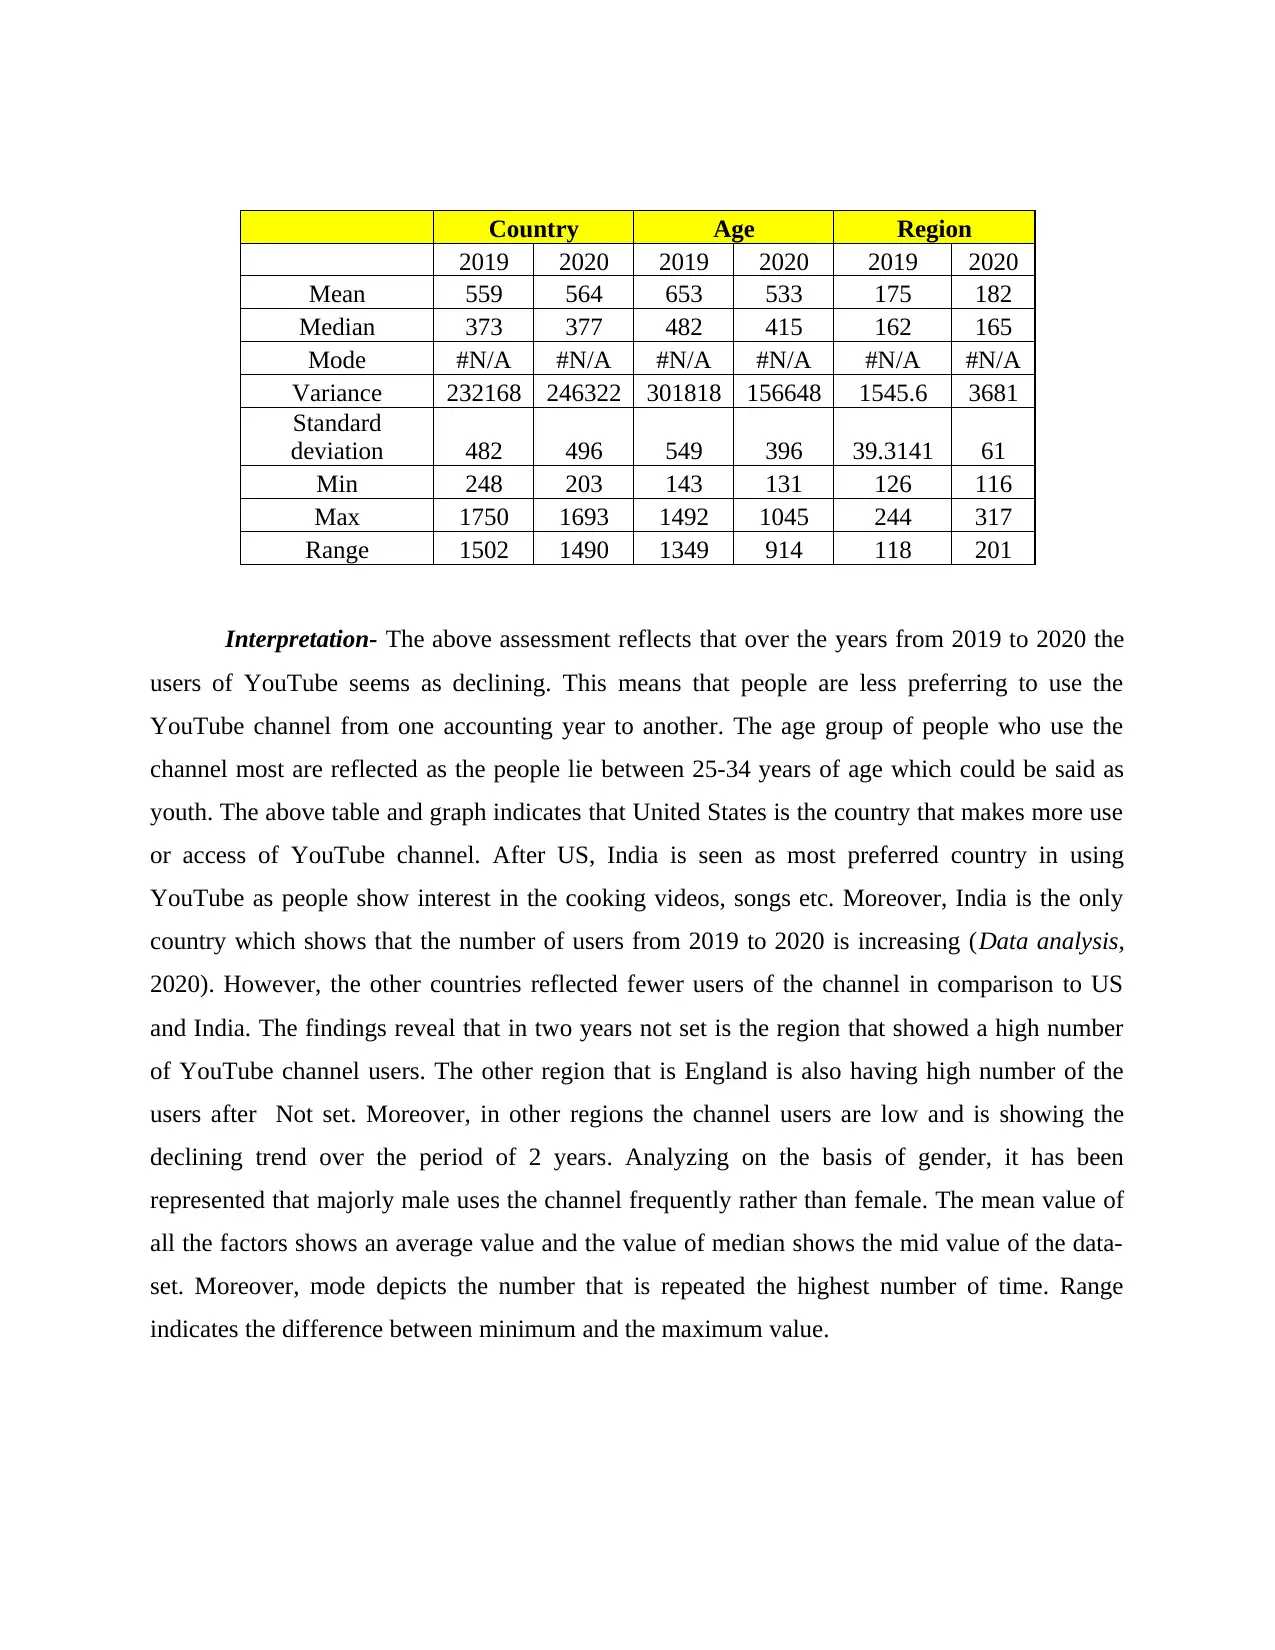
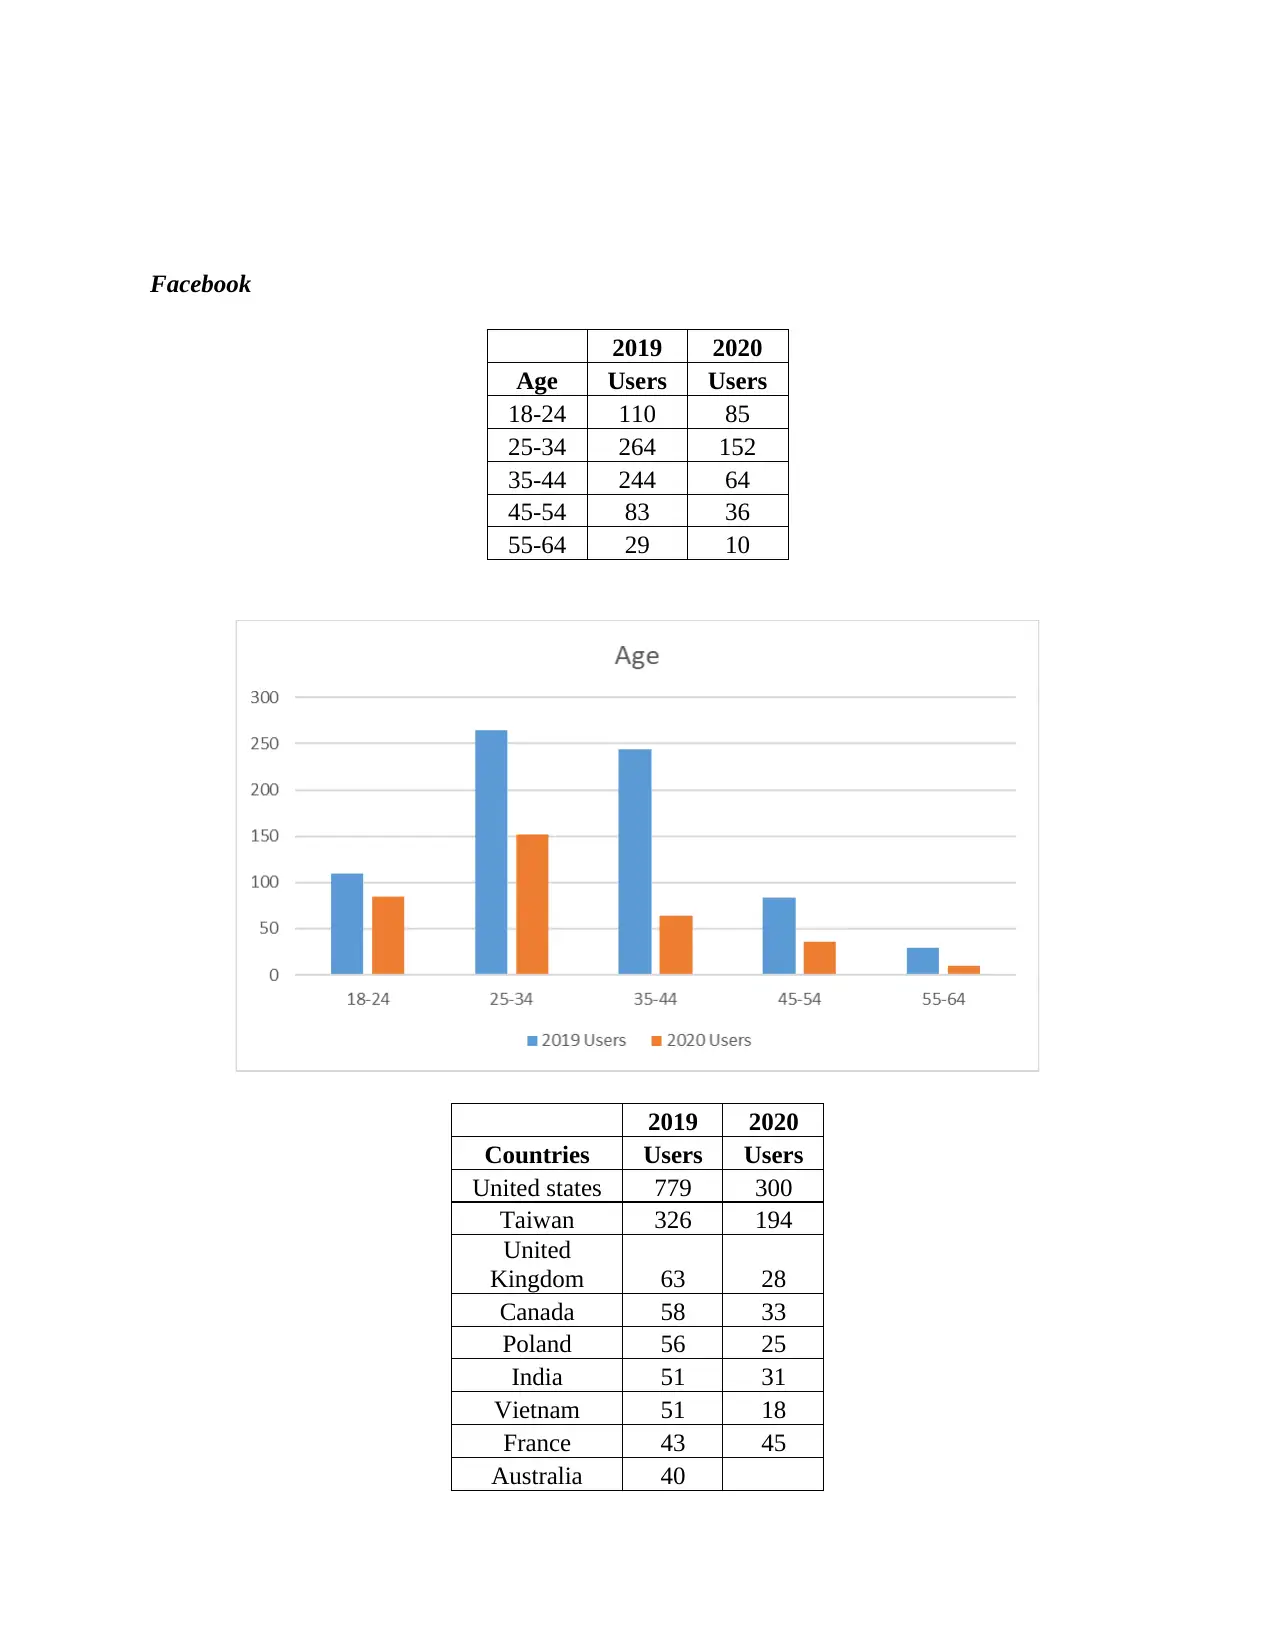
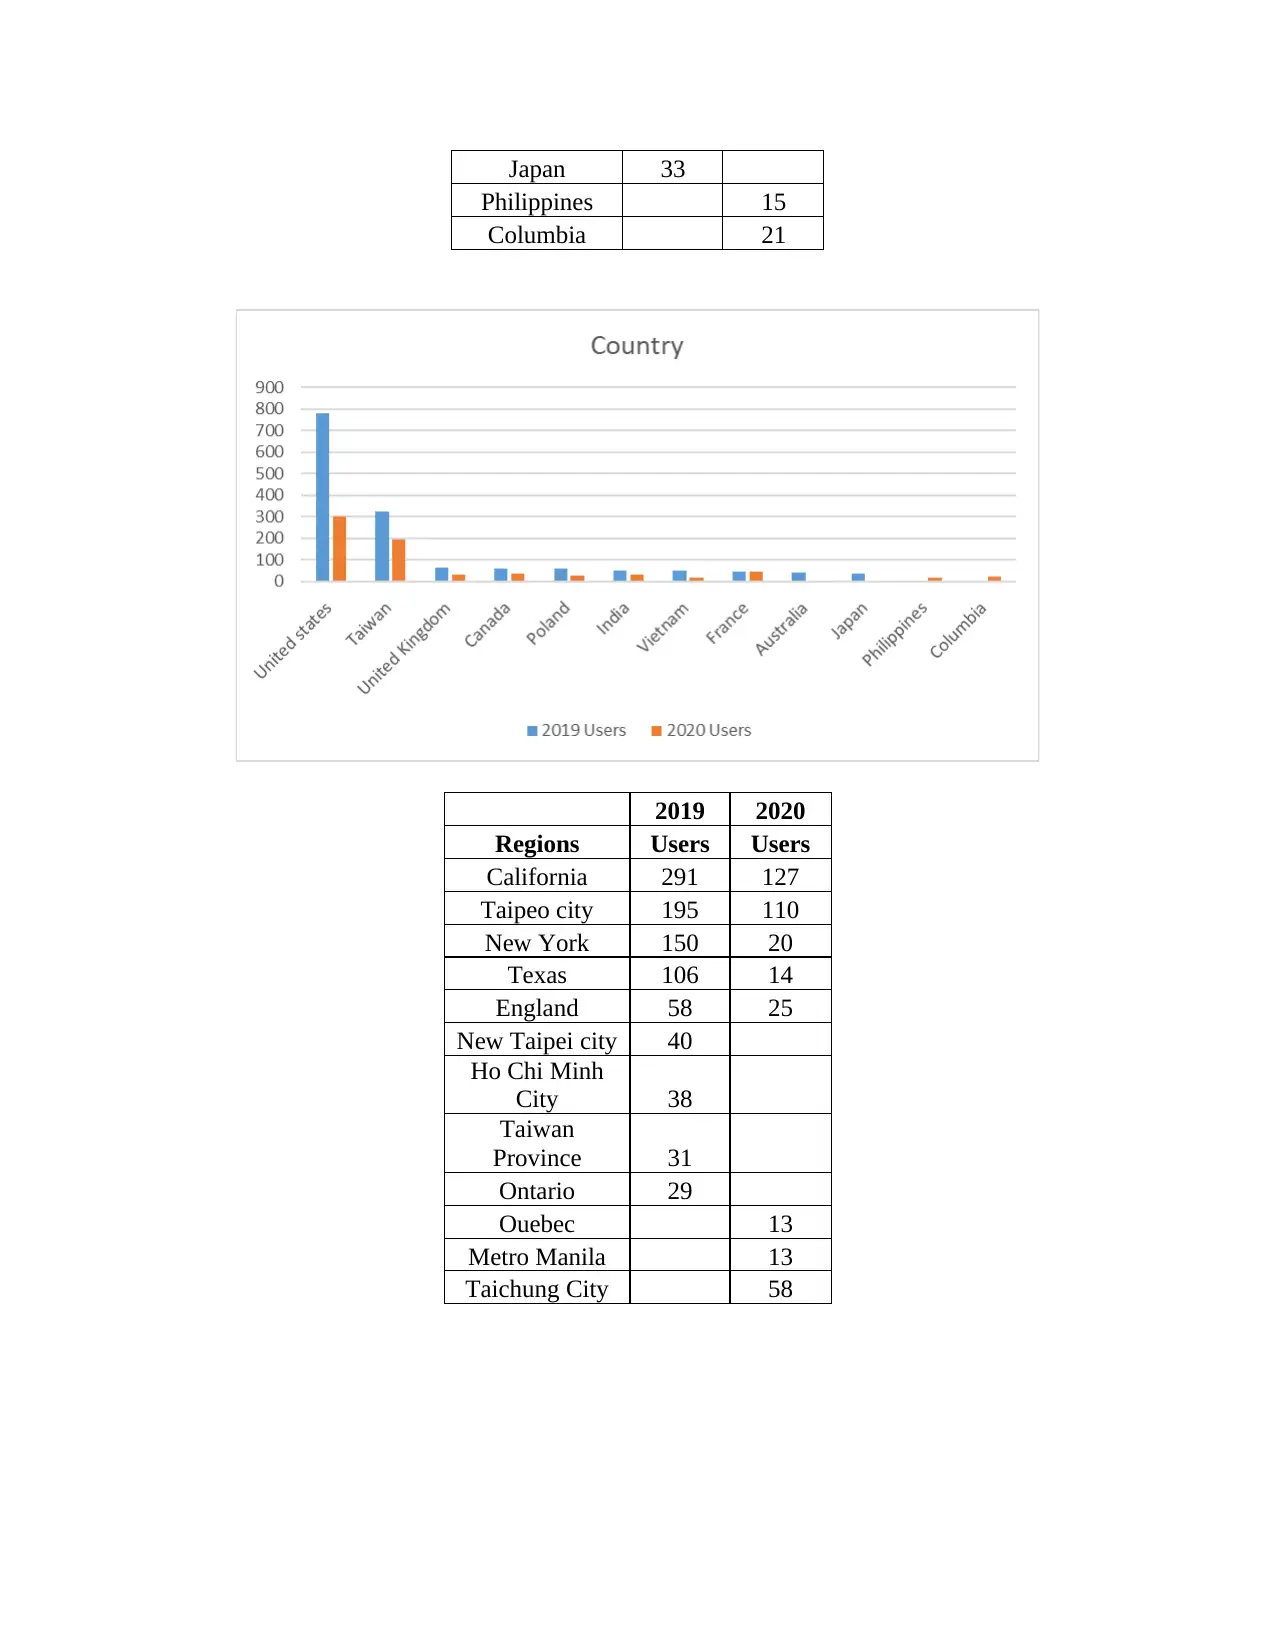
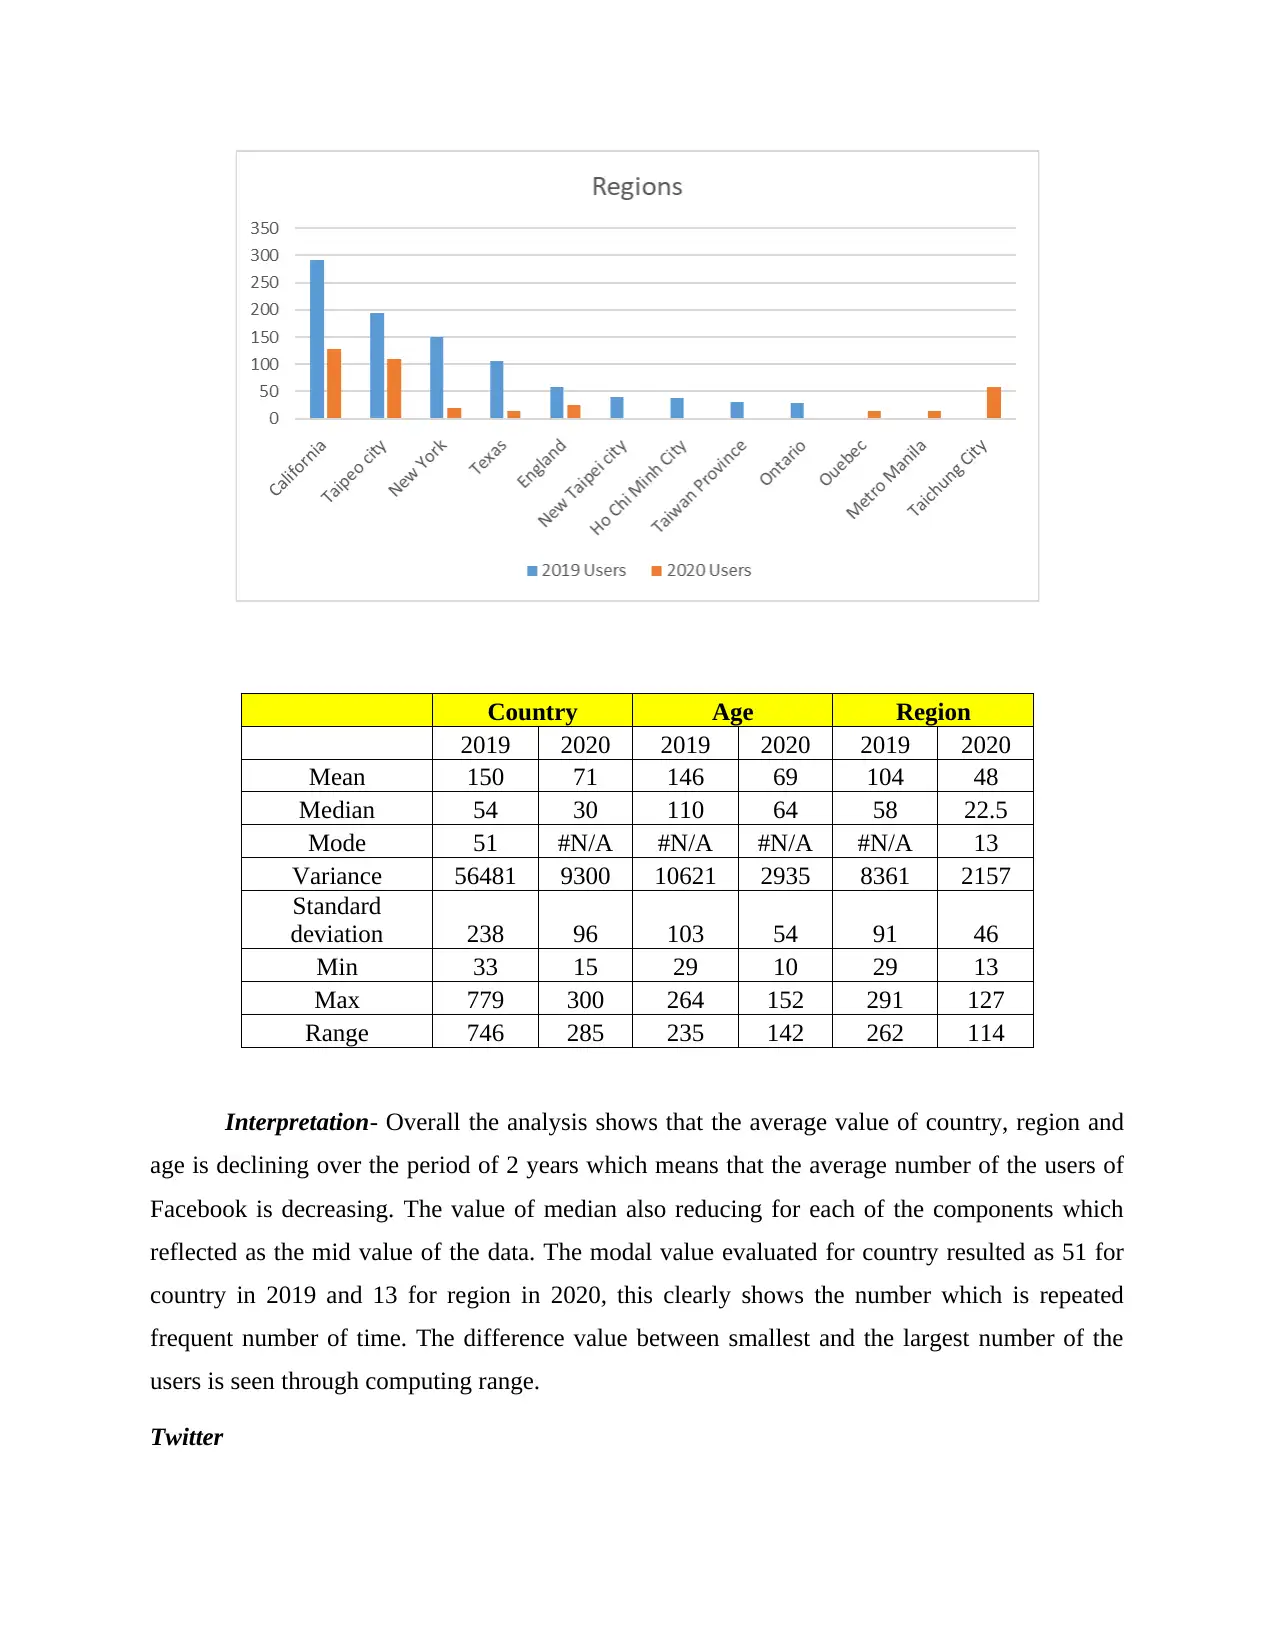
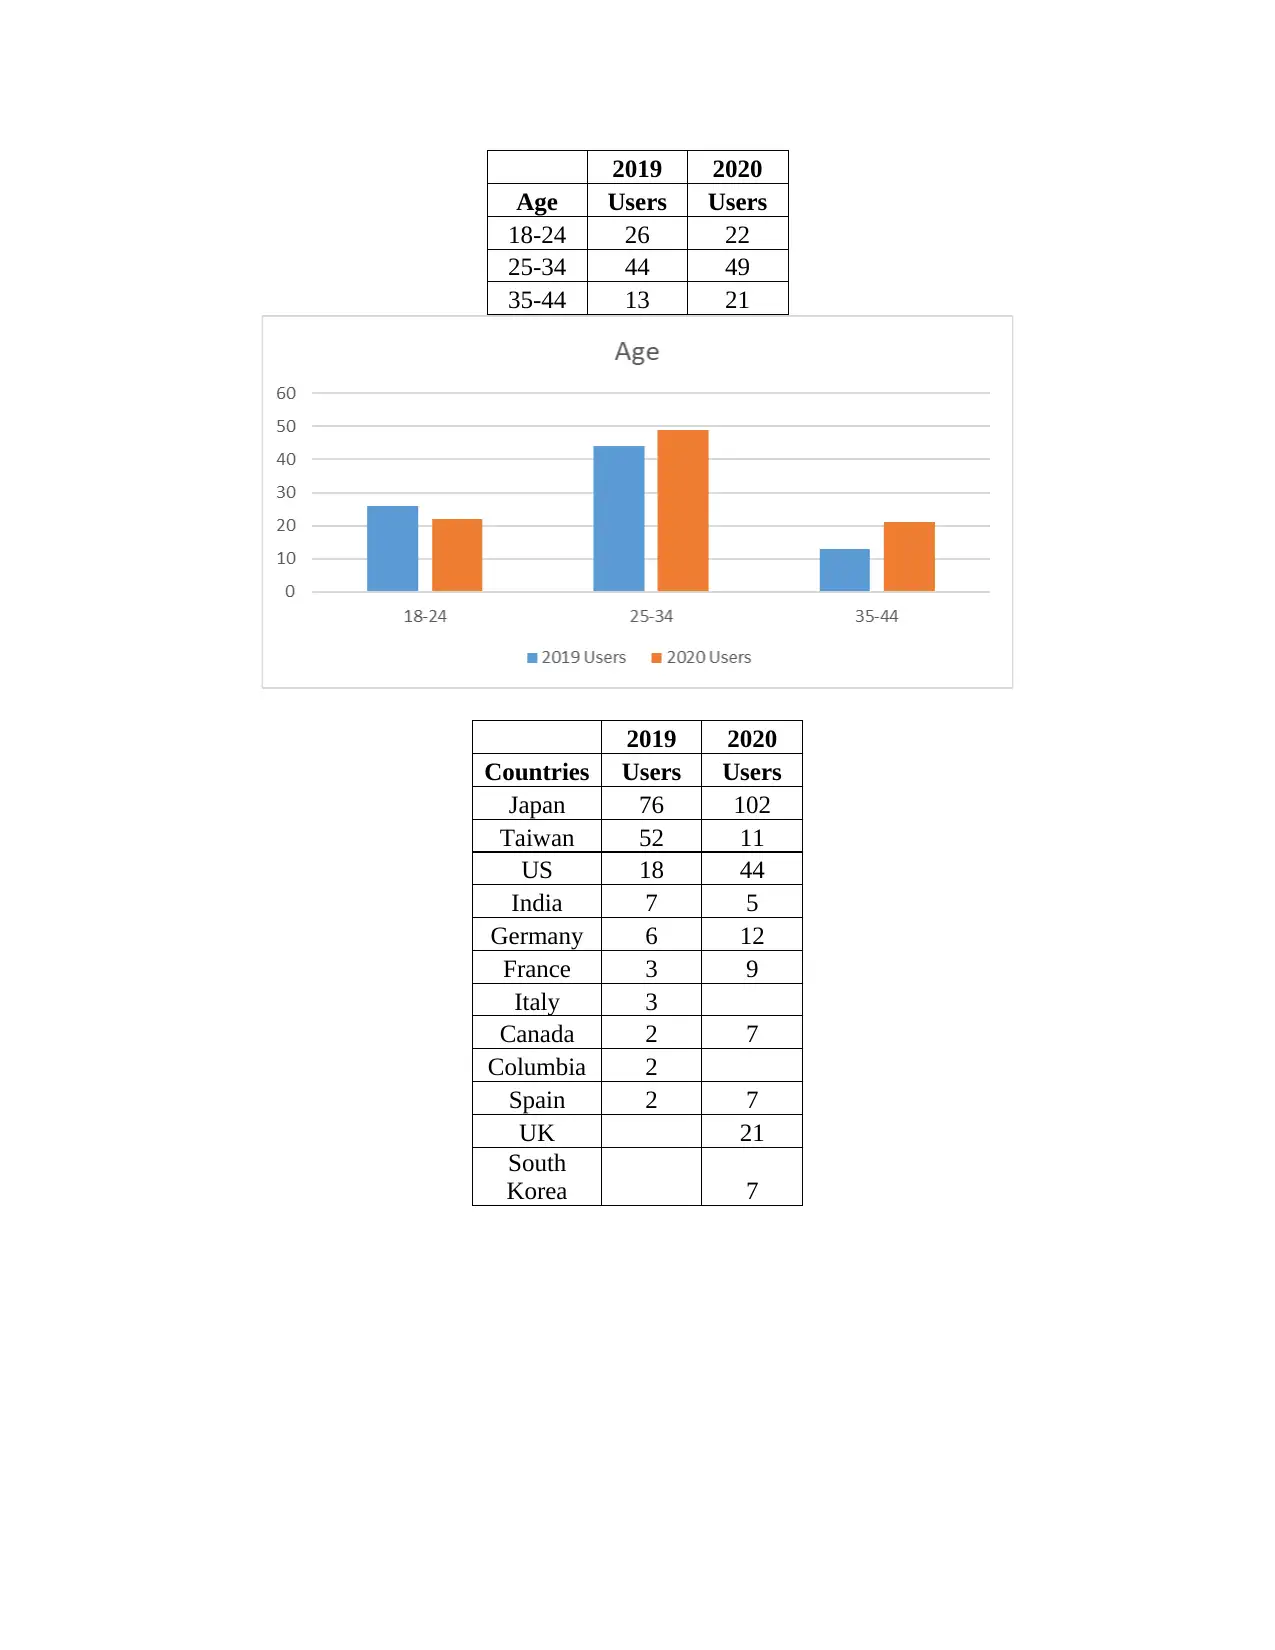
This report presents a comparative analysis of user data from YouTube, Facebook, and Twitter, focusing on trends from 2019 to 2020. The analysis includes user demographics such as age, gender, and location, along with statistical measures like mean, median, mode, variance, and range. The findings indicate a decline in YouTube users overall, with the 25-34 age group being the most active, and the United States having the highest user base. Facebook data reveals a decreasing average user count across countries, regions, and age groups. Twitter data shows an increasing mean value across country, age, and region, suggesting a growing user base. The report highlights key insights into user behavior and platform performance, providing a comprehensive overview of the social media landscape during the specified period. The report concludes by referencing the data source used for the analysis.
Document Page
Analysis and Interpretation
tabler-icon-diamond-filled.svg

Paraphrase This Document

Need a fresh take? Get an instant paraphrase of this document with our AI Paraphraser
Document Page
Table of Contents
Data analysis ..............................................................................................................................3
REFERENCES..............................................................................................................................14
Document Page
Data analysis
You Tube
2019 2020
Age users users
25-34 1492 1045
18-24 1129 979
35-44 632 541
45-54 331 288
55-64 190 216
65
above 143 131
Interpretation-
2019 2020
Country Users Users
US 1750 1693
India 1038 1199
Indonesia 558 577
Brazil 470 495
Japan 404 462
Turkey 341 291
Document Page
Vietnam 269 279
Germany 265 231
UK 251 208
Russia 248 203
2019 2020
Region Users Users
California 244 219
Not set 224 317
England 213 242
Washington 174 170
Jakarta 166 139
Tamil Nadu 158
State of Sao
paulo 157 161
Maharashtra 146 169
Istanbul 138 116
Texas 126 156
Tokyo 134
tabler-icon-diamond-filled.svg

Paraphrase This Document

Need a fresh take? Get an instant paraphrase of this document with our AI Paraphraser
Document Page
2020
Gender Users
Male 2520
Female 1464
Document Page
Country Age Region
2019 2020 2019 2020 2019 2020
Mean 559 564 653 533 175 182
Median 373 377 482 415 162 165
Mode #N/A #N/A #N/A #N/A #N/A #N/A
Variance 232168 246322 301818 156648 1545.6 3681
Standard
deviation 482 496 549 396 39.3141 61
Min 248 203 143 131 126 116
Max 1750 1693 1492 1045 244 317
Range 1502 1490 1349 914 118 201
Interpretation- The above assessment reflects that over the years from 2019 to 2020 the
users of YouTube seems as declining. This means that people are less preferring to use the
YouTube channel from one accounting year to another. The age group of people who use the
channel most are reflected as the people lie between 25-34 years of age which could be said as
youth. The above table and graph indicates that United States is the country that makes more use
or access of YouTube channel. After US, India is seen as most preferred country in using
YouTube as people show interest in the cooking videos, songs etc. Moreover, India is the only
country which shows that the number of users from 2019 to 2020 is increasing (Data analysis,
2020). However, the other countries reflected fewer users of the channel in comparison to US
and India. The findings reveal that in two years not set is the region that showed a high number
of YouTube channel users. The other region that is England is also having high number of the
users after Not set. Moreover, in other regions the channel users are low and is showing the
declining trend over the period of 2 years. Analyzing on the basis of gender, it has been
represented that majorly male uses the channel frequently rather than female. The mean value of
all the factors shows an average value and the value of median shows the mid value of the data-
set. Moreover, mode depicts the number that is repeated the highest number of time. Range
indicates the difference between minimum and the maximum value.
Document Page
Facebook
2019 2020
Age Users Users
18-24 110 85
25-34 264 152
35-44 244 64
45-54 83 36
55-64 29 10
2019 2020
Countries Users Users
United states 779 300
Taiwan 326 194
United
Kingdom 63 28
Canada 58 33
Poland 56 25
India 51 31
Vietnam 51 18
France 43 45
Australia 40
tabler-icon-diamond-filled.svg

Paraphrase This Document

Need a fresh take? Get an instant paraphrase of this document with our AI Paraphraser
Document Page
Japan 33
Philippines 15
Columbia 21
2019 2020
Regions Users Users
California 291 127
Taipeo city 195 110
New York 150 20
Texas 106 14
England 58 25
New Taipei city 40
Ho Chi Minh
City 38
Taiwan
Province 31
Ontario 29
Ouebec 13
Metro Manila 13
Taichung City 58
Document Page
Country Age Region
2019 2020 2019 2020 2019 2020
Mean 150 71 146 69 104 48
Median 54 30 110 64 58 22.5
Mode 51 #N/A #N/A #N/A #N/A 13
Variance 56481 9300 10621 2935 8361 2157
Standard
deviation 238 96 103 54 91 46
Min 33 15 29 10 29 13
Max 779 300 264 152 291 127
Range 746 285 235 142 262 114
Interpretation- Overall the analysis shows that the average value of country, region and
age is declining over the period of 2 years which means that the average number of the users of
Facebook is decreasing. The value of median also reducing for each of the components which
reflected as the mid value of the data. The modal value evaluated for country resulted as 51 for
country in 2019 and 13 for region in 2020, this clearly shows the number which is repeated
frequent number of time. The difference value between smallest and the largest number of the
users is seen through computing range.
Twitter
Document Page
2019 2020
Age Users Users
18-24 26 22
25-34 44 49
35-44 13 21
2019 2020
Countries Users Users
Japan 76 102
Taiwan 52 11
US 18 44
India 7 5
Germany 6 12
France 3 9
Italy 3
Canada 2 7
Columbia 2
Spain 2 7
UK 21
South
Korea 7
tabler-icon-diamond-filled.svg

Paraphrase This Document

Need a fresh take? Get an instant paraphrase of this document with our AI Paraphraser
Document Page
2019 2020
Regions Users Users
Taiwan
Province 42 6
Tokyo 32 52
Kanagawa 8 9
California 7 7
Osaka 6 9
Aichi 4
Hyago 4
Taipei City 4
Berlin 3
Miyagi 3
California 7
Texas 5
Document Page
2019 2020
Gender Users Users
Male 60 71
Female 31 31
chevron_up_icon
1 out of 14
circle_padding
hide_on_mobile
zoom_out_icon
[object Object]