Juliana Rodrigues de Camargo Queiroz: Data Interpretation Report

Verified

Added on  2021/06/15

|36
|4907
|24
Report
AI Summary
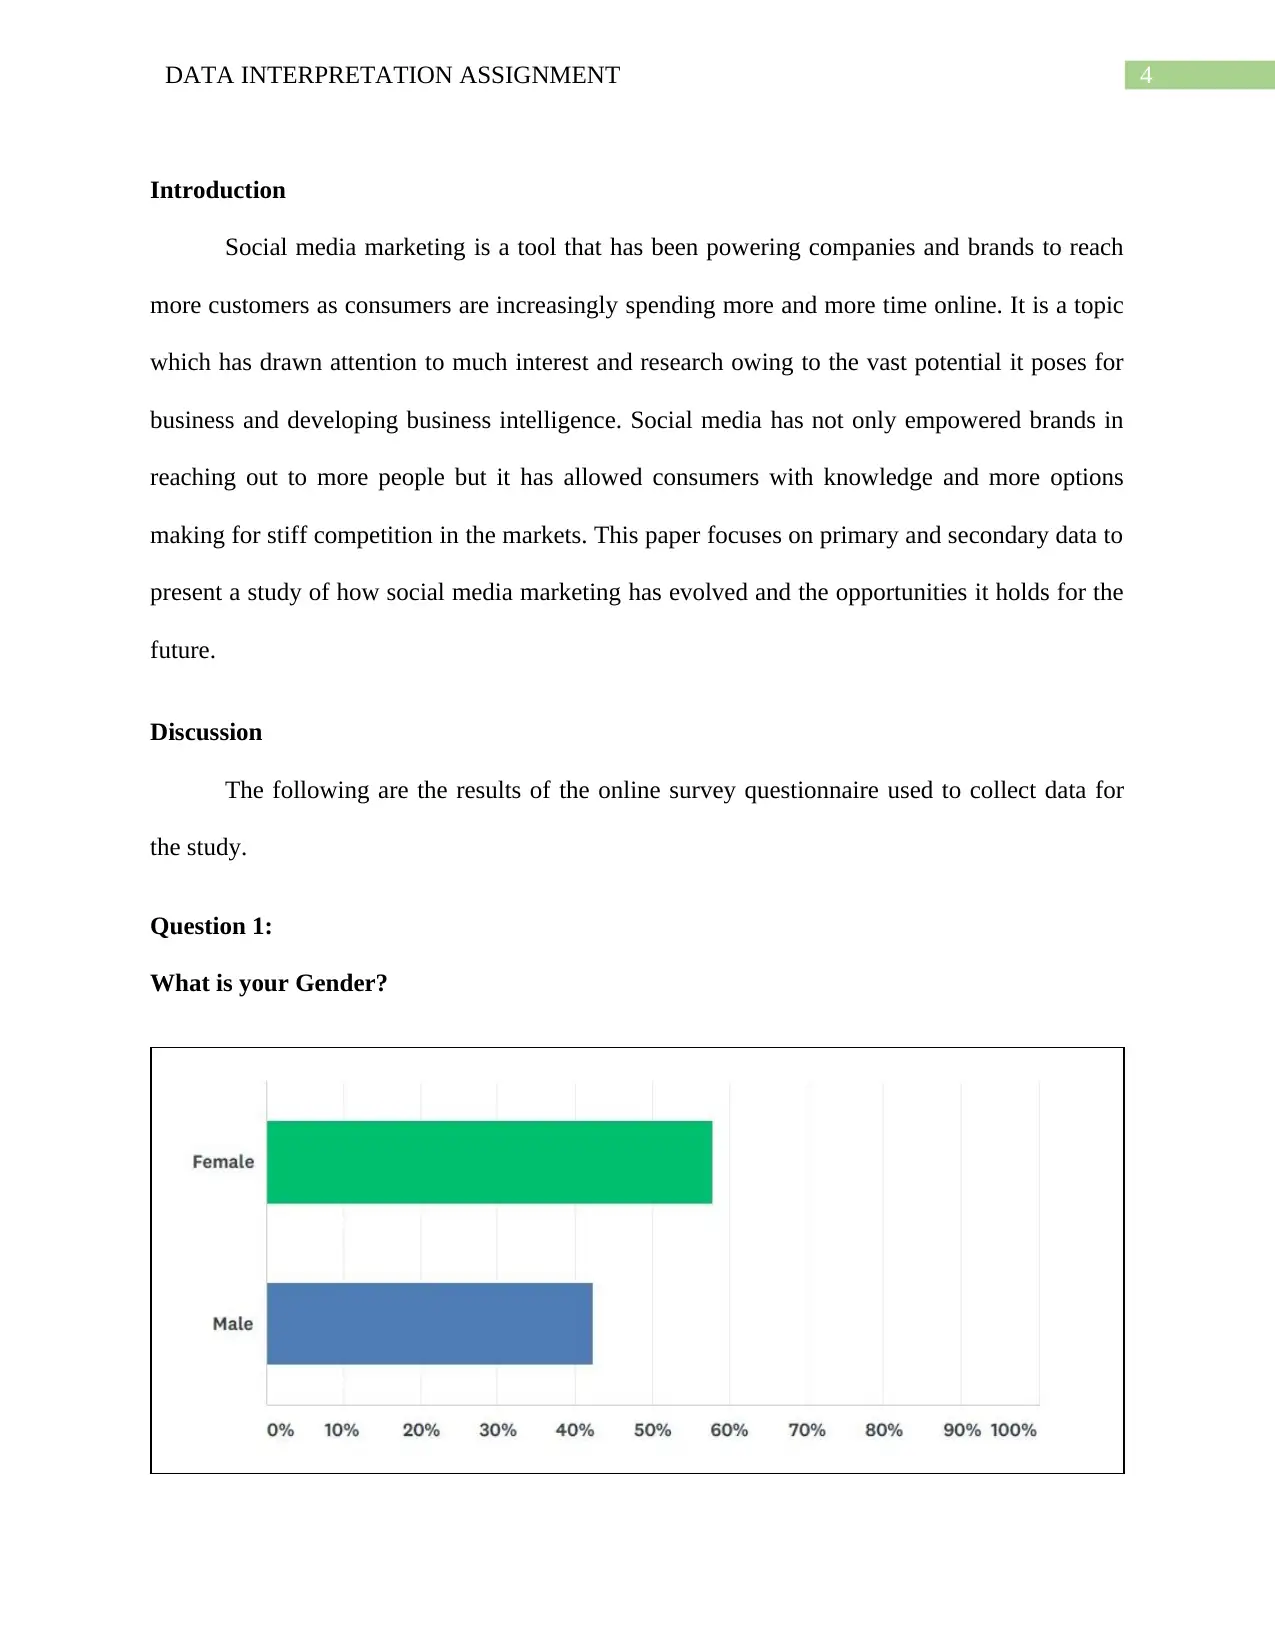
This report presents an analysis of primary and secondary data collected through an online survey to understand the evolution and opportunities within social media marketing. The study, conducted by Juliana Rodrigues de Camargo Queiroz at Emirates Aviation University, examines various aspects of consumer behavior, including gender demographics, income levels, internet usage patterns, and preferences for social media platforms. Key findings highlight the dominance of Facebook, the increasing use of online shopping, and the primary payment methods utilized. The report also explores factors that influence consumer decisions, such as the desire for additional product information and the motivations behind online purchases. Furthermore, the report investigates the factors that discourage online shopping, such as the inability to physically examine products, and the impact of web marketing on consumer satisfaction. The data interpretation reveals valuable insights into the current state of social media marketing and its implications for businesses, with recommendations for future strategies.
Document Page
Running head: DATA INTERPRETATION AND ANALYSIS
DATA INTERPRETATION ASSIGNMENT
Student: Juliana Rodrigues de Camargo Queiroz
Emirates Aviation University
tabler-icon-diamond-filled.svg

Paraphrase This Document

Need a fresh take? Get an instant paraphrase of this document with our AI Paraphraser
Document Page
2DATA INTERPRETATION ASSIGNMENT
Table of Contents
Introduction......................................................................................................................................4
Discussion........................................................................................................................................4
Question 1:...................................................................................................................................4
Question 2:...................................................................................................................................5
Question 3:...................................................................................................................................6
Question 4:...................................................................................................................................9
Question 5:.................................................................................................................................10
Question 6:.................................................................................................................................11
Question 7:.................................................................................................................................12
Question 9:.................................................................................................................................14
Question 10:...............................................................................................................................15
Question 11:...............................................................................................................................16
Question 12:...............................................................................................................................18
Question 13:...............................................................................................................................19
Question 14:...............................................................................................................................20
Question 15:...............................................................................................................................21
Question 16:...............................................................................................................................23
Document Page
3DATA INTERPRETATION ASSIGNMENT
Question 17:...............................................................................................................................24
Question 18................................................................................................................................26
Conclusion.....................................................................................................................................28
Recommendations..........................................................................................................................30
References......................................................................................................................................31
Document Page
4DATA INTERPRETATION ASSIGNMENT
Introduction
Social media marketing is a tool that has been powering companies and brands to reach
more customers as consumers are increasingly spending more and more time online. It is a topic
which has drawn attention to much interest and research owing to the vast potential it poses for
business and developing business intelligence. Social media has not only empowered brands in
reaching out to more people but it has allowed consumers with knowledge and more options
making for stiff competition in the markets. This paper focuses on primary and secondary data to
present a study of how social media marketing has evolved and the opportunities it holds for the
future.
Discussion
The following are the results of the online survey questionnaire used to collect data for
the study.
Question 1:
What is your Gender?
tabler-icon-diamond-filled.svg

Paraphrase This Document

Need a fresh take? Get an instant paraphrase of this document with our AI Paraphraser
Document Page
5DATA INTERPRETATION ASSIGNMENT
Figure 1
Table 1
The first question inquires about the gender of the respondent. It has been found that out
of the total 130 respondents 57.89% were female and 4.31% were males. Therefore, it can be
concluded that the females are active on the social media than that of males. Therefore, various
companies have to look for the females in the market ad provided products and services that are
suitable for the females.
Question 2:
Tick the option that corresponds to your range of monthly household income.
Figure 2
Document Page
6DATA INTERPRETATION ASSIGNMENT
Table 2
34.62% of the respondents of the survey revealed that their monthly household income is
within 5000 Dhs, 16.15% of the respondents said that it is between 5000 Dhs and 10,000 Dhs,
15.38% of the respondents earn between 10,000 Dhs and 20,000 Dhs, 21.54% of the respondents
earn above 20,000 Dhs and the remaining 12.31% do not have a monthly income whatsoever.
Thus the modal class is the interval of monthly income of income being more than 0 and less
than equal to 5000 Dhs. Therefore, it can be concluded that the respondents are suffering from
low income problem.
Question 3:
In a typical month, what do you most often use the internet for?
Document Page
7DATA INTERPRETATION ASSIGNMENT
Figure 3
tabler-icon-diamond-filled.svg

Paraphrase This Document

Need a fresh take? Get an instant paraphrase of this document with our AI Paraphraser
Document Page
8DATA INTERPRETATION ASSIGNMENT
Table 3
The survey revealed that in a typical month the activity that the respondents used the
internet for the most was to send emails and purchase some products or services. 80% of all
respondents listed sending emails as an activity they use the internet for in a typical month and
61.54% had listed purchasing some products as the same. Other activities listed by the
respondents were to keep in touch with friends at 57.69%, 54.62% selected getting directions as
a reason and 52.31% selected keeping up with current events as a reason. Instant messaging,
sharing photos and social networking, each were selected by 49.23% of the respondents. 36.15%
selected sharing videos as a reason for using social media, 26.92% selected reading other
people’s comments, blogs and news stories, 21.54% selected finding other people as a reason
and 10.77% selected making new friends. 6.15% selected starting new dating relationships and
7.69% selected all of the above mentioned reasons. 9.23% had selected others. The mode was
therefore “using emails” which has highest frequency.
Document Page
9DATA INTERPRETATION ASSIGNMENT
Question 4:
How long have you been an internet user?
Figure 4
Table 4
92.31% of the respondents of the online survey were found to have been users of the
internet for more than 5 years, 4.62% had been internet users for between two to five years,
2.31% were the same for less than two years and only 0.77% had been users for less than a year.
The mode is therefore greater than five. According to the tables and graphs, it can be analysed
Document Page
10DATA INTERPRETATION ASSIGNMENT
that most of the people are using internet more than five years. Therefore, companies need to
focus in the online marketing strategies to gather more and more customer over the internet.
Question 5:
With what frequency do you use the internet?
Figure 5
Table 5
74.62% of the respondents of the online survey had responded that they use the internet
many times during the day, 14.62% of the respondents had responded that they used the internet
tabler-icon-diamond-filled.svg

Paraphrase This Document

Need a fresh take? Get an instant paraphrase of this document with our AI Paraphraser
Document Page
11DATA INTERPRETATION ASSIGNMENT
2 to 3 times during the day,7.69% of the respondents selected once a week that they used the
internet and 0.77% responded that they used the internet only once a month. The mode is
therefore “many times”. As per the graphs and tables, most of the customers are using many
times daily internet in the market.
Question 6:
What is the average time that you spend on the internet?
Figure 6
Table 6
Document Page
12DATA INTERPRETATION ASSIGNMENT
55.38% of the respondents of the survey revealed that they used the internet for a period
of between 1 to 5 hours a day, 27.69% revealed that they spent between 6 to 12 hours per day on
the internet, 10% revealed that they spent more than 12 hour a day on the internet and 6.92%
spent less than an hour per day. The mode is thus “between 1 to 5 hours per day”. Most of the
people have been using the internet for 1 to 5 hours a day. The use of the internet have been
helping in gathering information in the market.
Question 7:
List with numbers in order of importance to you, which social network do you use most
often? (Weighted average score of social networking sites used most often)
Table 7
The respondents were asked to rate social networks as per order of importance to them,
reflecting their usage of the networking sites. The weighted average of the scores for each of the
sites reveals that Facebook occupies the first position with 50.77% score, Instagram scored
11.54%, followed by Snapchat with 7.69% and twitter and Linkedin both having 4.62% score.
Most of the people are using Facebook as a social media over the internet. Therefore, companies
have to have to advertise their products and services over the Facebook. The use of social media
marketing strategies have helped in increasing the production of companies in the market.
Question 8:
chevron_up_icon
1 out of 36
circle_padding
hide_on_mobile
zoom_out_icon
[object Object]