Comprehensive Report on Social Media Marketing Data Analysis

Verified

Added on  2023/01/09

|19
|4154
|30
Report
AI Summary
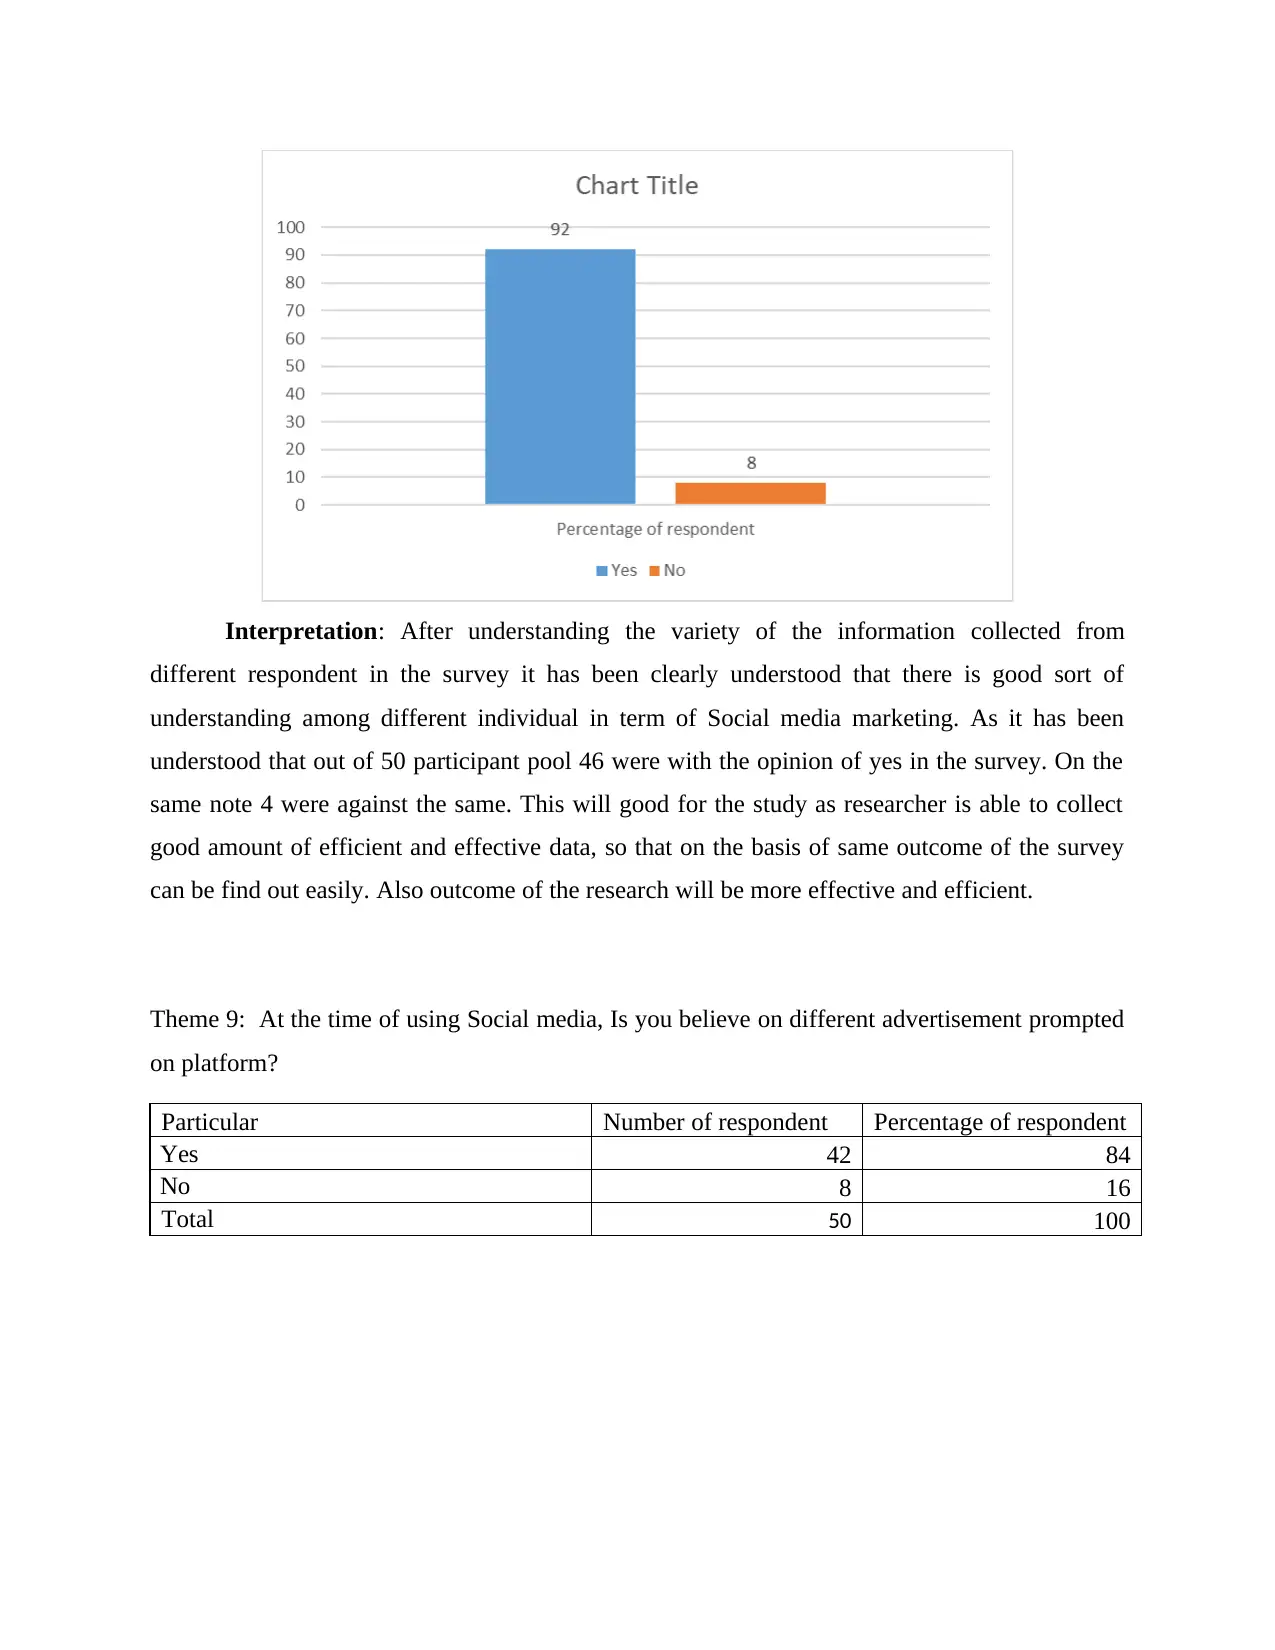
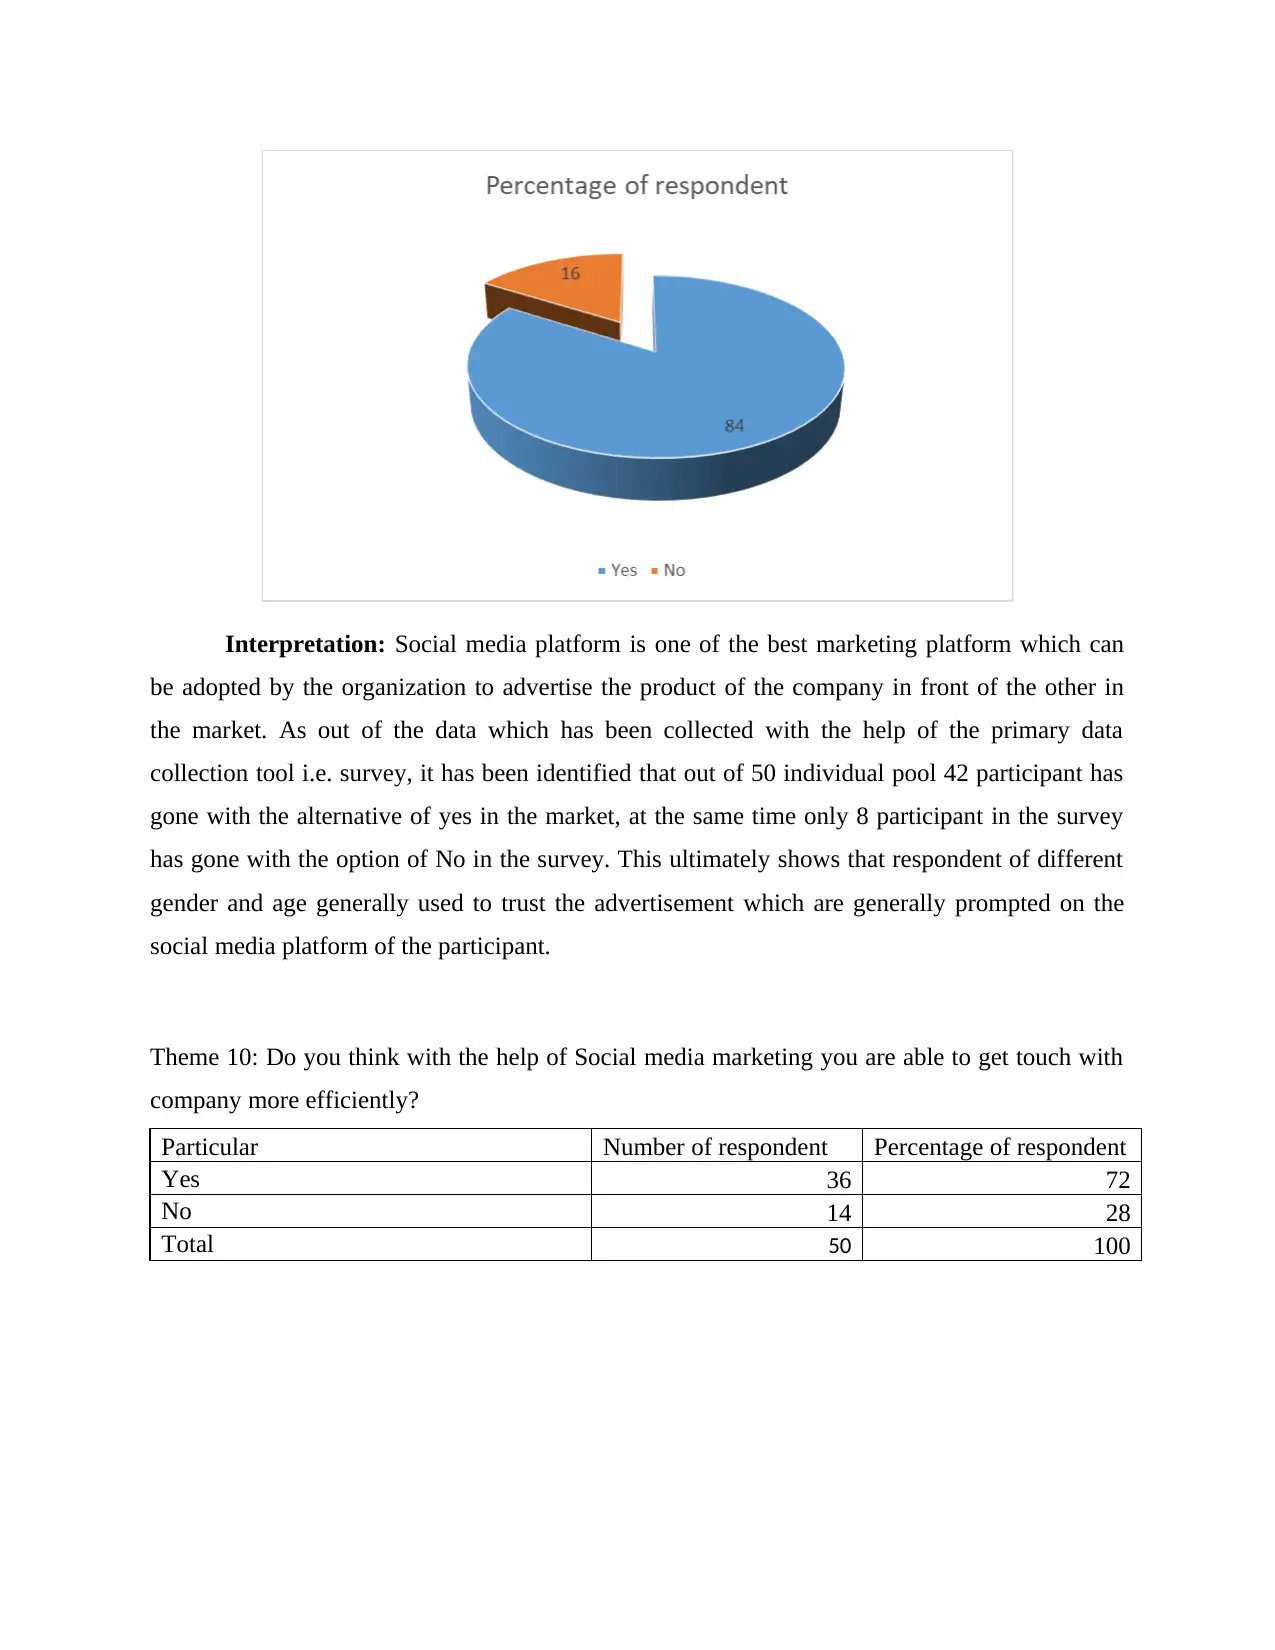
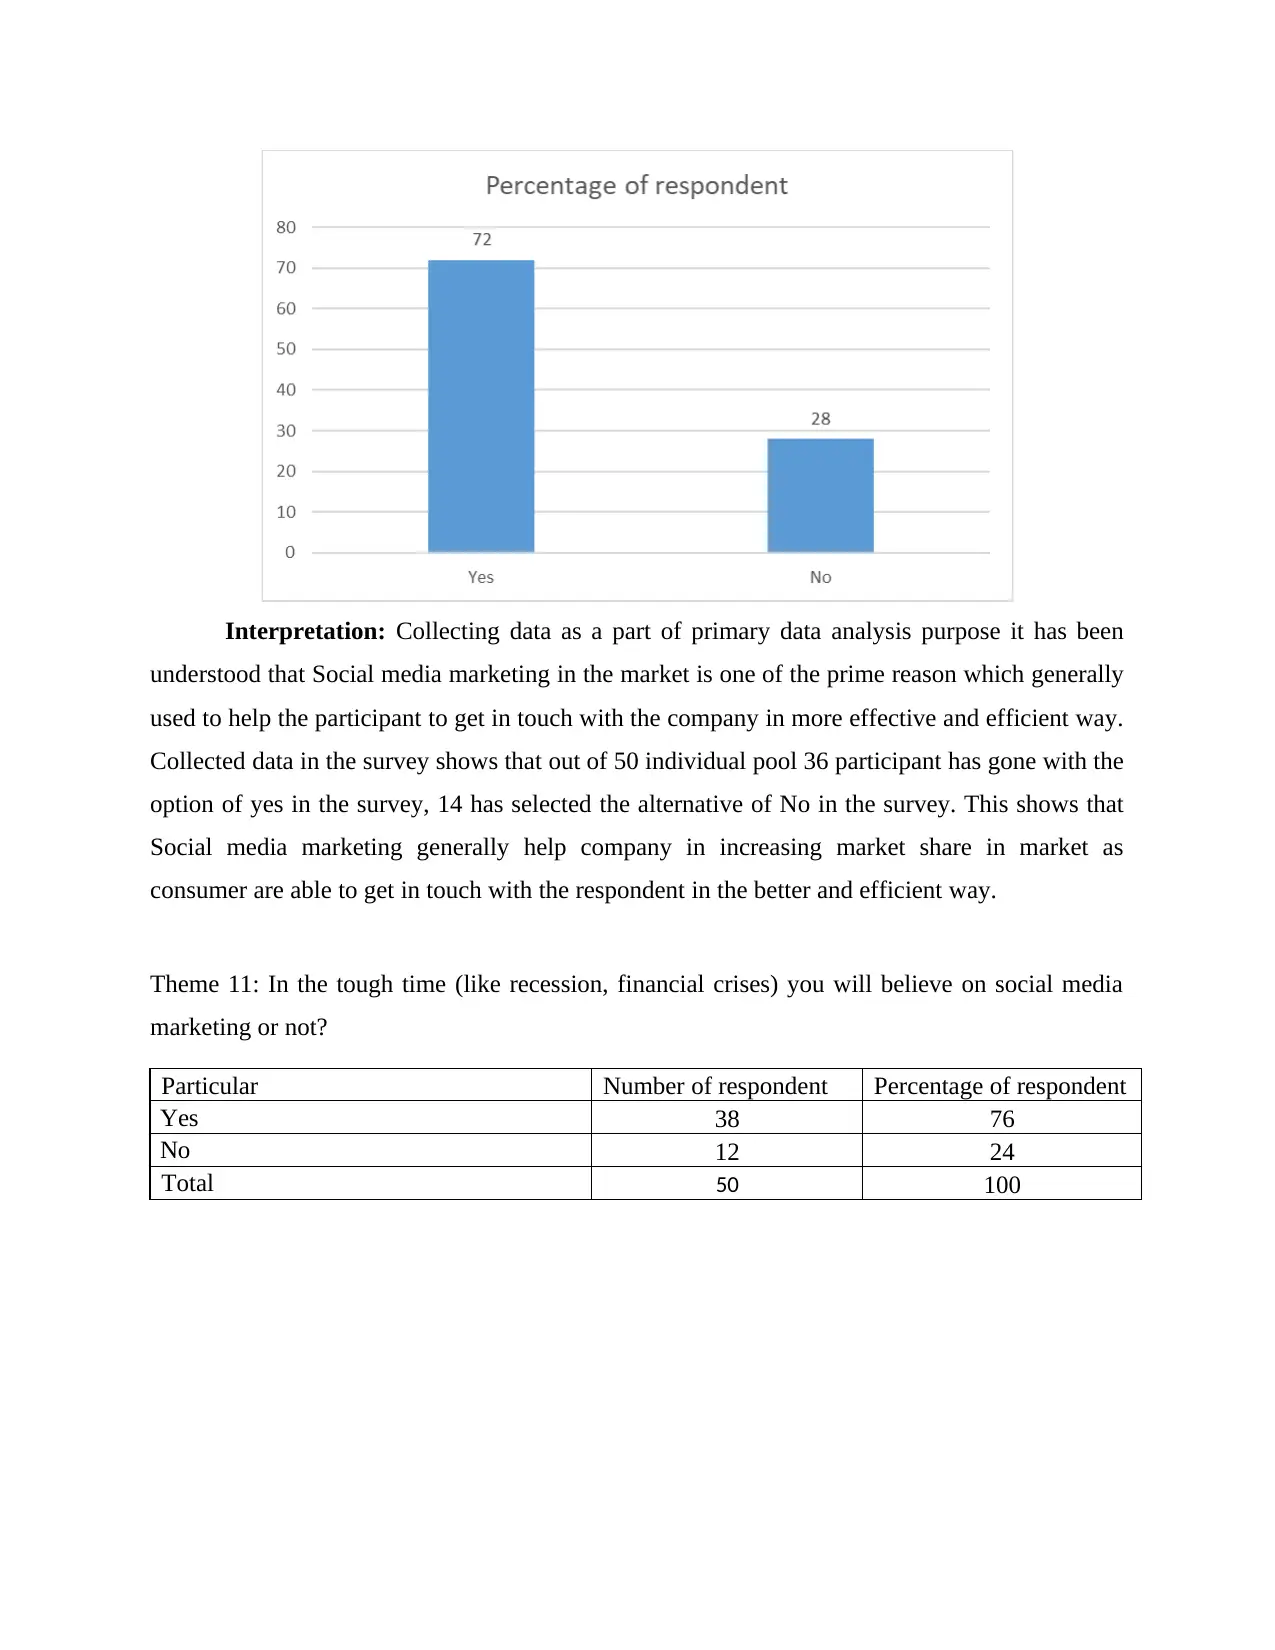
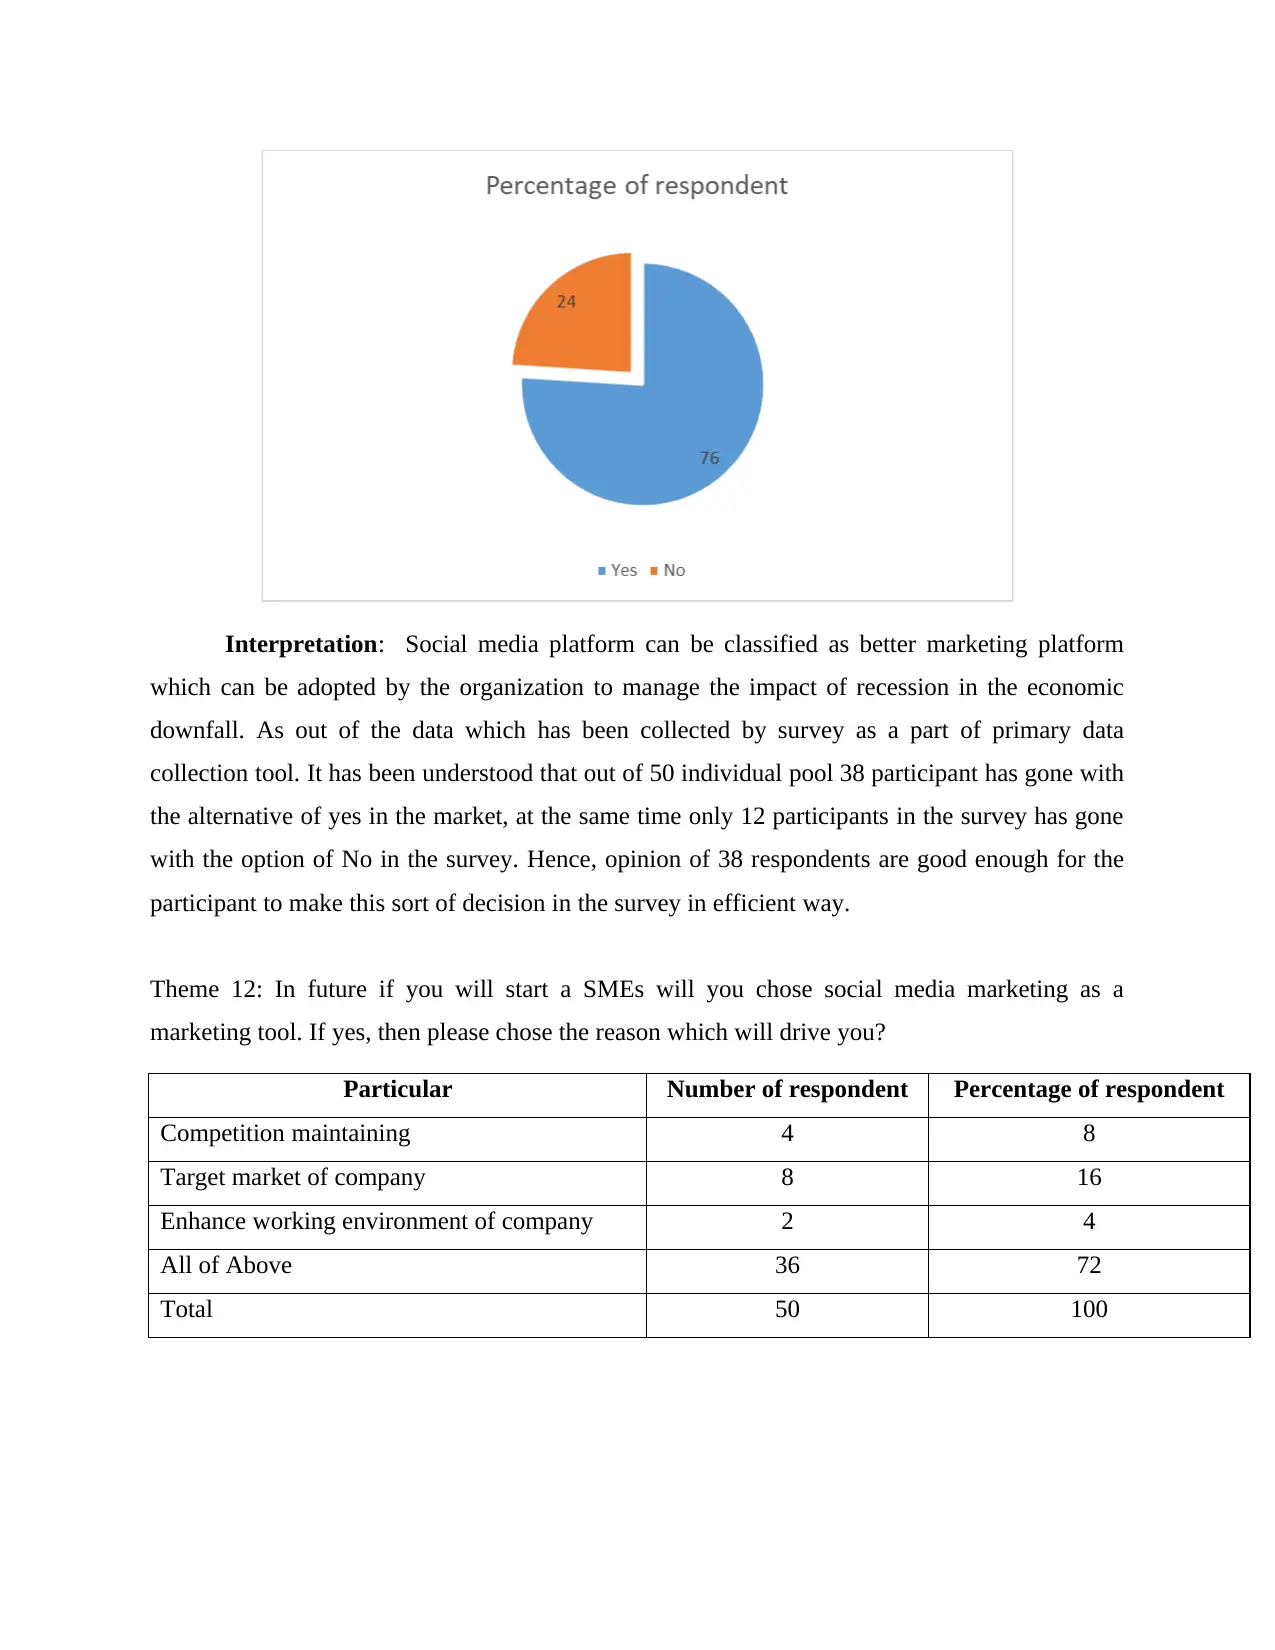
This report presents an analysis of primary data collected through a survey on social media marketing. The survey gathered responses from 50 participants, encompassing diverse demographics including gender, age, education, and occupation. The report examines social media platform usage, frequency of use, and the purposes for which individuals utilize these platforms. Key findings include the popularity of Facebook and Instagram, the trust placed in social media advertisements, and the perceived effectiveness of social media marketing in connecting with companies. The analysis further explores the role of social media marketing during challenging economic times and its potential for small and medium-sized enterprises (SMEs). The data reveals that a majority of respondents understand and trust social media marketing, viewing it as a valuable tool for business growth and customer engagement. The report concludes with a discussion on the implications of these findings, highlighting the importance of social media marketing as a digital marketing medium.
Document Page
DATA ANALYSIS
tabler-icon-diamond-filled.svg

Paraphrase This Document

Need a fresh take? Get an instant paraphrase of this document with our AI Paraphraser
Document Page
INTRODUCTION
MAIN BODY
Theme 1: Which gender do you identify with?
Particular Number of respondent Percentage of respondent
Female 25 50
Male 23 46
Other 2 4
Prefer not to say 0 0
Total 50 100
Interpretation: Understanding the data collected with the help of primary data collection
tool it has been understood that scholar has selected diversified sample base. As scholar has
selected respondent from all the gender, there are 25 male, 23 females and 2 other gender
respondents in survey. This has assisted the scholar in understanding the point of view of
different respondent belonging to different, hence it is very important as topic of the research is
very wast hence point of view of different category employee is generally required.
Document Page
Theme 2: Which age group do you belong to?
Particular Number of respondent Percentage of respondent
18-25 18 36
26-30 4 8
31-35 21 42
36-40 4 8
Above 40 3 6
Prefer not to say 0 0
Total 50 100
Interpretation: After understanding and analysing above presented data it has been
understood that scholar has chosen respondents of all age group. This has eventually helped the
scholar in getting information and point of view of different age group individual. Out of 50, 18
belong to age group of 18-25, 4 belong to 26-35, 21 belong to 31-35, 4 belong to 36-40 and 3
belong to Above 40. Also, having individual of different age will assist the client in
understanding the difference of point of view of different age group customer in the market, it is
very important for business.
Document Page
Theme 3: What is your highest education level?
Particular Number of respondent Percentage of respondent
Secondary 0 0
Diploma 0 0
Graduate 16 32
Postgraduate 26 52
Doctoral 8 16
Total 50 100
Interpretation: Above presented data shows that almost all the respondent from which
data has been collected belongs to three categories of education. Data shows that 26 individual
belong to category of post Graduate, 16 belong to Doctoral and 8 belong to category of Graduate.
This has assisted the scholar in understanding the point of view of different category individual.
As all the category or section individual used to use social media platform for different purpose
in real.
Theme 4: What is your occupation?
Particular
Number of
respondent Percentage of respondent
Job – specify business category 23 46
tabler-icon-diamond-filled.svg

Paraphrase This Document

Need a fresh take? Get an instant paraphrase of this document with our AI Paraphraser
Document Page
Own Business 25 50
Student 0 0
Unemployed 2 4
Total 50 100
Interpretation: Collected data help in understanding that most of the individual in
survey generally belong to two categories, job and own business. As it was identified that 25
respondents were having own business, 23 were having job in retail, medical and hospitality
sector and only 2 respondents were unemployed in the survey as well. This is very good sign for
the survey as it has been identified that there are variety of different sector respondent who will
pass on their point of view. This may complicate study at some extent but it will provide the clear
image to the scholar as well.
Theme 5: Which social media sites do you have accounts with?
Particular Number of respondent Percentage of respondent
Facebook 24 30
Twitter 20 25
Instagram 25 31.25
YouTube 21 26.25
Others( Please Name) 0 0
Document Page
Interpretation: After going through the different data which has been collected by the
primary data collection tool it has been analysed that Facebook and Instagram are two platforms
on which almost all the respondent has their account. It has been analysed that out of the pool of
50 participants 24 has chosen Facebook, 25 has chosen Instagram and remaining one participant
has gone with the option of others in the survey. YouTube was chosen by 21 and twitter by 20
participants. There were respondent who has selected more than one option in the question. So
above presented data shows the number of respondent has selected the option and chart has been
presented in the same way.
Theme 6: Which media do you how often?
Particular Number of
respondent
Percentage of
respondent
Facebook 42 46
Instagram 36 40
Twitter 18 19
Others 4 5
Document Page
Interpretation: After going through the different data which has been collected by the
primary data collection tool it has been analysed that Facebook and Instagram are two platforms
which can be used by the organization in the long run. It has been analysed that out of the pool of
50 participants 42 has chosen Facebook, 36 has chosen Instagram, 18 has gone with Twitter and
remaining one participant has gone with the option of others in the survey. At the same time, it
has to be also consider by the organization that they do not overlook the opinion of 18
respondent in a survey as well. As they have selected the alternative of twitter. Hence, respondent
has to consider the same as well.
Theme 7: What do you use social media for? Please place in order of which you use most, for
which purpose
Particular Number of respondent Percentage of respondent
Keeping in touch with friends and family 16 32
Buying and selling 16 32
Inspiration 25 50
News 12 24
To meet new friends 0 0
To find employment 8 16
Other (Please specify) 0 0
Total 50 100
tabler-icon-diamond-filled.svg

Paraphrase This Document

Need a fresh take? Get an instant paraphrase of this document with our AI Paraphraser
Document Page
Interpretation: Evaluating above presented data generally help in understanding that
there are variety of different reason for which participant used to use social media marketing in
organization. As there was no specific result which was supported by different participant. As 16
has chosen To keep in touch with friends and family their first priority, 16 participant has
selected Buying and selling their first priority, 12 as selected news option and 8 to find
employment. This data clearly used to give idea that there are variety of the different type of
benefit which used to drive the individual to use social media platform in the market.
Theme 8: Is digital marketing through social media concept is understood by you?
Particular Number of
respondent
Percentage of
respondent
Yes 46 92
No 4 8
Total 50 100
Document Page
Interpretation: After understanding the variety of the information collected from
different respondent in the survey it has been clearly understood that there is good sort of
understanding among different individual in term of Social media marketing. As it has been
understood that out of 50 participant pool 46 were with the opinion of yes in the survey. On the
same note 4 were against the same. This will good for the study as researcher is able to collect
good amount of efficient and effective data, so that on the basis of same outcome of the survey
can be find out easily. Also outcome of the research will be more effective and efficient.
Theme 9: At the time of using Social media, Is you believe on different advertisement prompted
on platform?
Particular Number of respondent Percentage of respondent
Yes 42 84
No 8 16
Total 50 100
Document Page
Interpretation: Social media platform is one of the best marketing platform which can
be adopted by the organization to advertise the product of the company in front of the other in
the market. As out of the data which has been collected with the help of the primary data
collection tool i.e. survey, it has been identified that out of 50 individual pool 42 participant has
gone with the alternative of yes in the market, at the same time only 8 participant in the survey
has gone with the option of No in the survey. This ultimately shows that respondent of different
gender and age generally used to trust the advertisement which are generally prompted on the
social media platform of the participant.
Theme 10: Do you think with the help of Social media marketing you are able to get touch with
company more efficiently?
Particular Number of respondent Percentage of respondent
Yes 36 72
No 14 28
Total 50 100
tabler-icon-diamond-filled.svg

Paraphrase This Document

Need a fresh take? Get an instant paraphrase of this document with our AI Paraphraser
Document Page
Interpretation: Collecting data as a part of primary data analysis purpose it has been
understood that Social media marketing in the market is one of the prime reason which generally
used to help the participant to get in touch with the company in more effective and efficient way.
Collected data in the survey shows that out of 50 individual pool 36 participant has gone with the
option of yes in the survey, 14 has selected the alternative of No in the survey. This shows that
Social media marketing generally help company in increasing market share in market as
consumer are able to get in touch with the respondent in the better and efficient way.
Theme 11: In the tough time (like recession, financial crises) you will believe on social media
marketing or not?
Particular Number of respondent Percentage of respondent
Yes 38 76
No 12 24
Total 50 100
Document Page
Interpretation: Social media platform can be classified as better marketing platform
which can be adopted by the organization to manage the impact of recession in the economic
downfall. As out of the data which has been collected by survey as a part of primary data
collection tool. It has been understood that out of 50 individual pool 38 participant has gone with
the alternative of yes in the market, at the same time only 12 participants in the survey has gone
with the option of No in the survey. Hence, opinion of 38 respondents are good enough for the
participant to make this sort of decision in the survey in efficient way.
Theme 12: In future if you will start a SMEs will you chose social media marketing as a
marketing tool. If yes, then please chose the reason which will drive you?
Particular Number of respondent Percentage of respondent
Competition maintaining 4 8
Target market of company 8 16
Enhance working environment of company 2 4
All of Above 36 72
Total 50 100
chevron_up_icon
1 out of 19
circle_padding
hide_on_mobile
zoom_out_icon
[object Object]