Investigating Social Media Impact on Customer Behavior at Sainsbury's
VerifiedAdded on 2023/01/11
|15
|3422
|94
Report
AI Summary
This report investigates the impact of social media on customer buying behavior, focusing on Sainsbury's. It uses a quantitative approach with SPSS analysis to determine the influence of social media marketing on consumer purchase decisions. The research employs a survey method with questionnaires distributed to 55 customers selected through simple random sampling. Key findings reveal that a significant portion of respondents are influenced by social media when making purchasing decisions, with Facebook identified as a prominent platform. Chi-square tests indicate no significant association between gender or age and purchasing influence, suggesting that social media's impact is consistent across different demographic groups. The report concludes by highlighting the challenges companies face in leveraging social media for marketing and suggests strategies to minimize these challenges. Desklib provides access to this report and many other solved assignments for students.

SPSS Assessment
Paraphrase This Document
Need a fresh take? Get an instant paraphrase of this document with our AI Paraphraser
Table of Contents
INTRODUCTION......................................................................................................................3
Literature review....................................................................................................................3
Research methods...................................................................................................................4
Data analysis..........................................................................................................................4
CONCLUSION........................................................................................................................13
REFERENCES.........................................................................................................................14
Appendix..................................................................................................................................15
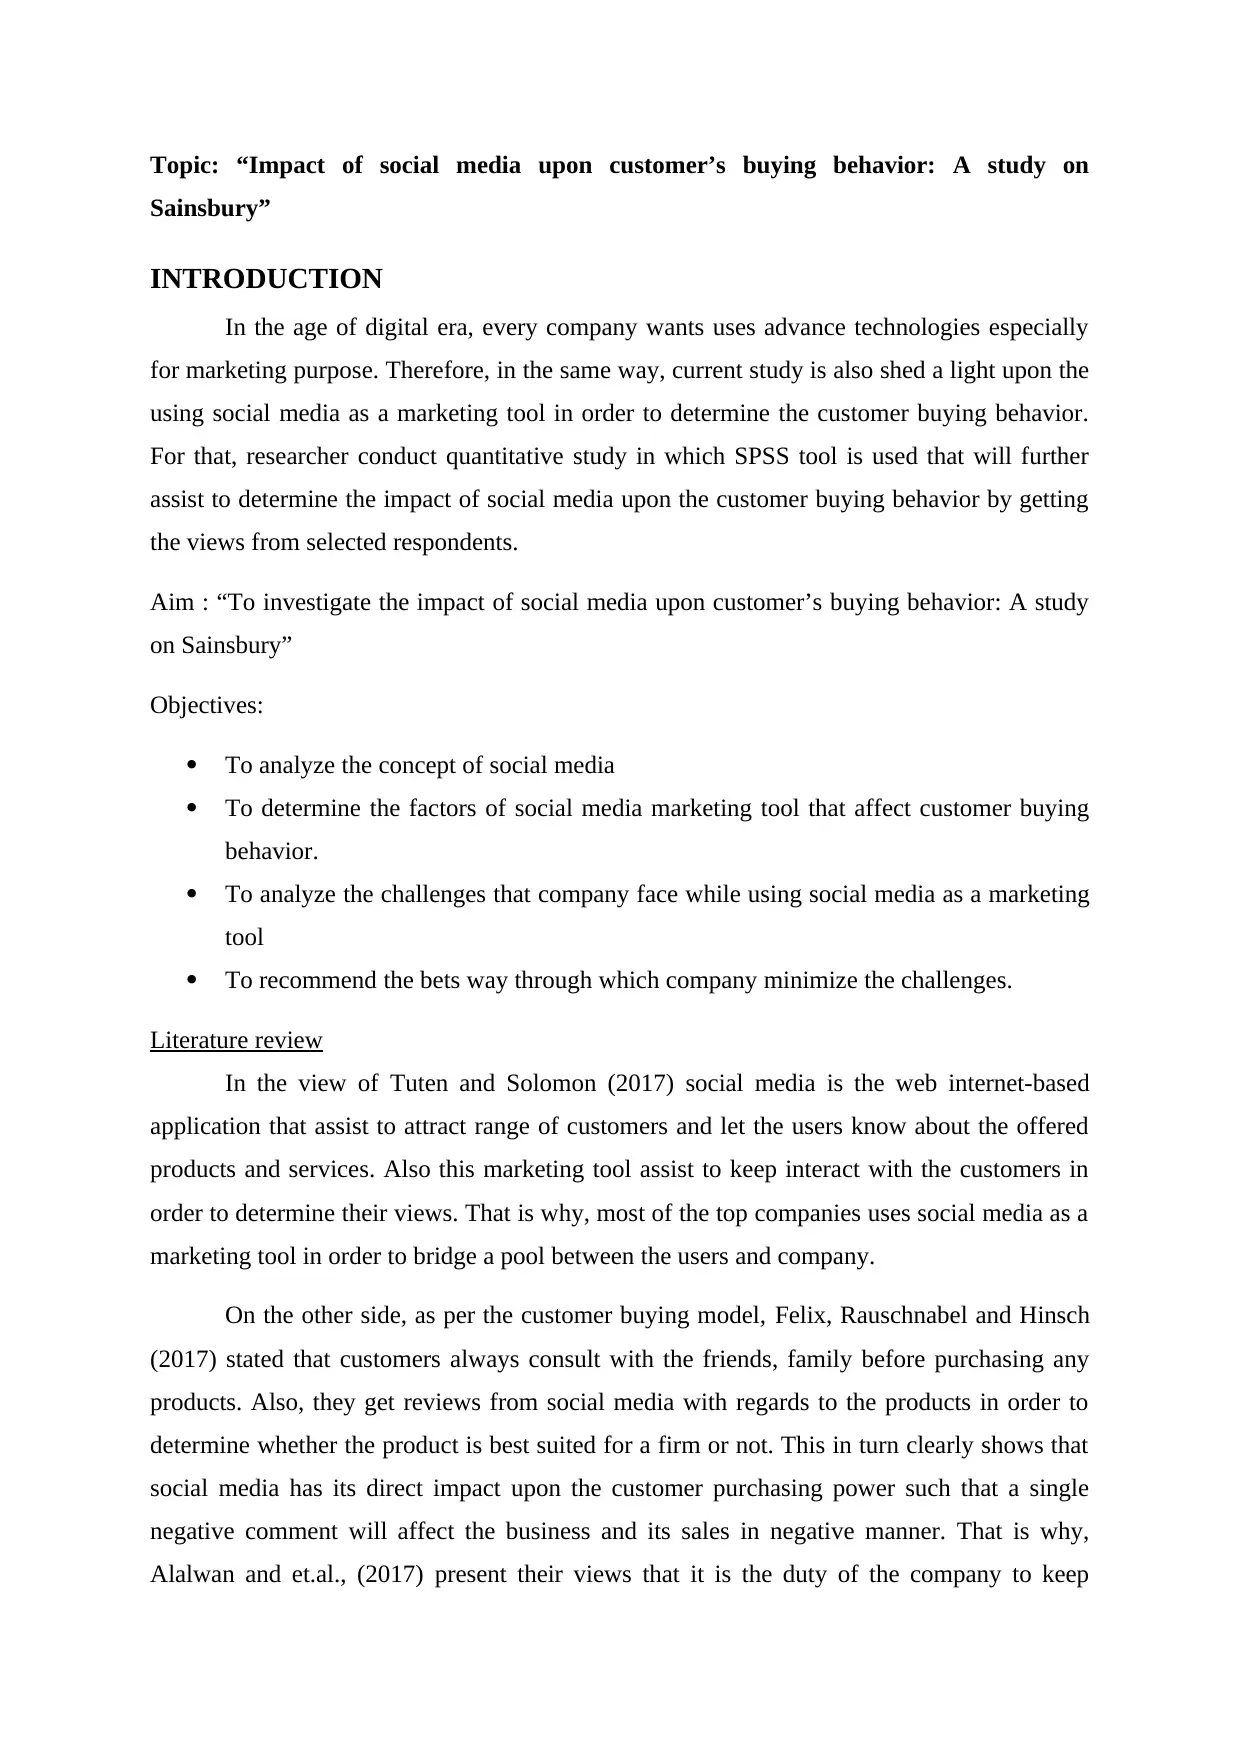
Topic: “Impact of social media upon customer’s buying behavior: A study on
Sainsbury”
INTRODUCTION
In the age of digital era, every company wants uses advance technologies especially
for marketing purpose. Therefore, in the same way, current study is also shed a light upon the
using social media as a marketing tool in order to determine the customer buying behavior.
For that, researcher conduct quantitative study in which SPSS tool is used that will further
assist to determine the impact of social media upon the customer buying behavior by getting
the views from selected respondents.
Aim : “To investigate the impact of social media upon customer’s buying behavior: A study
on Sainsbury”
Objectives:
To analyze the concept of social media
To determine the factors of social media marketing tool that affect customer buying
behavior.
To analyze the challenges that company face while using social media as a marketing
tool
To recommend the bets way through which company minimize the challenges.
Literature review
In the view of Tuten and Solomon (2017) social media is the web internet-based
application that assist to attract range of customers and let the users know about the offered
products and services. Also this marketing tool assist to keep interact with the customers in
order to determine their views. That is why, most of the top companies uses social media as a
marketing tool in order to bridge a pool between the users and company.
On the other side, as per the customer buying model, Felix, Rauschnabel and Hinsch
(2017) stated that customers always consult with the friends, family before purchasing any
products. Also, they get reviews from social media with regards to the products in order to
determine whether the product is best suited for a firm or not. This in turn clearly shows that
social media has its direct impact upon the customer purchasing power such that a single
negative comment will affect the business and its sales in negative manner. That is why,
Alalwan and et.al., (2017) present their views that it is the duty of the company to keep
⊘ This is a preview!⊘
Do you want full access?
Subscribe today to unlock all pages.
Trusted by 1+ million students worldwide
providing the best variety of products so that it get positive reviews. Otherwise it affects the
overall brand image of the company in negative manner.
In the view of Godey and et.al., (2016) stated that company faces issue with regards to
developing the social media strategy and it is not possible to measure the social media ROI
because of huge traffic. Therefore, it is stated that if the company uses social media as a
marketing tool, then it must have specialized IT professionals who are always ready to solve
the problem and meet the define aim by minimize the challenges. On contrary, Dahl (2018)
stated that many times, some non-user also make adverse comment that also affect the
purchase decision that is why, organization make sure that it develops a strategy to minimize
the challenge.
Research methods
For the current study, researcher chooses quantitative study over qualitative study,
and this will help to generate the best outcomes by using SPSS tool. Further, different test are
also applied in order to determine the impact of social media upon customer buying behavior.
Also, deductive research approach and positivism research philosophy has been chosen
because it assist to interpret the results in better manner by getting the views from the
selected respondents.
In addition to this, 55 customers are chosen through simple random sampling method
and this will help to determine the views of al those respondents who are selecting the
products after taking reviews from social media. Further, both primary and secondary data
collection methods are used. Like, for literature review, researcher selected books and articles
which are published in recent years and under primary, researcher chooses survey method in
which questionnaire is design through which scholar determine the impact of social media
upon the customer buying behavior.
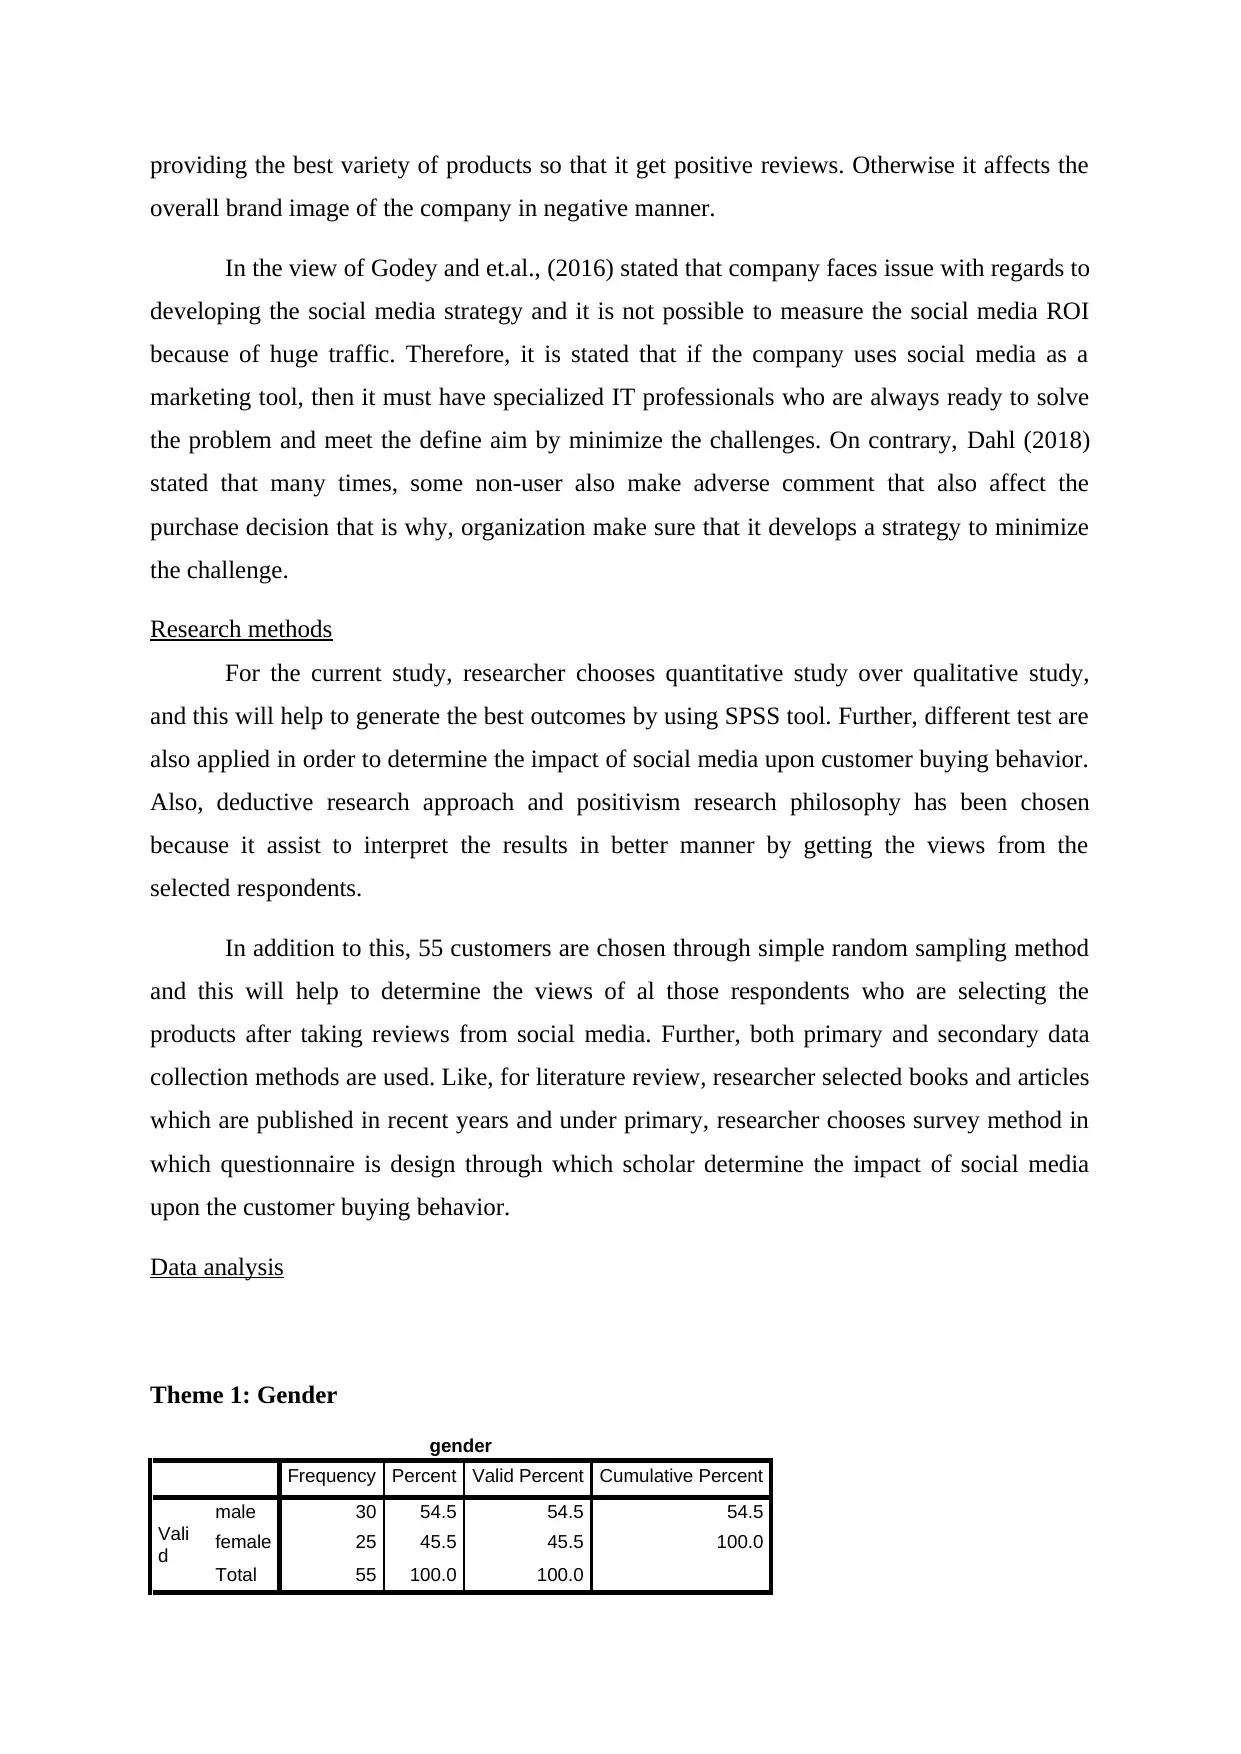
Data analysis
Theme 1: Gender
gender
Frequency Percent Valid Percent Cumulative Percent
Vali
d
male 30 54.5 54.5 54.5
female 25 45.5 45.5 100.0
Total 55 100.0 100.0
overall brand image of the company in negative manner.
In the view of Godey and et.al., (2016) stated that company faces issue with regards to
developing the social media strategy and it is not possible to measure the social media ROI
because of huge traffic. Therefore, it is stated that if the company uses social media as a
marketing tool, then it must have specialized IT professionals who are always ready to solve
the problem and meet the define aim by minimize the challenges. On contrary, Dahl (2018)
stated that many times, some non-user also make adverse comment that also affect the
purchase decision that is why, organization make sure that it develops a strategy to minimize
the challenge.
Research methods
For the current study, researcher chooses quantitative study over qualitative study,
and this will help to generate the best outcomes by using SPSS tool. Further, different test are
also applied in order to determine the impact of social media upon customer buying behavior.
Also, deductive research approach and positivism research philosophy has been chosen
because it assist to interpret the results in better manner by getting the views from the
selected respondents.
In addition to this, 55 customers are chosen through simple random sampling method
and this will help to determine the views of al those respondents who are selecting the
products after taking reviews from social media. Further, both primary and secondary data
collection methods are used. Like, for literature review, researcher selected books and articles
which are published in recent years and under primary, researcher chooses survey method in
which questionnaire is design through which scholar determine the impact of social media
upon the customer buying behavior.
Data analysis
Theme 1: Gender
gender
Frequency Percent Valid Percent Cumulative Percent
Vali
d
male 30 54.5 54.5 54.5
female 25 45.5 45.5 100.0
Total 55 100.0 100.0
Paraphrase This Document
Need a fresh take? Get an instant paraphrase of this document with our AI Paraphraser
Interpretation: From the above, it is interpreted that out of 55 respondents, there are 30 male
and 25 females.
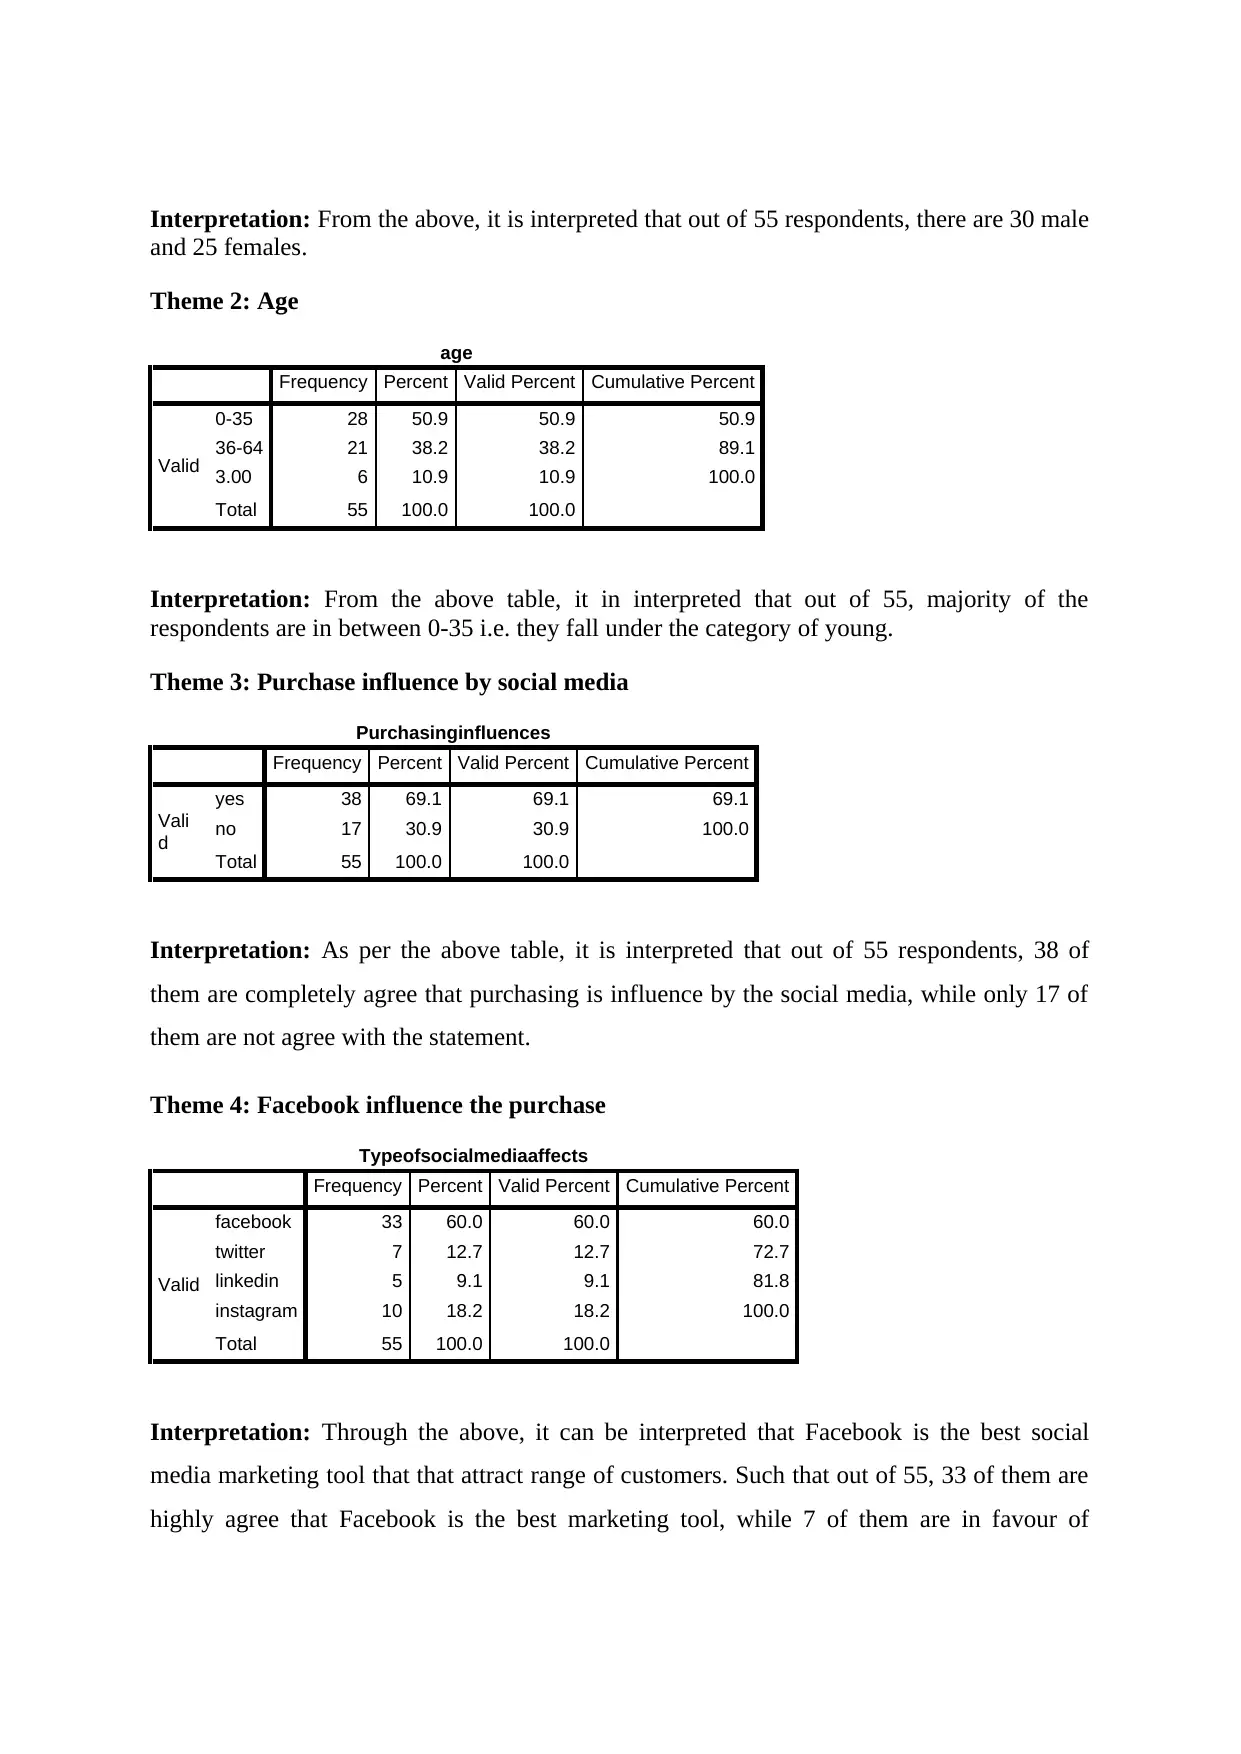
Theme 2: Age
age
Frequency Percent Valid Percent Cumulative Percent
Valid
0-35 28 50.9 50.9 50.9
36-64 21 38.2 38.2 89.1
3.00 6 10.9 10.9 100.0
Total 55 100.0 100.0
Interpretation: From the above table, it in interpreted that out of 55, majority of the
respondents are in between 0-35 i.e. they fall under the category of young.
Theme 3: Purchase influence by social media
Purchasinginfluences
Frequency Percent Valid Percent Cumulative Percent
Vali
d
yes 38 69.1 69.1 69.1
no 17 30.9 30.9 100.0
Total 55 100.0 100.0
Interpretation: As per the above table, it is interpreted that out of 55 respondents, 38 of
them are completely agree that purchasing is influence by the social media, while only 17 of
them are not agree with the statement.
Theme 4: Facebook influence the purchase
Typeofsocialmediaaffects
Frequency Percent Valid Percent Cumulative Percent
Valid
facebook 33 60.0 60.0 60.0
twitter 7 12.7 12.7 72.7
linkedin 5 9.1 9.1 81.8
instagram 10 18.2 18.2 100.0
Total 55 100.0 100.0
Interpretation: Through the above, it can be interpreted that Facebook is the best social
media marketing tool that that attract range of customers. Such that out of 55, 33 of them are
highly agree that Facebook is the best marketing tool, while 7 of them are in favour of
and 25 females.
Theme 2: Age
age
Frequency Percent Valid Percent Cumulative Percent
Valid
0-35 28 50.9 50.9 50.9
36-64 21 38.2 38.2 89.1
3.00 6 10.9 10.9 100.0
Total 55 100.0 100.0
Interpretation: From the above table, it in interpreted that out of 55, majority of the
respondents are in between 0-35 i.e. they fall under the category of young.
Theme 3: Purchase influence by social media
Purchasinginfluences
Frequency Percent Valid Percent Cumulative Percent
Vali
d
yes 38 69.1 69.1 69.1
no 17 30.9 30.9 100.0
Total 55 100.0 100.0
Interpretation: As per the above table, it is interpreted that out of 55 respondents, 38 of
them are completely agree that purchasing is influence by the social media, while only 17 of
them are not agree with the statement.
Theme 4: Facebook influence the purchase
Typeofsocialmediaaffects
Frequency Percent Valid Percent Cumulative Percent
Valid
facebook 33 60.0 60.0 60.0
twitter 7 12.7 12.7 72.7
linkedin 5 9.1 9.1 81.8
instagram 10 18.2 18.2 100.0
Total 55 100.0 100.0
Interpretation: Through the above, it can be interpreted that Facebook is the best social
media marketing tool that that attract range of customers. Such that out of 55, 33 of them are
highly agree that Facebook is the best marketing tool, while 7 of them are in favour of
Twitter, 10 of them state that Instagram is the best marketing tool. While only 5 of them state
that LinkedIn is the best influencer tool.
Theme 5: Most of the employees are highly agree that social media changes the view of
customers
effectofcommentsondecisionmaking
Frequency Percen
t
Valid Percent Cumulative Percent
Valid
SA 21 38.2 38.9 38.9
A 6 10.9 11.1 50.0
neutral 15 27.3 27.8 77.8
disagree
d 9 16.4 16.7 94.4
SD 3 5.5 5.6 100.0
Total 54 98.2 100.0
Missing System 1 1.8
Total 55 100.0
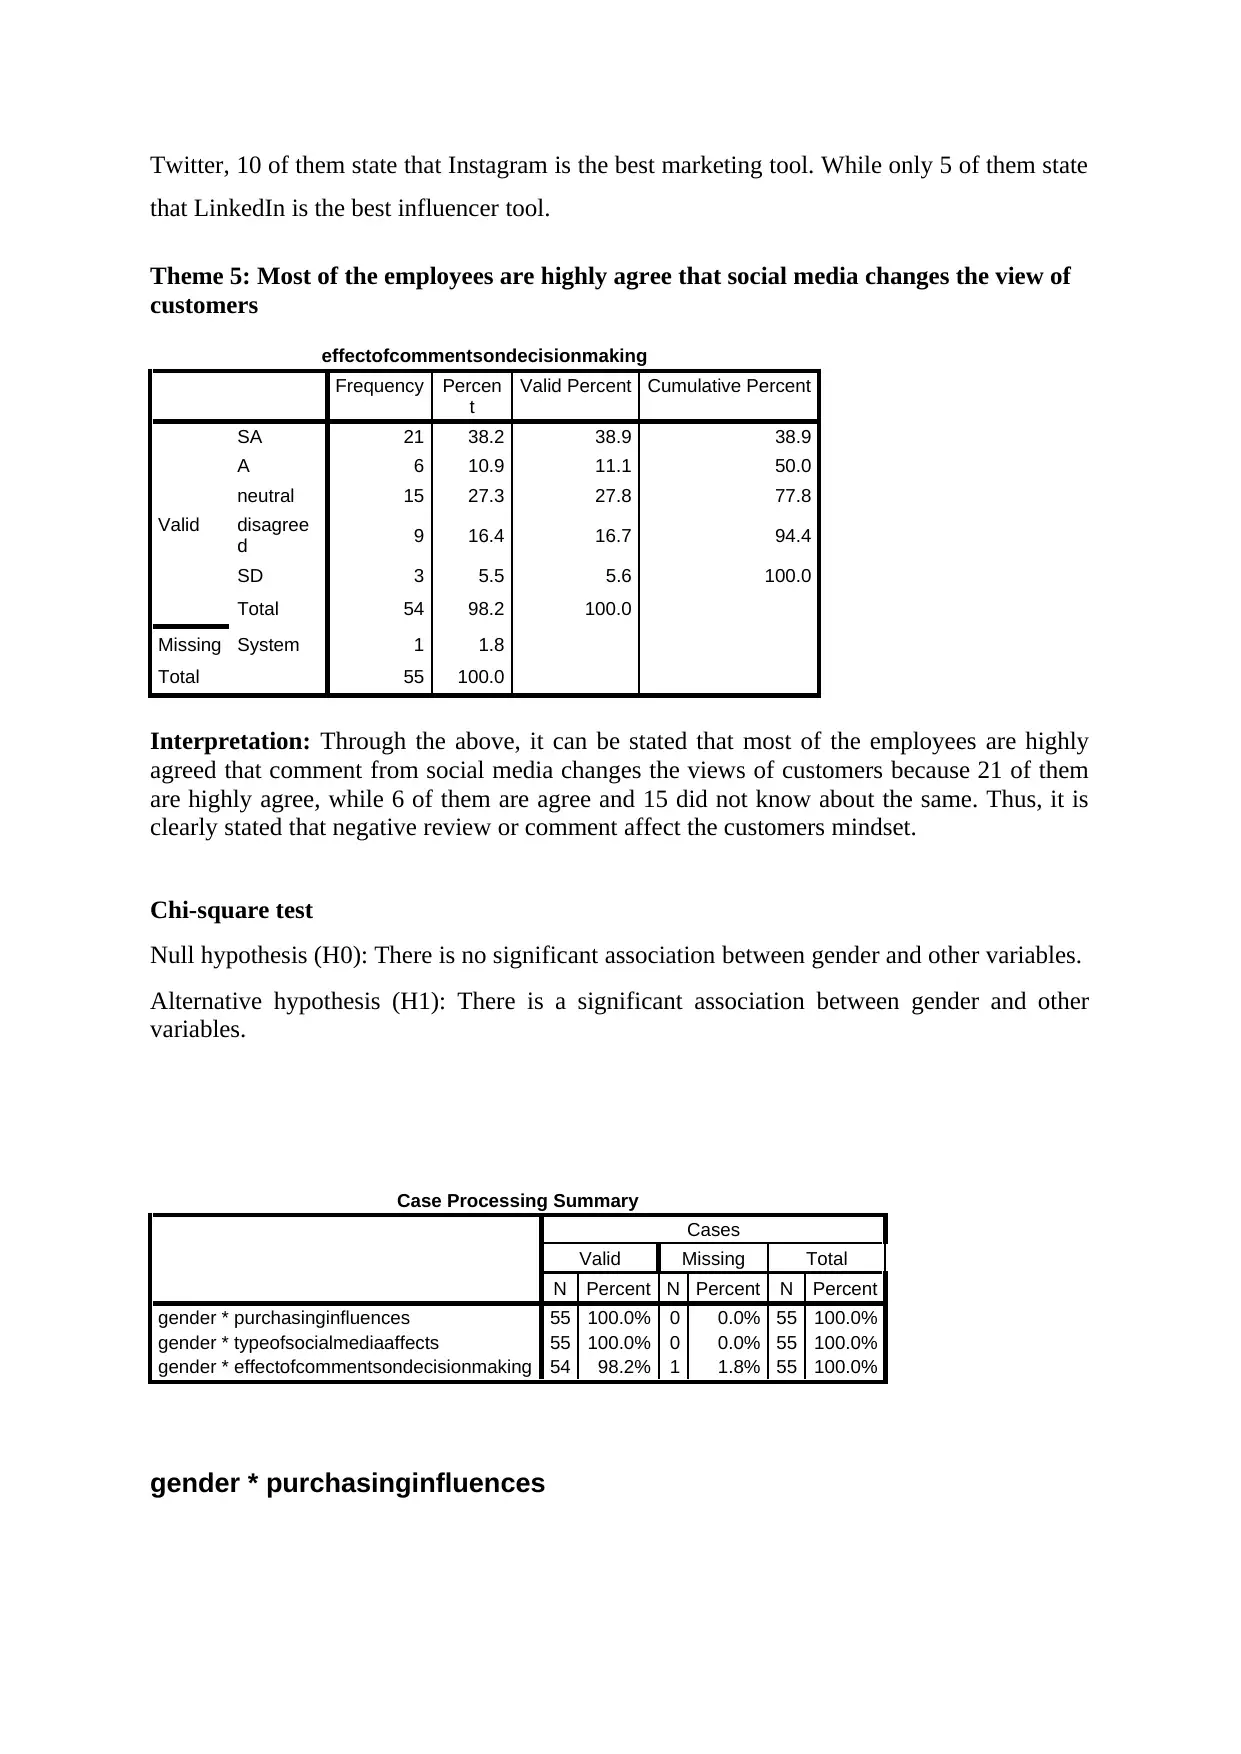
Interpretation: Through the above, it can be stated that most of the employees are highly
agreed that comment from social media changes the views of customers because 21 of them
are highly agree, while 6 of them are agree and 15 did not know about the same. Thus, it is
clearly stated that negative review or comment affect the customers mindset.
Chi-square test
Null hypothesis (H0): There is no significant association between gender and other variables.
Alternative hypothesis (H1): There is a significant association between gender and other
variables.
Case Processing Summary
Cases
Valid Missing Total
N Percent N Percent N Percent
gender * purchasinginfluences 55 100.0% 0 0.0% 55 100.0%
gender * typeofsocialmediaaffects 55 100.0% 0 0.0% 55 100.0%
gender * effectofcommentsondecisionmaking 54 98.2% 1 1.8% 55 100.0%
gender * purchasinginfluences
that LinkedIn is the best influencer tool.
Theme 5: Most of the employees are highly agree that social media changes the view of
customers
effectofcommentsondecisionmaking
Frequency Percen
t
Valid Percent Cumulative Percent
Valid
SA 21 38.2 38.9 38.9
A 6 10.9 11.1 50.0
neutral 15 27.3 27.8 77.8
disagree
d 9 16.4 16.7 94.4
SD 3 5.5 5.6 100.0
Total 54 98.2 100.0
Missing System 1 1.8
Total 55 100.0
Interpretation: Through the above, it can be stated that most of the employees are highly
agreed that comment from social media changes the views of customers because 21 of them
are highly agree, while 6 of them are agree and 15 did not know about the same. Thus, it is
clearly stated that negative review or comment affect the customers mindset.
Chi-square test
Null hypothesis (H0): There is no significant association between gender and other variables.
Alternative hypothesis (H1): There is a significant association between gender and other
variables.
Case Processing Summary
Cases
Valid Missing Total
N Percent N Percent N Percent
gender * purchasinginfluences 55 100.0% 0 0.0% 55 100.0%
gender * typeofsocialmediaaffects 55 100.0% 0 0.0% 55 100.0%
gender * effectofcommentsondecisionmaking 54 98.2% 1 1.8% 55 100.0%
gender * purchasinginfluences
⊘ This is a preview!⊘
Do you want full access?
Subscribe today to unlock all pages.
Trusted by 1+ million students worldwide
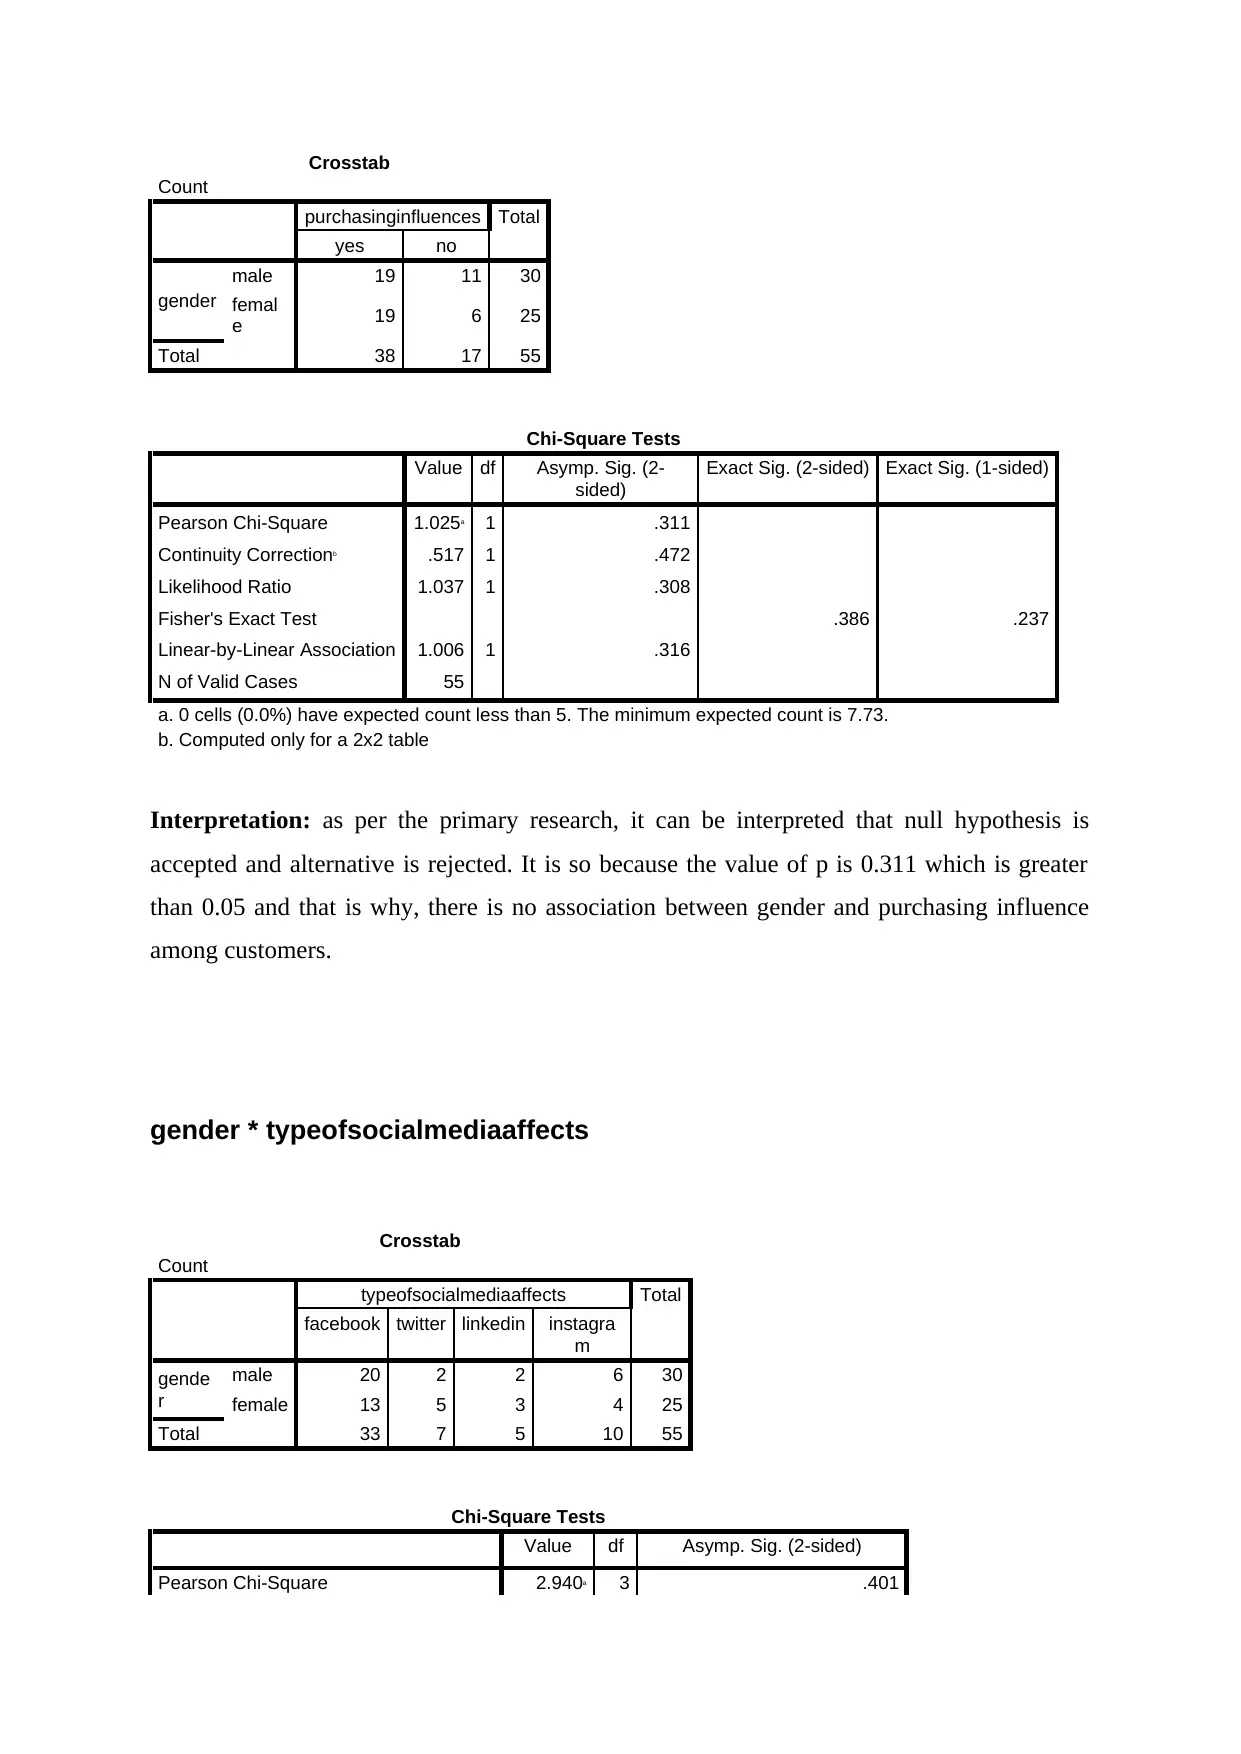
Crosstab
Count
purchasinginfluences Total
yes no
gender
male 19 11 30
femal
e 19 6 25
Total 38 17 55
Chi-Square Tests
Value df Asymp. Sig. (2-
sided)
Exact Sig. (2-sided) Exact Sig. (1-sided)
Pearson Chi-Square 1.025a 1 .311
Continuity Correctionb .517 1 .472
Likelihood Ratio 1.037 1 .308
Fisher's Exact Test .386 .237
Linear-by-Linear Association 1.006 1 .316
N of Valid Cases 55
a. 0 cells (0.0%) have expected count less than 5. The minimum expected count is 7.73.
b. Computed only for a 2x2 table
Interpretation: as per the primary research, it can be interpreted that null hypothesis is
accepted and alternative is rejected. It is so because the value of p is 0.311 which is greater
than 0.05 and that is why, there is no association between gender and purchasing influence
among customers.
gender * typeofsocialmediaaffects
Crosstab
Count
typeofsocialmediaaffects Total
facebook twitter linkedin instagra
m
gende
r
male 20 2 2 6 30
female 13 5 3 4 25
Total 33 7 5 10 55
Chi-Square Tests
Value df Asymp. Sig. (2-sided)
Pearson Chi-Square 2.940a 3 .401
Count
purchasinginfluences Total
yes no
gender
male 19 11 30
femal
e 19 6 25
Total 38 17 55
Chi-Square Tests
Value df Asymp. Sig. (2-
sided)
Exact Sig. (2-sided) Exact Sig. (1-sided)
Pearson Chi-Square 1.025a 1 .311
Continuity Correctionb .517 1 .472
Likelihood Ratio 1.037 1 .308
Fisher's Exact Test .386 .237
Linear-by-Linear Association 1.006 1 .316
N of Valid Cases 55
a. 0 cells (0.0%) have expected count less than 5. The minimum expected count is 7.73.
b. Computed only for a 2x2 table
Interpretation: as per the primary research, it can be interpreted that null hypothesis is
accepted and alternative is rejected. It is so because the value of p is 0.311 which is greater
than 0.05 and that is why, there is no association between gender and purchasing influence
among customers.
gender * typeofsocialmediaaffects
Crosstab
Count
typeofsocialmediaaffects Total
facebook twitter linkedin instagra
m
gende
r
male 20 2 2 6 30
female 13 5 3 4 25
Total 33 7 5 10 55
Chi-Square Tests
Value df Asymp. Sig. (2-sided)
Pearson Chi-Square 2.940a 3 .401
Paraphrase This Document
Need a fresh take? Get an instant paraphrase of this document with our AI Paraphraser
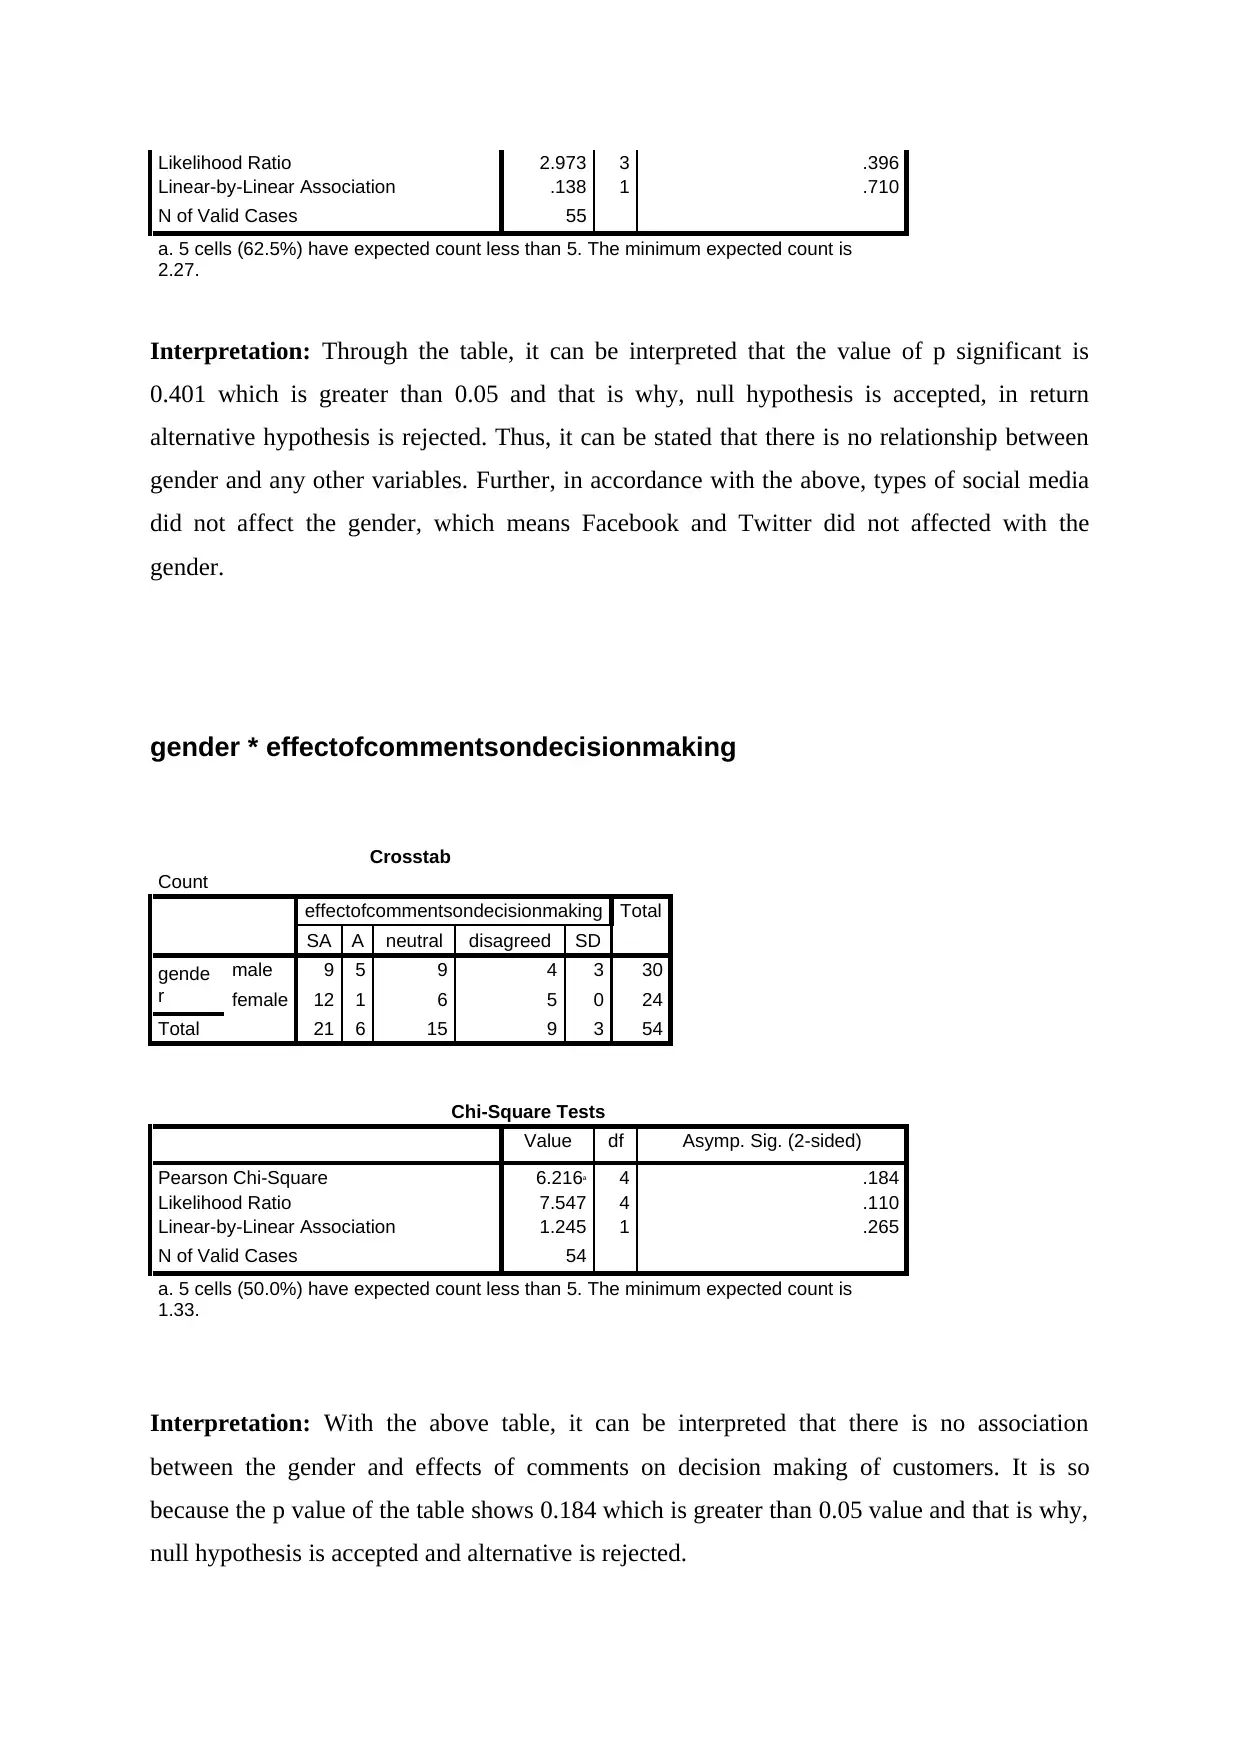
Likelihood Ratio 2.973 3 .396
Linear-by-Linear Association .138 1 .710
N of Valid Cases 55
a. 5 cells (62.5%) have expected count less than 5. The minimum expected count is
2.27.
Interpretation: Through the table, it can be interpreted that the value of p significant is
0.401 which is greater than 0.05 and that is why, null hypothesis is accepted, in return
alternative hypothesis is rejected. Thus, it can be stated that there is no relationship between
gender and any other variables. Further, in accordance with the above, types of social media
did not affect the gender, which means Facebook and Twitter did not affected with the
gender.
gender * effectofcommentsondecisionmaking
Crosstab
Count
effectofcommentsondecisionmaking Total
SA A neutral disagreed SD
gende
r
male 9 5 9 4 3 30
female 12 1 6 5 0 24
Total 21 6 15 9 3 54
Chi-Square Tests
Value df Asymp. Sig. (2-sided)
Pearson Chi-Square 6.216a 4 .184
Likelihood Ratio 7.547 4 .110
Linear-by-Linear Association 1.245 1 .265
N of Valid Cases 54
a. 5 cells (50.0%) have expected count less than 5. The minimum expected count is
1.33.
Interpretation: With the above table, it can be interpreted that there is no association
between the gender and effects of comments on decision making of customers. It is so
because the p value of the table shows 0.184 which is greater than 0.05 value and that is why,
null hypothesis is accepted and alternative is rejected.
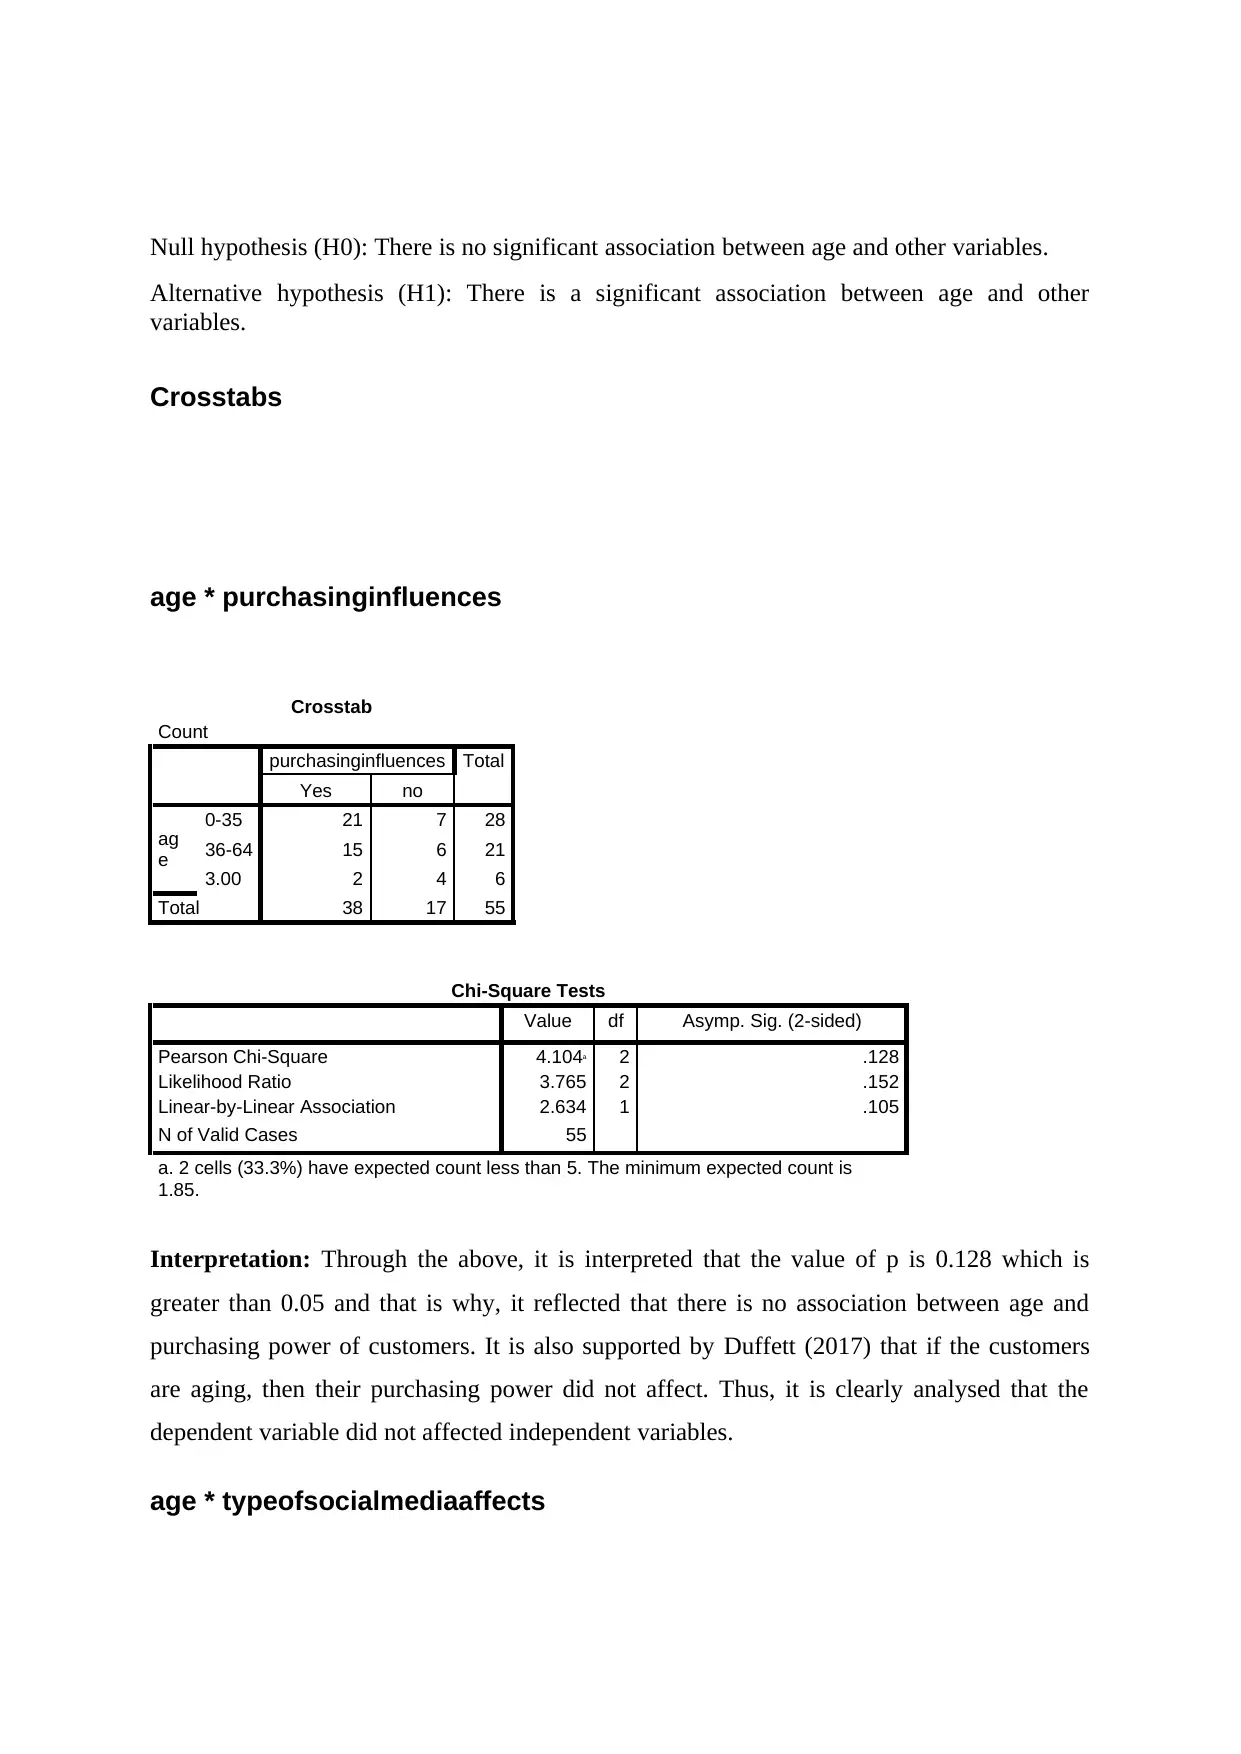
Null hypothesis (H0): There is no significant association between age and other variables.
Alternative hypothesis (H1): There is a significant association between age and other
variables.
Crosstabs
age * purchasinginfluences
Crosstab
Count
purchasinginfluences Total
Yes no
ag
e
0-35 21 7 28
36-64 15 6 21
3.00 2 4 6
Total 38 17 55
Chi-Square Tests
Value df Asymp. Sig. (2-sided)
Pearson Chi-Square 4.104a 2 .128
Likelihood Ratio 3.765 2 .152
Linear-by-Linear Association 2.634 1 .105
N of Valid Cases 55
a. 2 cells (33.3%) have expected count less than 5. The minimum expected count is
1.85.
Interpretation: Through the above, it is interpreted that the value of p is 0.128 which is
greater than 0.05 and that is why, it reflected that there is no association between age and
purchasing power of customers. It is also supported by Duffett (2017) that if the customers
are aging, then their purchasing power did not affect. Thus, it is clearly analysed that the
dependent variable did not affected independent variables.
age * typeofsocialmediaaffects
⊘ This is a preview!⊘
Do you want full access?
Subscribe today to unlock all pages.
Trusted by 1+ million students worldwide
Crosstab
Count
Typeofsocialmediaaffects Total
facebook twitter linkedin instagram
age
0-35 18 4 2 4 28
36-64 11 2 3 5 21
3.00 4 1 0 1 6
Total 33 7 5 10 55
Chi-Square Tests
Value df Asymp. Sig. (2-sided)
Pearson Chi-Square 2.522a 6 .866
Likelihood Ratio 2.983 6 .811
Linear-by-Linear Association .219 1 .640
N of Valid Cases 55
a. 9 cells (75.0%) have expected count less than 5. The minimum expected count
is .55.
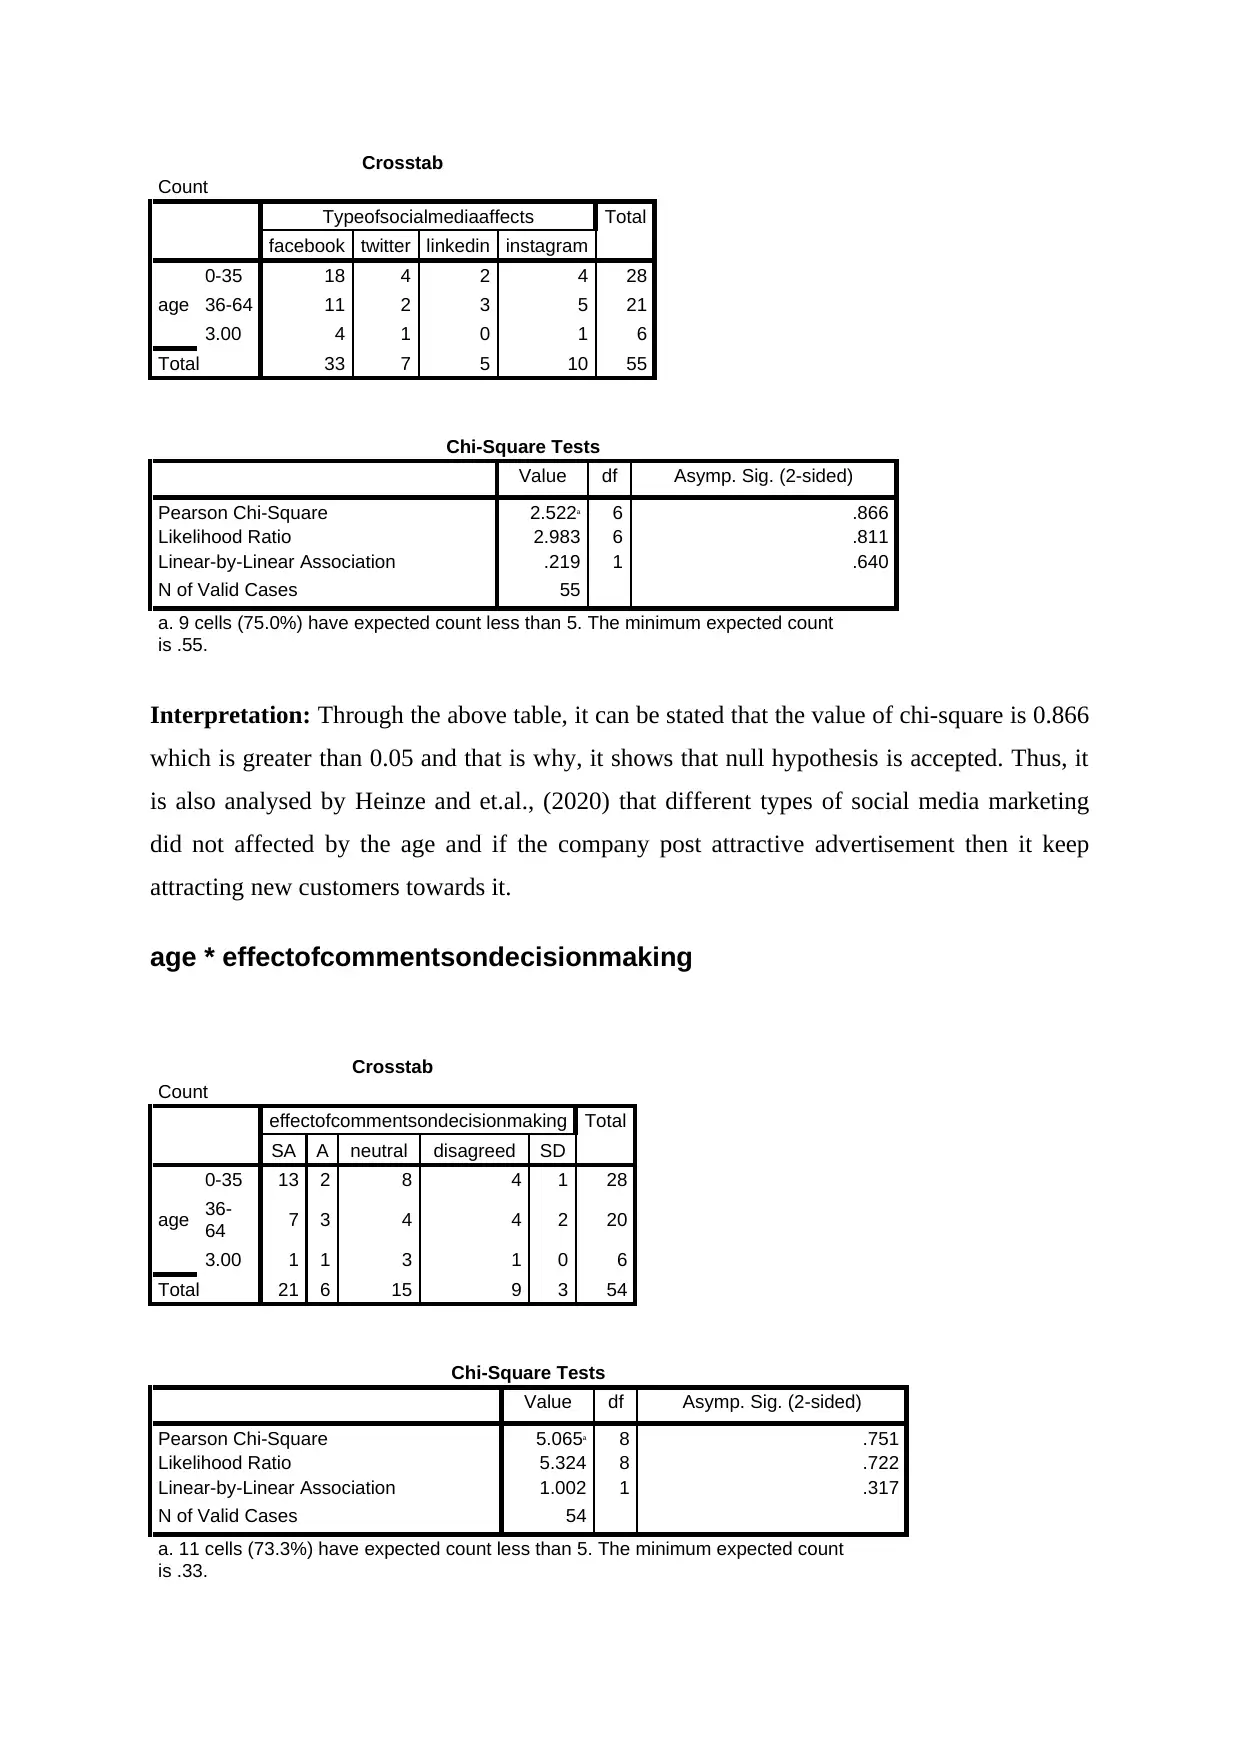
Interpretation: Through the above table, it can be stated that the value of chi-square is 0.866
which is greater than 0.05 and that is why, it shows that null hypothesis is accepted. Thus, it
is also analysed by Heinze and et.al., (2020) that different types of social media marketing
did not affected by the age and if the company post attractive advertisement then it keep
attracting new customers towards it.
age * effectofcommentsondecisionmaking
Crosstab
Count
effectofcommentsondecisionmaking Total
SA A neutral disagreed SD
age
0-35 13 2 8 4 1 28
36-
64 7 3 4 4 2 20
3.00 1 1 3 1 0 6
Total 21 6 15 9 3 54
Chi-Square Tests
Value df Asymp. Sig. (2-sided)
Pearson Chi-Square 5.065a 8 .751
Likelihood Ratio 5.324 8 .722
Linear-by-Linear Association 1.002 1 .317
N of Valid Cases 54
a. 11 cells (73.3%) have expected count less than 5. The minimum expected count
is .33.
Count
Typeofsocialmediaaffects Total
facebook twitter linkedin instagram
age
0-35 18 4 2 4 28
36-64 11 2 3 5 21
3.00 4 1 0 1 6
Total 33 7 5 10 55
Chi-Square Tests
Value df Asymp. Sig. (2-sided)
Pearson Chi-Square 2.522a 6 .866
Likelihood Ratio 2.983 6 .811
Linear-by-Linear Association .219 1 .640
N of Valid Cases 55
a. 9 cells (75.0%) have expected count less than 5. The minimum expected count
is .55.
Interpretation: Through the above table, it can be stated that the value of chi-square is 0.866
which is greater than 0.05 and that is why, it shows that null hypothesis is accepted. Thus, it
is also analysed by Heinze and et.al., (2020) that different types of social media marketing
did not affected by the age and if the company post attractive advertisement then it keep
attracting new customers towards it.
age * effectofcommentsondecisionmaking
Crosstab
Count
effectofcommentsondecisionmaking Total
SA A neutral disagreed SD
age
0-35 13 2 8 4 1 28
36-
64 7 3 4 4 2 20
3.00 1 1 3 1 0 6
Total 21 6 15 9 3 54
Chi-Square Tests
Value df Asymp. Sig. (2-sided)
Pearson Chi-Square 5.065a 8 .751
Likelihood Ratio 5.324 8 .722
Linear-by-Linear Association 1.002 1 .317
N of Valid Cases 54
a. 11 cells (73.3%) have expected count less than 5. The minimum expected count
is .33.
Paraphrase This Document
Need a fresh take? Get an instant paraphrase of this document with our AI Paraphraser
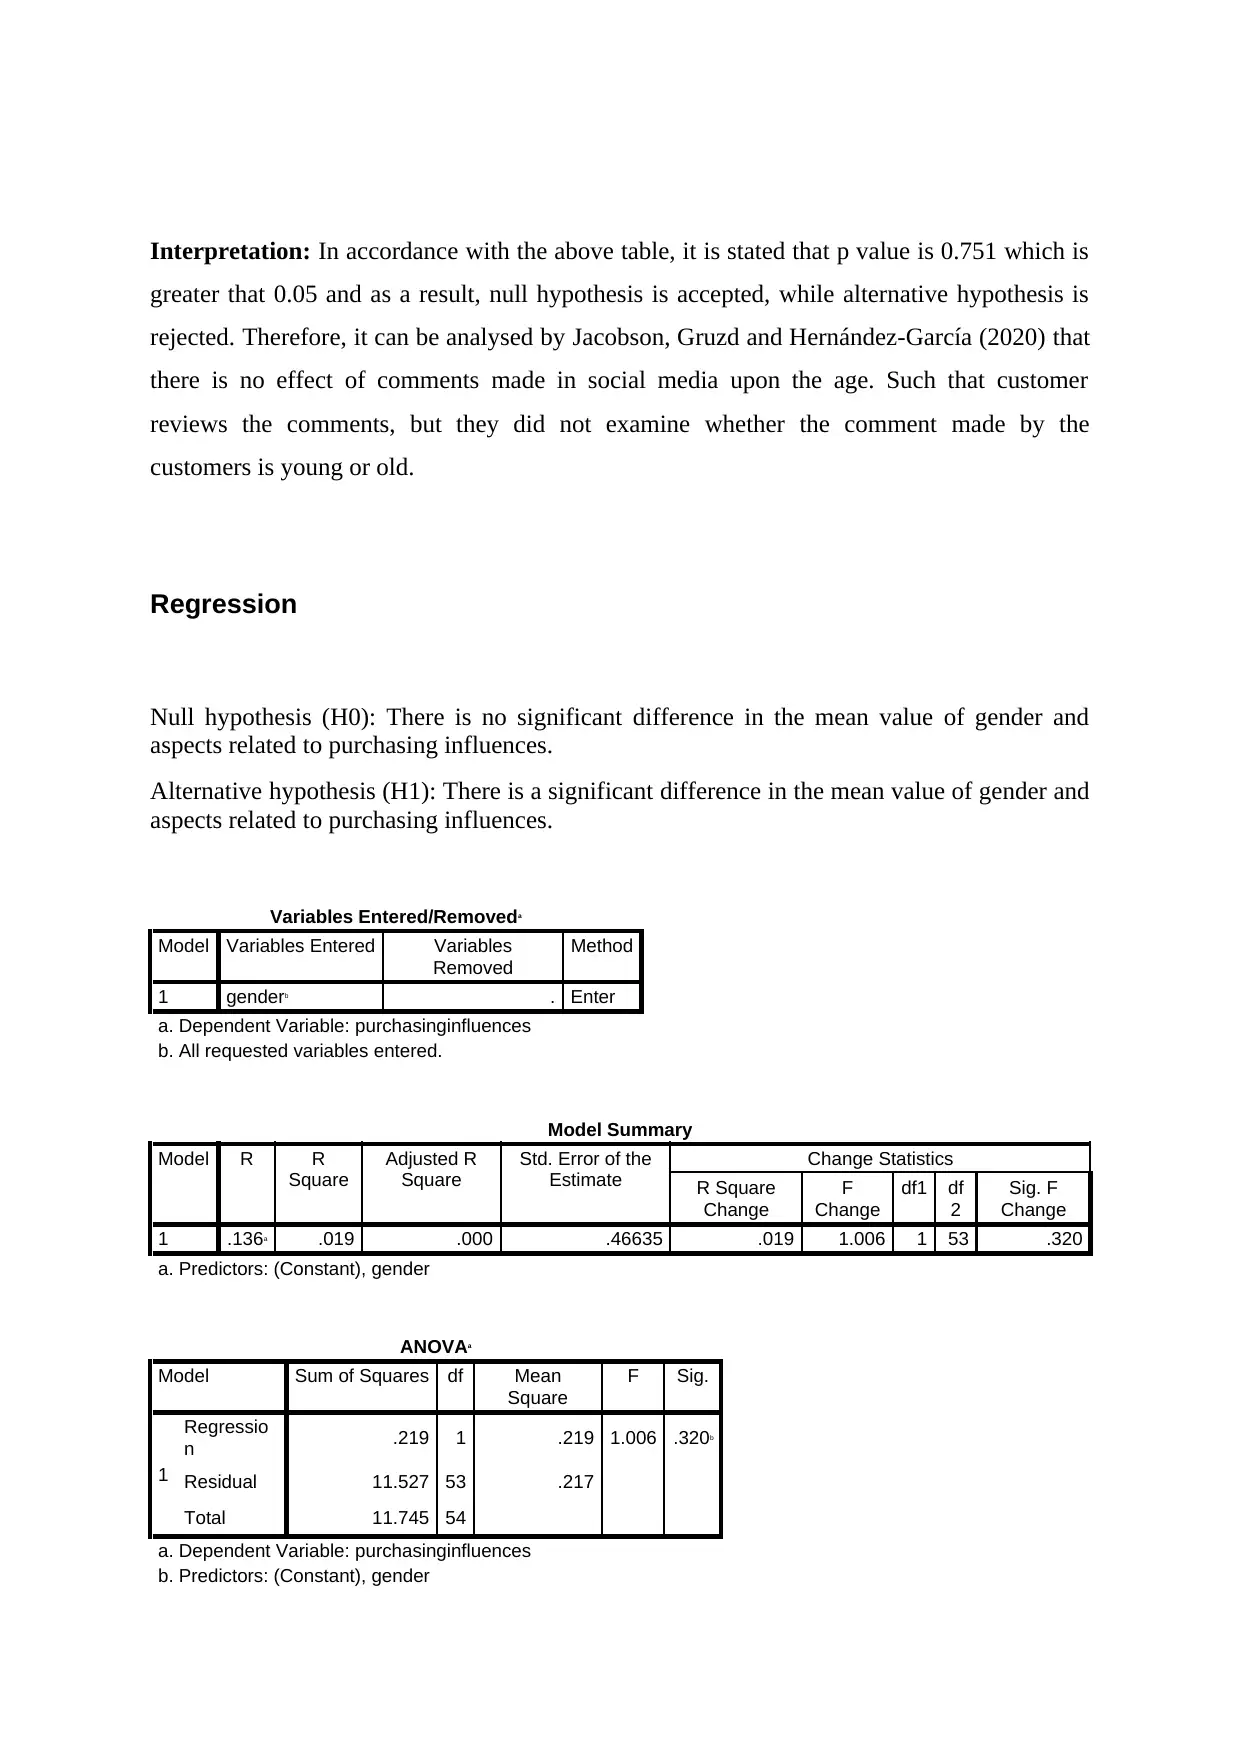
Interpretation: In accordance with the above table, it is stated that p value is 0.751 which is
greater that 0.05 and as a result, null hypothesis is accepted, while alternative hypothesis is
rejected. Therefore, it can be analysed by Jacobson, Gruzd and Hernández-García (2020) that
there is no effect of comments made in social media upon the age. Such that customer
reviews the comments, but they did not examine whether the comment made by the
customers is young or old.
Regression
Null hypothesis (H0): There is no significant difference in the mean value of gender and
aspects related to purchasing influences.
Alternative hypothesis (H1): There is a significant difference in the mean value of gender and
aspects related to purchasing influences.
Variables Entered/Removeda
Model Variables Entered Variables
Removed
Method
1 genderb . Enter
a. Dependent Variable: purchasinginfluences
b. All requested variables entered.
Model Summary
Model R R
Square
Adjusted R
Square
Std. Error of the
Estimate
Change Statistics
R Square
Change
F
Change
df1 df
2
Sig. F
Change
1 .136a .019 .000 .46635 .019 1.006 1 53 .320
a. Predictors: (Constant), gender
ANOVAa
Model Sum of Squares df Mean
Square
F Sig.
1
Regressio
n .219 1 .219 1.006 .320b
Residual 11.527 53 .217
Total 11.745 54
a. Dependent Variable: purchasinginfluences
b. Predictors: (Constant), gender
Coefficientsa
Model Unstandardized Coefficients Standardized Coefficients t Sig.
B Std. Error Beta
1 (Constant) 1.493 .194 7.691 .000
gender -.127 .126 -.136 -1.003 .320
a. Dependent Variable: purchasinginfluences
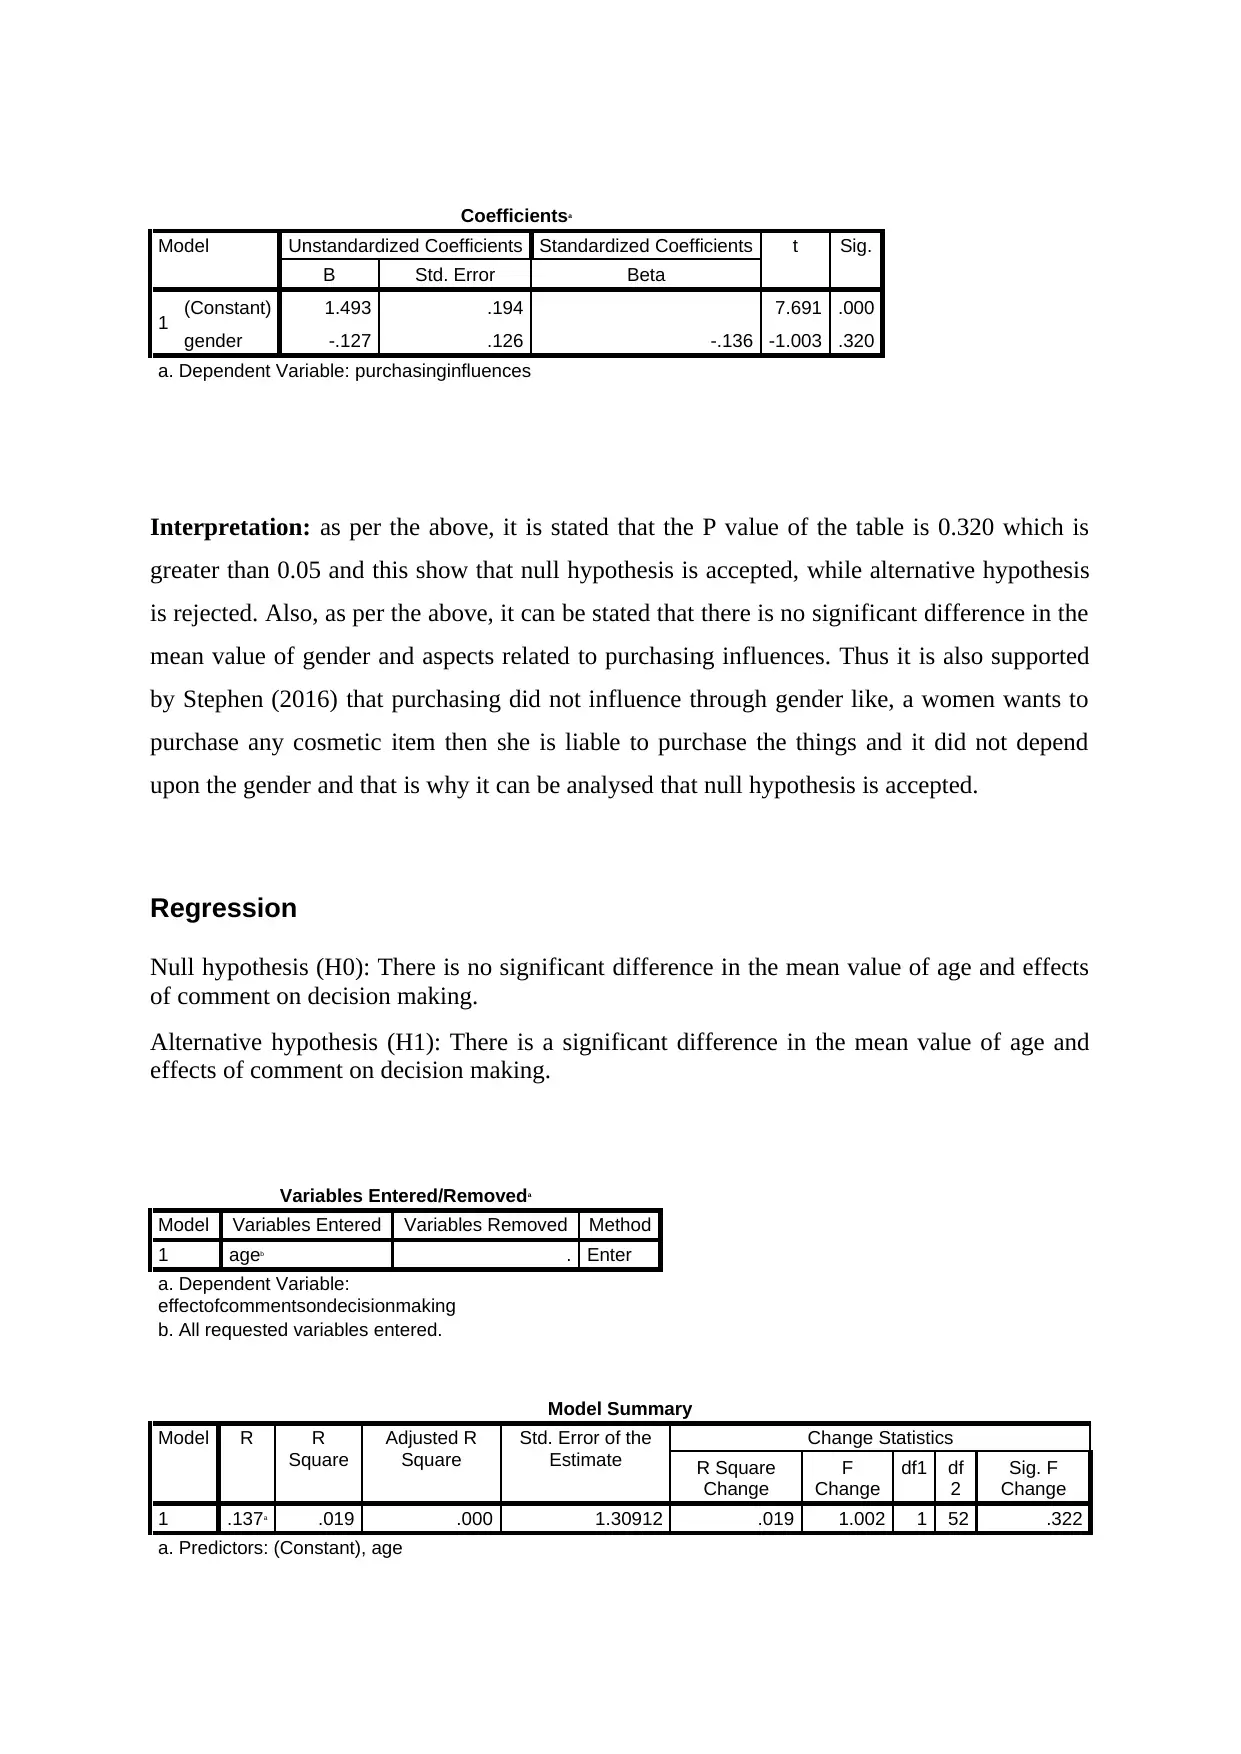
Interpretation: as per the above, it is stated that the P value of the table is 0.320 which is
greater than 0.05 and this show that null hypothesis is accepted, while alternative hypothesis
is rejected. Also, as per the above, it can be stated that there is no significant difference in the
mean value of gender and aspects related to purchasing influences. Thus it is also supported
by Stephen (2016) that purchasing did not influence through gender like, a women wants to
purchase any cosmetic item then she is liable to purchase the things and it did not depend
upon the gender and that is why it can be analysed that null hypothesis is accepted.
Regression
Null hypothesis (H0): There is no significant difference in the mean value of age and effects
of comment on decision making.
Alternative hypothesis (H1): There is a significant difference in the mean value of age and
effects of comment on decision making.
Variables Entered/Removeda
Model Variables Entered Variables Removed Method
1 ageb . Enter
a. Dependent Variable:
effectofcommentsondecisionmaking
b. All requested variables entered.
Model Summary
Model R R
Square
Adjusted R
Square
Std. Error of the
Estimate
Change Statistics
R Square
Change
F
Change
df1 df
2
Sig. F
Change
1 .137a .019 .000 1.30912 .019 1.002 1 52 .322
a. Predictors: (Constant), age
Model Unstandardized Coefficients Standardized Coefficients t Sig.
B Std. Error Beta
1 (Constant) 1.493 .194 7.691 .000
gender -.127 .126 -.136 -1.003 .320
a. Dependent Variable: purchasinginfluences
Interpretation: as per the above, it is stated that the P value of the table is 0.320 which is
greater than 0.05 and this show that null hypothesis is accepted, while alternative hypothesis
is rejected. Also, as per the above, it can be stated that there is no significant difference in the
mean value of gender and aspects related to purchasing influences. Thus it is also supported
by Stephen (2016) that purchasing did not influence through gender like, a women wants to
purchase any cosmetic item then she is liable to purchase the things and it did not depend
upon the gender and that is why it can be analysed that null hypothesis is accepted.
Regression
Null hypothesis (H0): There is no significant difference in the mean value of age and effects
of comment on decision making.
Alternative hypothesis (H1): There is a significant difference in the mean value of age and
effects of comment on decision making.
Variables Entered/Removeda
Model Variables Entered Variables Removed Method
1 ageb . Enter
a. Dependent Variable:
effectofcommentsondecisionmaking
b. All requested variables entered.
Model Summary
Model R R
Square
Adjusted R
Square
Std. Error of the
Estimate
Change Statistics
R Square
Change
F
Change
df1 df
2
Sig. F
Change
1 .137a .019 .000 1.30912 .019 1.002 1 52 .322
a. Predictors: (Constant), age
⊘ This is a preview!⊘
Do you want full access?
Subscribe today to unlock all pages.
Trusted by 1+ million students worldwide
1 out of 15
Related Documents


Your All-in-One AI-Powered Toolkit for Academic Success.
+13062052269
info@desklib.com
Available 24*7 on WhatsApp / Email
![[object Object]](/_next/static/media/star-bottom.7253800d.svg)
Unlock your academic potential
Copyright © 2020–2026 A2Z Services. All Rights Reserved. Developed and managed by ZUCOL.