SPSS Data Analysis Report: Social Media's Influence on Sleep Quality

Verified

Added on  2022/12/15

|28
|3462
|497
Report
AI Summary
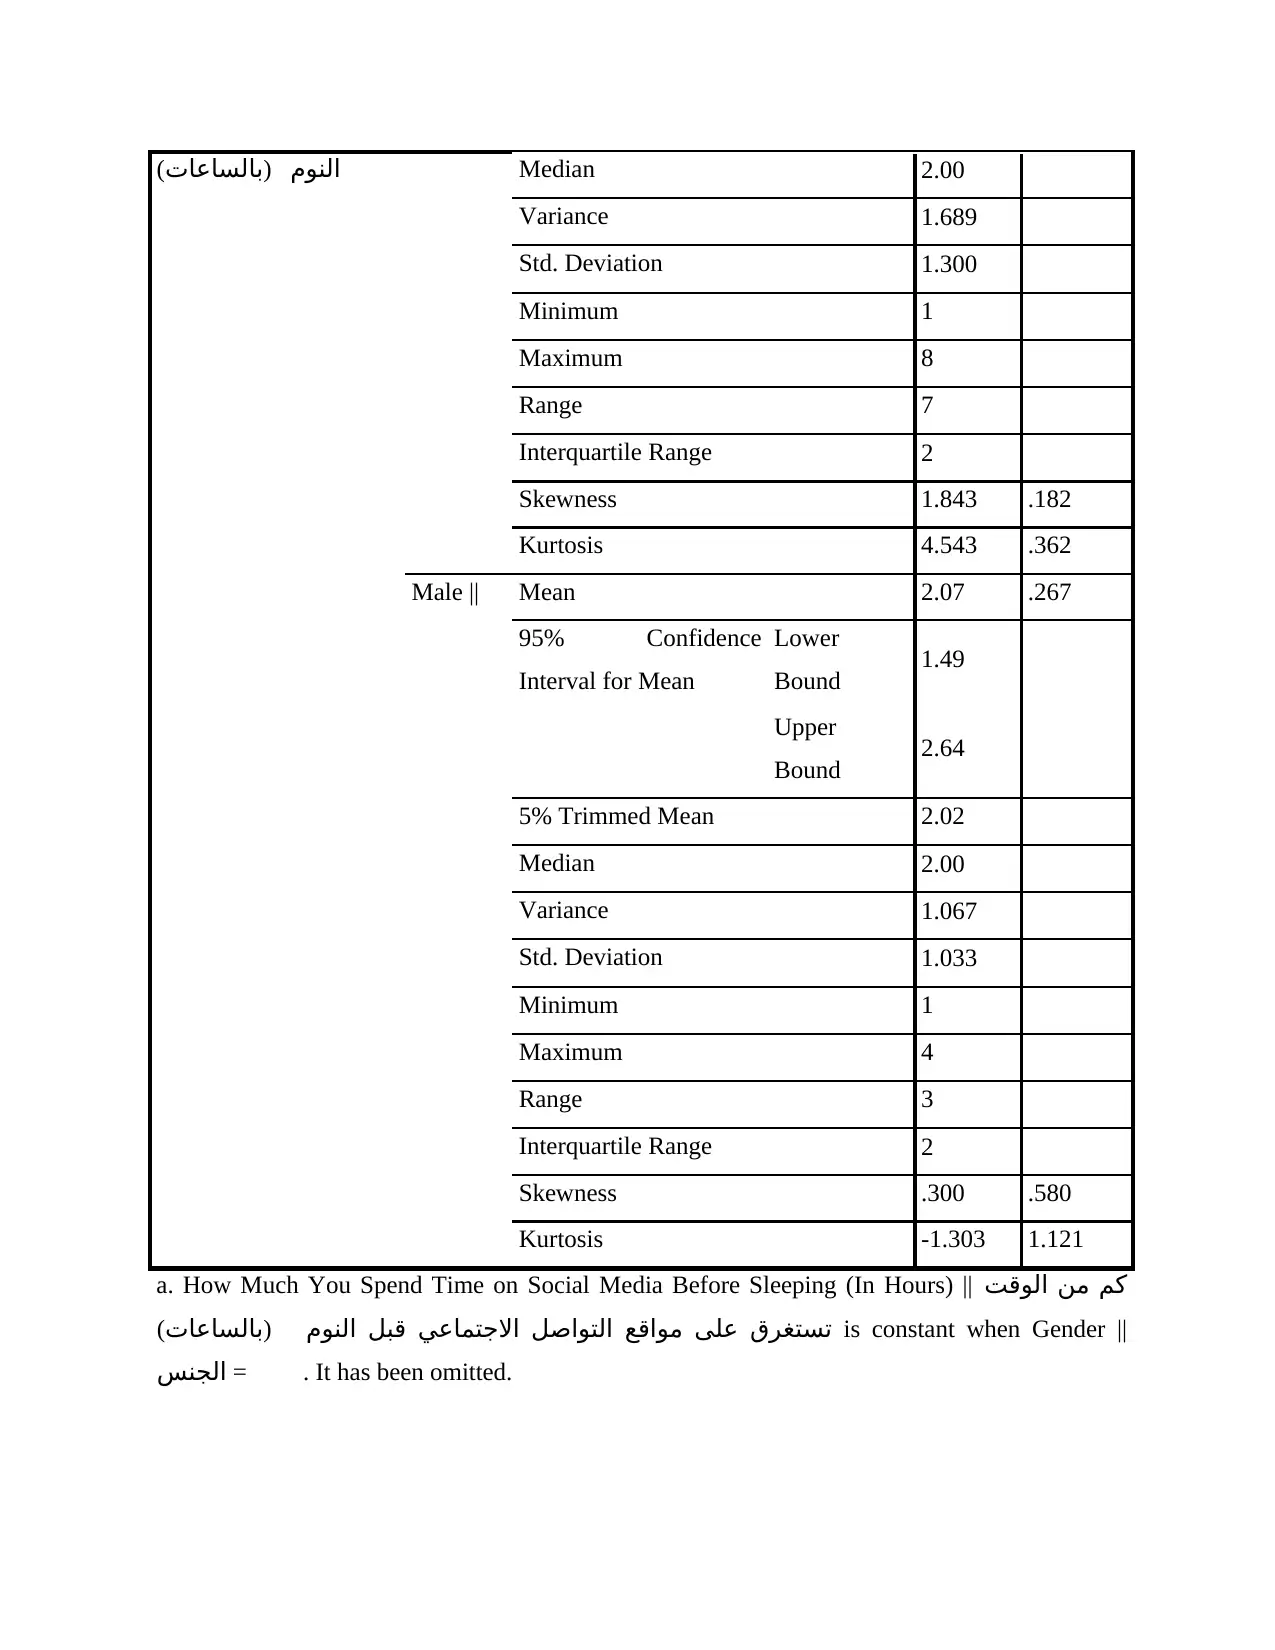
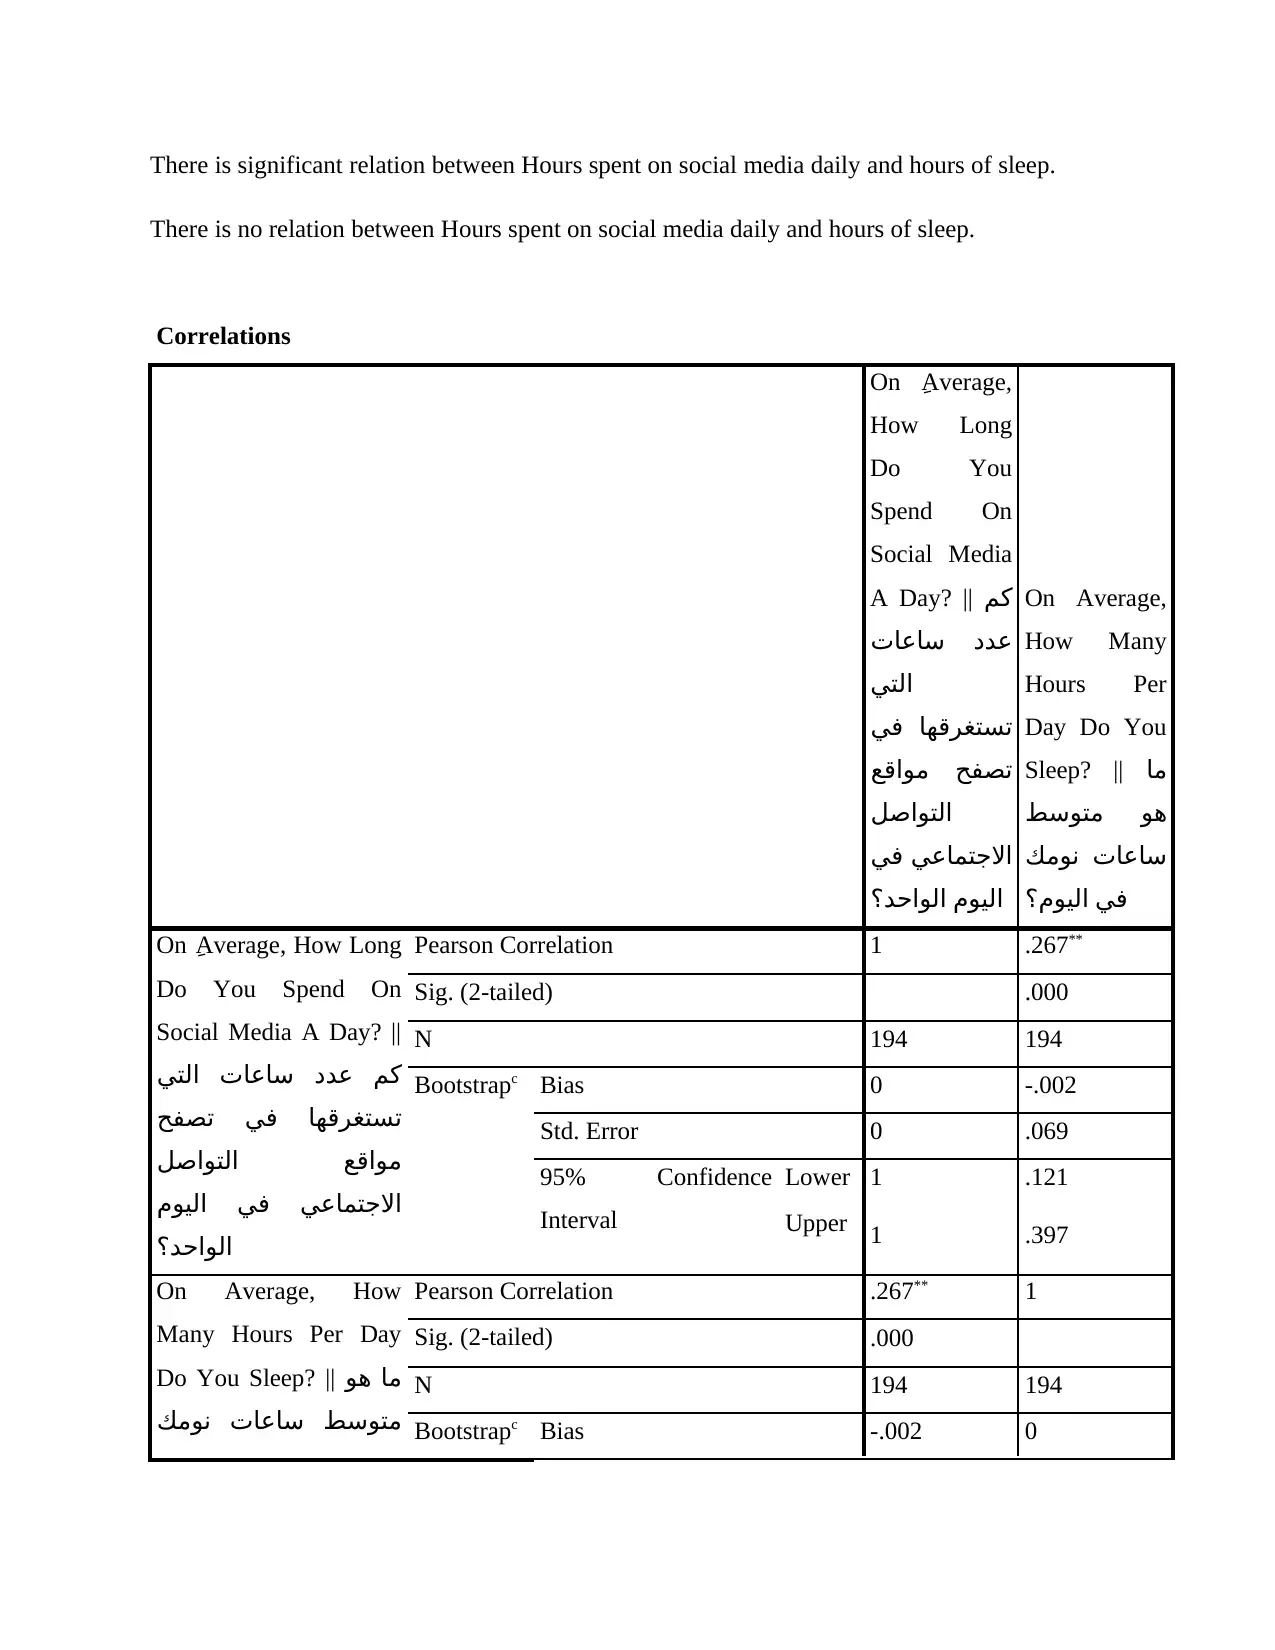
This report investigates the impact of social media usage on sleep patterns among adults. A survey was conducted, and the data was analyzed using SPSS to determine the relationship between social media habits and sleep quality. The analysis explores variables such as gender, age, daily social media usage, and their correlation with sleeping hours and perceived effects on daily life achievements. Key findings indicate varying degrees of influence depending on the social media platform used and demographic factors. The report includes statistical tests like Chi-square and correlation analysis to validate the hypotheses related to these relationships. The overall aim is to provide insights into how social media affects sleep and contribute to a better understanding of its potential negative impacts.
Document Page
SPSS data analysis as per example
tabler-icon-diamond-filled.svg

Paraphrase This Document

Need a fresh take? Get an instant paraphrase of this document with our AI Paraphraser
Document Page
Contents
Relations analysis........................................................................................................................................3
Variable analysis:......................................................................................................................................29
Document Page
Relations analysis
Gender VS Sleep disturbance
Hypothesis:
H0: Males are getting highly affected in sleeping.
H1: Males are not getting highly affected in sleeping.
Case Processing Summary
Gender ||
الجنس
Cases
Valid Missing Total
N Percent N Percent N Percent
How Much You Spend
Time on Social Media
Before Sleeping (In
Hours) || كم من الوقت
مواقع على تستغرق
التواصل االجتماعي قبل
(
)بالساعات النوم
1 100.0% 0 0.0% 1 100.0%
Female | 178 98.3% 3 1.7% 181 100.0%
Male ||
15 100.0% 0 0.0% 15 100.0%
Descriptivesa
Gender || الجنس Statistic Std. Error
How Much You Spend
Time on Social Media
Before Sleeping (In
Hours) || كم من الوقت
مواقع على تستغرق
التواصل االجتماعي قبل
Female | Mean 2.02 .097
95% Confidence
Interval for Mean
Lower
Bound 1.82
Upper
Bound 2.21
5% Trimmed Mean 1.86
Document Page
( )بالساعات النوم Median 2.00
Variance 1.689
Std. Deviation 1.300
Minimum 1
Maximum 8
Range 7
Interquartile Range 2
Skewness 1.843 .182
Kurtosis 4.543 .362
Male || Mean 2.07 .267
95% Confidence
Interval for Mean
Lower
Bound 1.49
Upper
Bound 2.64
5% Trimmed Mean 2.02
Median 2.00
Variance 1.067
Std. Deviation 1.033
Minimum 1
Maximum 4
Range 3
Interquartile Range 2
Skewness .300 .580
Kurtosis -1.303 1.121
a. How Much You Spend Time on Social Media Before Sleeping (In Hours) || كم من الوقت
(
)بالساعات تستغرق على مواقع التواصل االجتماعي قبل النوم is constant when Gender ||
الجنس = . It has been omitted.
tabler-icon-diamond-filled.svg

Paraphrase This Document

Need a fresh take? Get an instant paraphrase of this document with our AI Paraphraser
Document Page
Analysis: In accordance of above done Chi-square test this can be stated that females are using
their social accounts with higher rate which is leading to disturbance in their sleeping hours.
While males are not getting affected from social media usage.
Age VS hours spent on social media before sleeping-
Hypothesis:
H0: There is relation between age of people and hours spent on social media before sleeping.
H1: There is no relation between age of people and hours spent on social media before sleeping.
Between-Subjects Factors
N
Do you browse your 2
Document Page
social media before
going to sleep? || هل
\مواقع بتصفح تقوم ين
التواصل االجتماعي قبل
النوم؟
No || ال 4
Sometimes ||
أحيانا 47
Yes || نعم 144
Tests of Between-Subjects Effects
Dependent Variable: s
Source
Type III
Sum of
Squares df Mean Square F Sig.
Corrected Model 443.003
a 3 147.668 4.171 .007
Intercept 11363.2
04 1 11363.204 320.935 .000
Doyoubrowseyoursocialmedi
abeforegoingtosleep
هلتقومينبت
443.003 3 147.668 4.171 .007
Error 6833.46
4 193 35.407
Total 92440.0
00 197
Corrected Total 7276.46
7 196
a. R Squared = .061 (Adjusted R Squared = .046)
Chi square test-
Document Page
Case Processing Summary
Cases
Valid Missing Total
N Percent N Percent N Percent
Age * On ِ Average,
How Long Do You
Spend On Social Media
A Day? || عدد كم
تستغرقها التي ساعات
مواقع تصفح في
التواصل االجتماعي في
اليوم الواحد؟
194 100.0% 0 0.0% 194 100.0%
Age * On ِ Average, How Long Do You Spend On Social Media A Day?
Crosstabulation
Count
On ِ Average, How Long Do You Spend On Social Media A Day? || كم عدد
ساعات التي تستغرقها في تصفح مواقع التواصل االجتماعي في اليوم
الواحد؟
Total1 2 3 4 5 6 7 8 9 10
Age 14.0 0 0 0 0 0 0 0 0 0 1 1
17.0 0 0 0 1 0 1 0 0 0 0 2
18.0 0 0 6 11 8 6 7 2 2 13 55
19.0 1 3 9 18 11 11 12 10 2 4 81
20.0 0 2 2 2 1 6 1 8 0 4 26
21.0 1 0 1 0 2 0 0 0 1 0 5
22.0 0 1 0 0 1 0 0 0 0 0 2
23.0 0 0 1 0 0 0 0 0 0 1 2
tabler-icon-diamond-filled.svg

Paraphrase This Document

Need a fresh take? Get an instant paraphrase of this document with our AI Paraphraser
Document Page
25.0 0 0 0 1 0 0 0 0 0 0 1
27.0 0 0 0 0 1 0 0 0 0 2 3
29.0 0 0 1 0 0 0 0 0 0 0 1
30.0 0 0 1 0 0 0 1 0 0 0 2
31.0 0 0 1 0 0 0 1 0 0 0 2
32.0 0 0 0 1 0 0 1 0 0 0 2
34.0 0 0 0 1 0 1 0 0 0 0 2
38.0 0 0 2 0 0 0 0 0 0 1 3
39.0 0 0 1 0 0 0 0 0 0 0 1
40.0 0 0 1 0 0 0 0 0 0 0 1
42.0 0 0 0 0 1 0 0 0 0 0 1
55.0 0 0 1 0 0 0 0 0 0 0 1
Total 2 6 27 35 25 25 23 20 5 26 194
Chi-Square Tests
Value df
Asymp. Sig.
(2-sided)
Pearson Chi-Square 177.630a 171 .348
Likelihood Ratio 136.783 171 .975
Linear-by-Linear
Association 4.693 1 .030
N of Valid Cases 194
a. 186 cells (93.0%) have expected count less than 5. The
minimum expected count is .01.
Symmetric Measures
Document Page
Value
Asymp. Std.
Errora
Approx.
Tb
Approx.
Sig.
Nominal by
Nominal
Phi .957 .348
Cramer's V .319 .348
Contingency
Coefficient .691 .348
Interval by Interval Pearson's R -.156 .066 -2.187 .030c
Ordinal by Ordinal Spearman Correlation -.129 .075 -1.804 .073c
N of Valid Cases 194
a. Not assuming the null hypothesis.
b. Using the asymptotic standard error assuming the null hypothesis.
c. Based on normal approximation.
Bootstrap for Symmetric Measures
Value
Bootstrapa
Bias Std. Error
95% Confidence
Interval
Lower Upper
Nominal by
Nominal
Phi .957 .158 .107 .930 1.340
Cramer's V .319 .056 .035 .312 .450
Contingency
Coefficient .691 .051 .032 .681 .801
Interval by Interval Pearson's R -.156 .005 .070 -.278 -.005
Ordinal by Ordinal Spearman Correlation -.129 .004 .078 -.272 .030
N of Valid Cases 194 0 0 194 194
a. Unless otherwise noted, bootstrap results are based on 1000 bootstrap samples
Document Page
Analysis: In accordance of above done test, this can be stated that there is no relation between
ages of people and hours spent on social media before sleeping. This has been justified by above
done test of significance difference under which value is more than 0.05. hence, alternative
hypothesis is true.
Hours spent on social media daily VS hours of sleep
Hypothesis:
tabler-icon-diamond-filled.svg

Paraphrase This Document

Need a fresh take? Get an instant paraphrase of this document with our AI Paraphraser
Document Page
There is significant relation between Hours spent on social media daily and hours of sleep.
There is no relation between Hours spent on social media daily and hours of sleep.
Correlations
On ِ Average,
How Long
Do You
Spend On
Social Media
A Day? || كم
ساعات عدد
التي
في تستغرقها
مواقع تصفح
التواصل
االجتماعي في
اليوم الواحد؟
On Average,
How Many
Hours Per
Day Do You
Sleep? || ما
متوسط هو
ساعات نومك
في اليوم؟
On ِ Average, How Long
Do You Spend On
Social Media A Day? ||
التي ساعات عدد كم
تصفح في تستغرقها
التواصل مواقع
اليوم في االجتماعي
الواحد؟
Pearson Correlation 1 .267**
Sig. (2-tailed) .000
N 194 194
Bootstrapc Bias 0 -.002
Std. Error 0 .069
95% Confidence
Interval
Lower 1 .121
Upper 1 .397
On Average, How
Many Hours Per Day
Do You Sleep? || ما هو
نومك ساعات متوسط
Pearson Correlation .267** 1
Sig. (2-tailed) .000
N 194 194
Bootstrapc Bias -.002 0
Document Page
في اليوم؟ Std. Error .069 0
95% Confidence
Interval
Lower .121 1
Upper .397 1
**. Correlation is significant at the 0.01 level (2-tailed).
c. Unless otherwise noted, bootstrap results are based on 1000 bootstrap samples
Analysis: In accordance of above produced chart this can be stated that there is no relation
between Hours spent on social media daily and hours of sleep. This is so because computed
value of Pearson correlation is lower than 0.3 as it is of 0.267. This shows that there is no
significant relation between these two variables.
chevron_up_icon
1 out of 28
circle_padding
hide_on_mobile
zoom_out_icon
[object Object]