University Data Analysis: Business Modeling and Statistics Report
VerifiedAdded on 2020/05/08
|29
|2946
|218
Report
AI Summary
This report presents an analysis of the Social Progress Index using data from 70 countries. The analysis covers various aspects, including child mortality rates, household air pollution, adult literacy rates, life expectancy, freedom of expression, and tolerance for immigrants. Descriptive statistics were computed to understand the distribution of variables, and confidence intervals were constructed for child mortality and tolerance for immigrants. Hypothesis testing was conducted to compare adult literacy rates between European and African countries, freedom of expression between Asian and American countries, and life expectancy at 60 between American and European countries. Furthermore, correlation and regression analyses were performed to examine the relationships between life expectancy and household air pollution, as well as adult literacy and freedom of expression. The study found decreasing child mortality and air pollution deaths, and increasing literacy and freedom of expression. Significant differences were identified in literacy rates between Europe and Africa, and freedom of expression between Asia and America. The report concludes with a summary of findings and limitations of the study.
Running head: BUSINESS MODELING AND STATISTICS
Business Modelling and Statistics
Name of the student
Name of the university
Author’s note
Business Modelling and Statistics
Name of the student
Name of the university
Author’s note
Paraphrase This Document
Need a fresh take? Get an instant paraphrase of this document with our AI Paraphraser
1BUSINESS MODELING AND STATISTICS
Executive Statistics
In the present we analysed the data of Social Progress Index. The data of 70 countries was
analysed. From the analysis it is found that Child Mortality rate is decreasing. In addition death
due to Household air pollution is also decreasing. There is an increase in the Adult Literacy rates.
For most of the countries the Life Expectancy at 60 is constant. There is also an increase in the
Freedom of Expression. There is significant difference in Average Adult Literacy Rate for
European and African Countries. There is significant difference in Freedom of Expression for
Asian and American Countries. However there is no significant difference in Life Expectancy at
60 for American and European Countries. There is a high amount of correlation between Life
expectancy at 60 and Household air pollution and attributable deaths. There is a poor relation
between Freedom of Expression and Adult Literacy Rate.
2BUSINESS MODELING AND STATISTICS
Table of Contents
Introduction......................................................................................................................................4
Analysis...........................................................................................................................................4
Descriptive Statistics....................................................................................................................4
Continent..................................................................................................................................4
Child mortality rate..................................................................................................................4
Household air pollution attributable deaths..............................................................................4
Adult literacy rate.....................................................................................................................5
Life expectancy at 60...............................................................................................................5
Freedom of expression.............................................................................................................5
Tolerance for immigrants.........................................................................................................5
Confidence Interval......................................................................................................................6
Confidence Interval 1...............................................................................................................6
Confidence Interval 2...............................................................................................................6
Hypothesis Testing.......................................................................................................................6
Hypothesis 1.............................................................................................................................6
Hypothesis 2.............................................................................................................................6
Hypothesis 3.............................................................................................................................7
Correlation and Regression..........................................................................................................7
Regression 1.............................................................................................................................7
Regression 2.............................................................................................................................9
Conclusion and Limitations...........................................................................................................10
Appendices....................................................................................................................................11
Descriptive Statistics..................................................................................................................11
Continent................................................................................................................................11
Descriptive Statistics..............................................................................................................12
Confidence Interval....................................................................................................................15
Confidence Interval 1.............................................................................................................15
Confidence Interval 2.............................................................................................................16
⊘ This is a preview!⊘
Do you want full access?
Subscribe today to unlock all pages.
Trusted by 1+ million students worldwide
3BUSINESS MODELING AND STATISTICS
Hypothesis Testing.....................................................................................................................16
Hypothesis 1...........................................................................................................................16
Hypothesis2............................................................................................................................17
Hypothesis 3...........................................................................................................................17
Correlation and Regression........................................................................................................18
Regression 1...........................................................................................................................18
Regression 2...........................................................................................................................19
Paraphrase This Document
Need a fresh take? Get an instant paraphrase of this document with our AI Paraphraser

4BUSINESS MODELING AND STATISTICS
Introduction
In the present assignment we analysed the data on Social Progress Index. The data for all
182 countries segregates by continent and countries was taken. For the ease of analysis data for
100 countries was only taken. However it was found that some of the data was missing. Thus all
missing data was removed. Subsequent to removal of missing data the data of 70 countries was
studied. The categories studied were Nutrition and Basic Medical Care, Shelter, Access to Basic
Knowledge, Health and Wellness, Personal Rights and Tolerance and Inclusion. Each of the
categories had many variables. Only one variable from the categories was selected for the study.
Primarily we studied the distribution of the variables. The interval estimate of Child mortality
rate and Tolerance for immigrants was studied. Testing of means was done to analyse for
differences in Adult Literacy Rates of European and African Countries. We also analysed for
mean differences in Freedom Expression of Asian and American Countries. The mean difference
between American and European countries for Life expectancy at 60 was also studied. Attempt
is also made to test the relation of Life expectancy at 60 and Household air pollution and
attributable death. We also fin the relation of Adult Literacy Rate and Freedom of expression
Analysis
Descriptive Statistics
Continent
The selected data contains equal number of countries from Africa and Asia (table 1). The
least number of countries is from Oceania (Figure 3).
Child mortality rate
From the attribute on Nutrition and basic medical care we studied the property of Child
mortality rate. The average Child Mortality rate of the countries is 37.88 (table 2). The Child
Mortality rates for 50% of the countries is below 21.90. The minimum and maximum Child Mortality
Rate are 2.70 and 156.90 respectively. The Child Mortality Rates for 25% of the countries lies below
10.48. The Child Mortality Rates for 75% of the countries below 63.18. The variation in Child
Mortality Rates is 93%.
For most of the countries the maximum Child Mortality rates is 20 (figure 3).
Household air pollution attributable deaths
From the attribute on Shelter we studied the property of Household air pollution
attributable deaths. The average of deaths due to Household air pollution for the countries is 70.16
(table 2). The deaths due to Household air pollution for 50% of the countries are below 34.64. The
minimum and maximum number of deaths occurring due to Household air pollution in the countries
is 0 and 251.92 respectively. The deaths due to Household air pollution for 25% of the countries lie
5BUSINESS MODELING AND STATISTICS
below 4.43. The deaths due to Household air pollution for 75% of the countries below 138.04. There
is a variation of 105% in the number of deaths due to Household air pollution.
For most of the countries the maximum deaths is below 40 (figure 4).
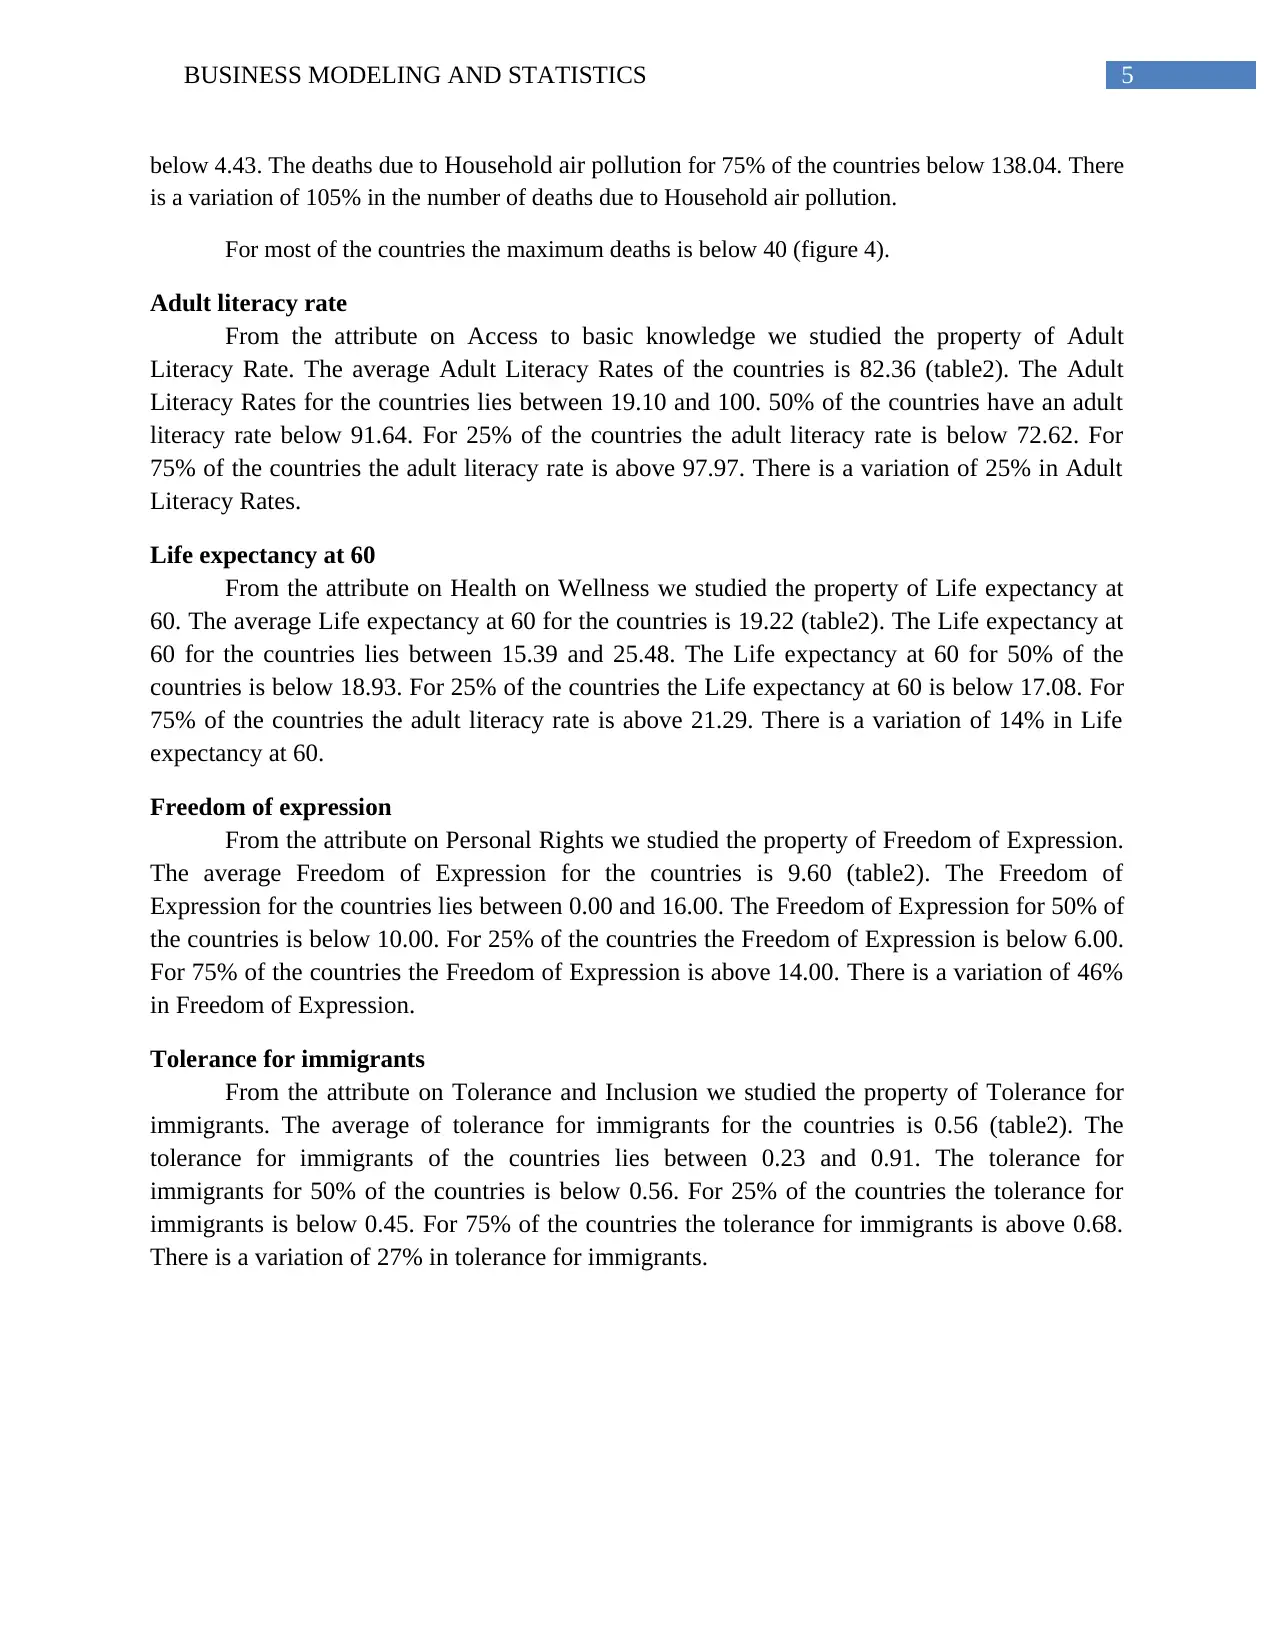
Adult literacy rate
From the attribute on Access to basic knowledge we studied the property of Adult
Literacy Rate. The average Adult Literacy Rates of the countries is 82.36 (table2). The Adult
Literacy Rates for the countries lies between 19.10 and 100. 50% of the countries have an adult
literacy rate below 91.64. For 25% of the countries the adult literacy rate is below 72.62. For
75% of the countries the adult literacy rate is above 97.97. There is a variation of 25% in Adult
Literacy Rates.
Life expectancy at 60
From the attribute on Health on Wellness we studied the property of Life expectancy at
60. The average Life expectancy at 60 for the countries is 19.22 (table2). The Life expectancy at
60 for the countries lies between 15.39 and 25.48. The Life expectancy at 60 for 50% of the
countries is below 18.93. For 25% of the countries the Life expectancy at 60 is below 17.08. For
75% of the countries the adult literacy rate is above 21.29. There is a variation of 14% in Life
expectancy at 60.
Freedom of expression
From the attribute on Personal Rights we studied the property of Freedom of Expression.
The average Freedom of Expression for the countries is 9.60 (table2). The Freedom of
Expression for the countries lies between 0.00 and 16.00. The Freedom of Expression for 50% of
the countries is below 10.00. For 25% of the countries the Freedom of Expression is below 6.00.
For 75% of the countries the Freedom of Expression is above 14.00. There is a variation of 46%
in Freedom of Expression.
Tolerance for immigrants
From the attribute on Tolerance and Inclusion we studied the property of Tolerance for
immigrants. The average of tolerance for immigrants for the countries is 0.56 (table2). The
tolerance for immigrants of the countries lies between 0.23 and 0.91. The tolerance for
immigrants for 50% of the countries is below 0.56. For 25% of the countries the tolerance for
immigrants is below 0.45. For 75% of the countries the tolerance for immigrants is above 0.68.
There is a variation of 27% in tolerance for immigrants.
below 4.43. The deaths due to Household air pollution for 75% of the countries below 138.04. There
is a variation of 105% in the number of deaths due to Household air pollution.
For most of the countries the maximum deaths is below 40 (figure 4).
Adult literacy rate
From the attribute on Access to basic knowledge we studied the property of Adult
Literacy Rate. The average Adult Literacy Rates of the countries is 82.36 (table2). The Adult
Literacy Rates for the countries lies between 19.10 and 100. 50% of the countries have an adult
literacy rate below 91.64. For 25% of the countries the adult literacy rate is below 72.62. For
75% of the countries the adult literacy rate is above 97.97. There is a variation of 25% in Adult
Literacy Rates.
Life expectancy at 60
From the attribute on Health on Wellness we studied the property of Life expectancy at
60. The average Life expectancy at 60 for the countries is 19.22 (table2). The Life expectancy at
60 for the countries lies between 15.39 and 25.48. The Life expectancy at 60 for 50% of the
countries is below 18.93. For 25% of the countries the Life expectancy at 60 is below 17.08. For
75% of the countries the adult literacy rate is above 21.29. There is a variation of 14% in Life
expectancy at 60.
Freedom of expression
From the attribute on Personal Rights we studied the property of Freedom of Expression.
The average Freedom of Expression for the countries is 9.60 (table2). The Freedom of
Expression for the countries lies between 0.00 and 16.00. The Freedom of Expression for 50% of
the countries is below 10.00. For 25% of the countries the Freedom of Expression is below 6.00.
For 75% of the countries the Freedom of Expression is above 14.00. There is a variation of 46%
in Freedom of Expression.
Tolerance for immigrants
From the attribute on Tolerance and Inclusion we studied the property of Tolerance for
immigrants. The average of tolerance for immigrants for the countries is 0.56 (table2). The
tolerance for immigrants of the countries lies between 0.23 and 0.91. The tolerance for
immigrants for 50% of the countries is below 0.56. For 25% of the countries the tolerance for
immigrants is below 0.45. For 75% of the countries the tolerance for immigrants is above 0.68.
There is a variation of 27% in tolerance for immigrants.
⊘ This is a preview!⊘
Do you want full access?
Subscribe today to unlock all pages.
Trusted by 1+ million students worldwide
6BUSINESS MODELING AND STATISTICS
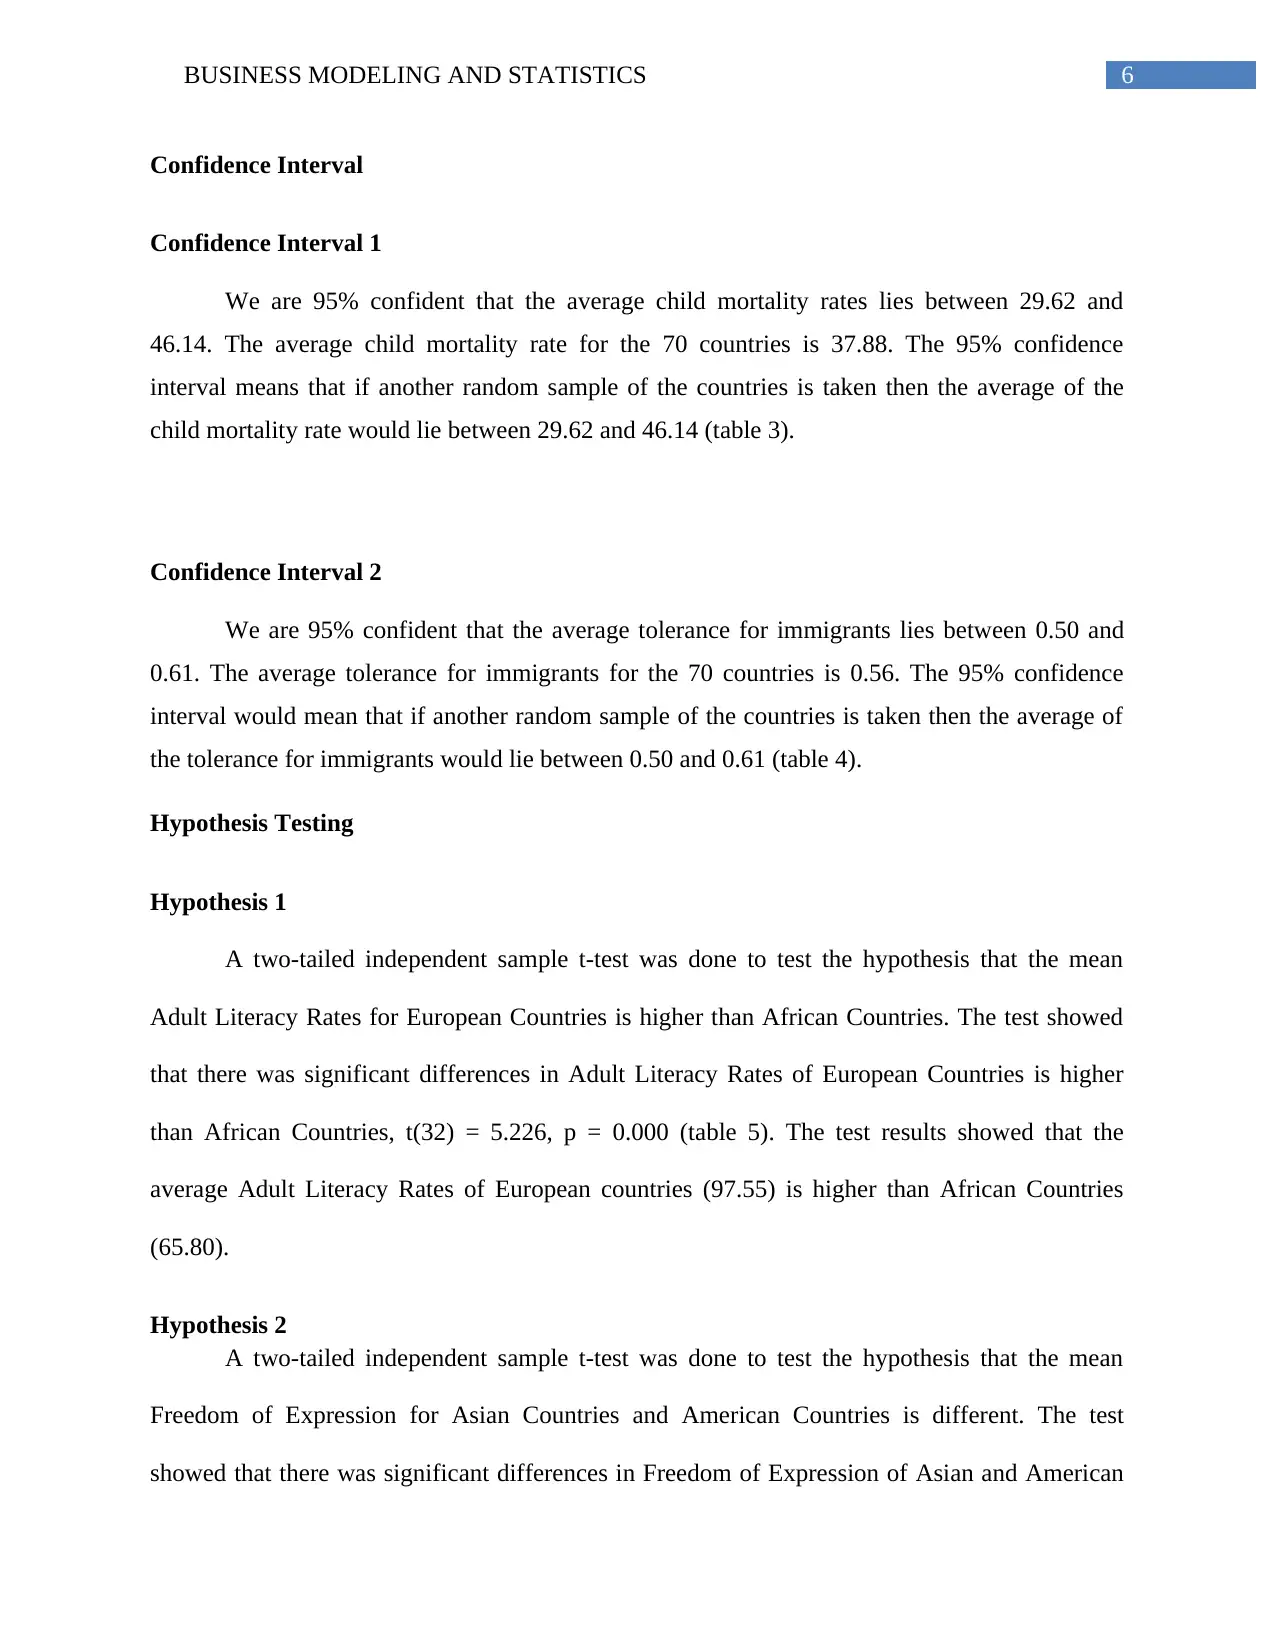
Confidence Interval
Confidence Interval 1
We are 95% confident that the average child mortality rates lies between 29.62 and
46.14. The average child mortality rate for the 70 countries is 37.88. The 95% confidence
interval means that if another random sample of the countries is taken then the average of the
child mortality rate would lie between 29.62 and 46.14 (table 3).
Confidence Interval 2
We are 95% confident that the average tolerance for immigrants lies between 0.50 and
0.61. The average tolerance for immigrants for the 70 countries is 0.56. The 95% confidence
interval would mean that if another random sample of the countries is taken then the average of
the tolerance for immigrants would lie between 0.50 and 0.61 (table 4).
Hypothesis Testing
Hypothesis 1
A two-tailed independent sample t-test was done to test the hypothesis that the mean
Adult Literacy Rates for European Countries is higher than African Countries. The test showed
that there was significant differences in Adult Literacy Rates of European Countries is higher
than African Countries, t(32) = 5.226, p = 0.000 (table 5). The test results showed that the
average Adult Literacy Rates of European countries (97.55) is higher than African Countries
(65.80).
Hypothesis 2
A two-tailed independent sample t-test was done to test the hypothesis that the mean
Freedom of Expression for Asian Countries and American Countries is different. The test
showed that there was significant differences in Freedom of Expression of Asian and American
Paraphrase This Document
Need a fresh take? Get an instant paraphrase of this document with our AI Paraphraser
7BUSINESS MODELING AND STATISTICS
Countries, t(33) = -6.080, p = 0.000 (table 6). The test results showed that the average Freedom
of Expression in America (13.14) is higher than in Asia (6.24).
Hypothesis 3
A two-tailed independent sample t-test was done to test the hypothesis that mean Life
Expectancy at 60 for American Countries and European Countries is different. The test showed
that there was no significant differences in Life Expectancy at 60 for American and European
Countries, t(25) = 0.246, p = 0.808 (table 7). The test results showed that the average Life
Expectancy at 60 in America (21.22) is similar to that of European Countries (20.99).
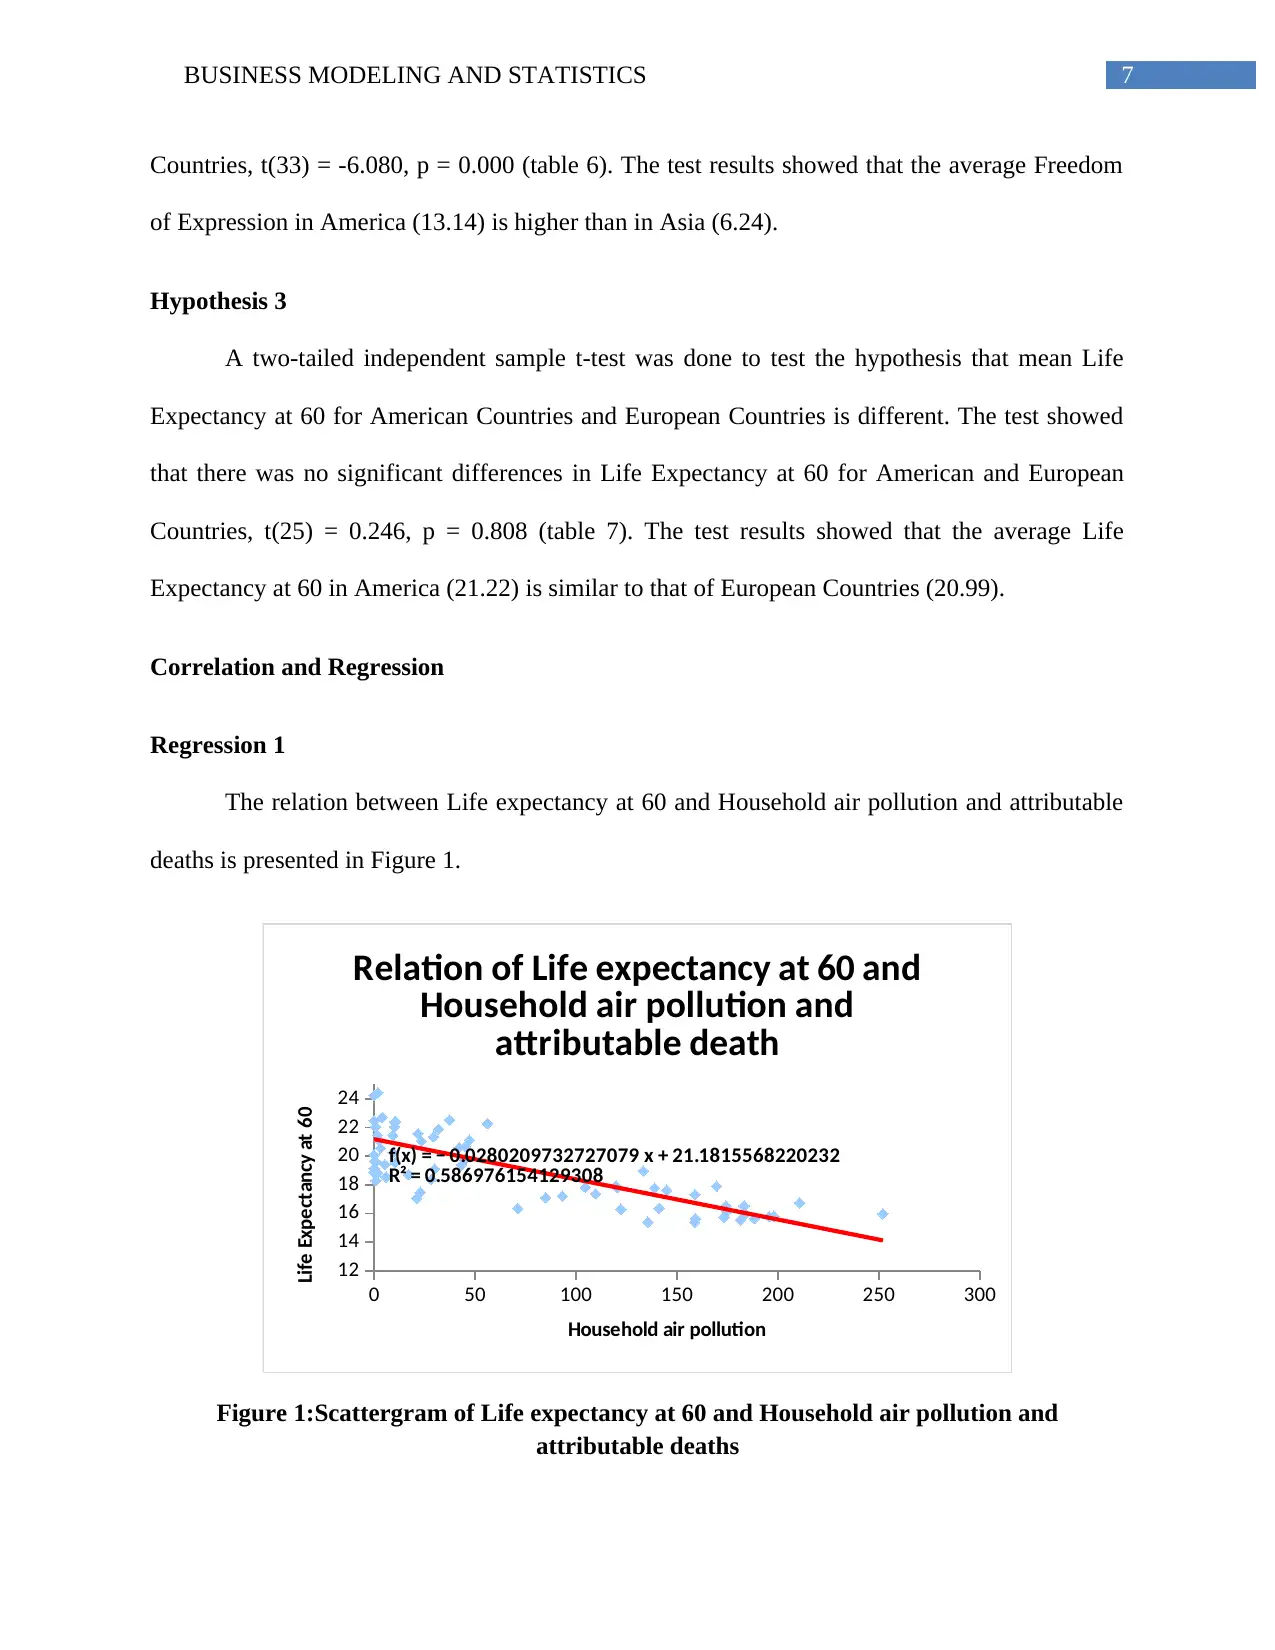
Correlation and Regression
Regression 1
The relation between Life expectancy at 60 and Household air pollution and attributable
deaths is presented in Figure 1.
0 50 100 150 200 250 300
12
14
16
18
20
22
24
f(x) = − 0.0280209732727079 x + 21.1815568220232
R² = 0.586976154129308
Relation of Life expectancy at 60 and
Household air pollution and
attributable death
Household air pollution
Life Expectancy at 60
Figure 1:Scattergram of Life expectancy at 60 and Household air pollution and
attributable deaths
Countries, t(33) = -6.080, p = 0.000 (table 6). The test results showed that the average Freedom
of Expression in America (13.14) is higher than in Asia (6.24).
Hypothesis 3
A two-tailed independent sample t-test was done to test the hypothesis that mean Life
Expectancy at 60 for American Countries and European Countries is different. The test showed
that there was no significant differences in Life Expectancy at 60 for American and European
Countries, t(25) = 0.246, p = 0.808 (table 7). The test results showed that the average Life
Expectancy at 60 in America (21.22) is similar to that of European Countries (20.99).
Correlation and Regression
Regression 1
The relation between Life expectancy at 60 and Household air pollution and attributable
deaths is presented in Figure 1.
0 50 100 150 200 250 300
12
14
16
18
20
22
24
f(x) = − 0.0280209732727079 x + 21.1815568220232
R² = 0.586976154129308
Relation of Life expectancy at 60 and
Household air pollution and
attributable death
Household air pollution
Life Expectancy at 60
Figure 1:Scattergram of Life expectancy at 60 and Household air pollution and
attributable deaths
8BUSINESS MODELING AND STATISTICS
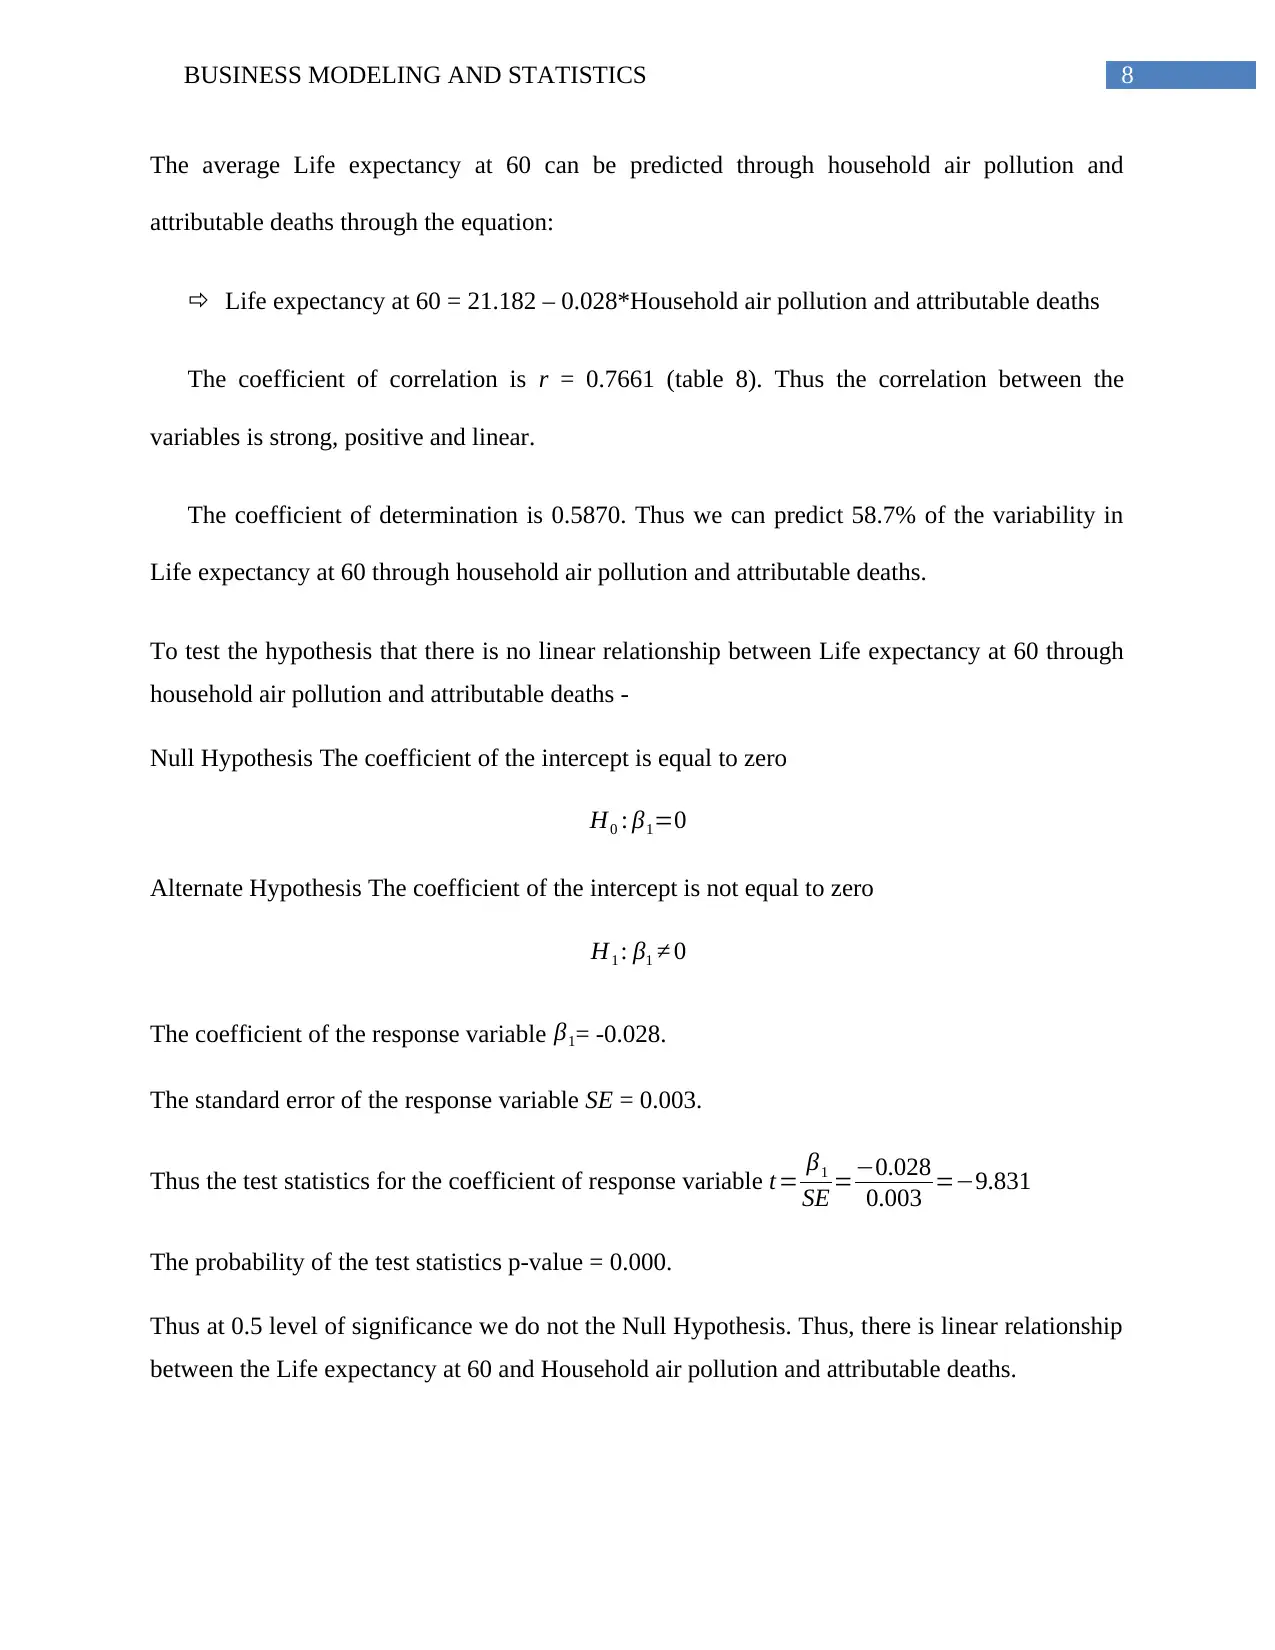
The average Life expectancy at 60 can be predicted through household air pollution and
attributable deaths through the equation:
Life expectancy at 60 = 21.182 – 0.028*Household air pollution and attributable deaths
The coefficient of correlation is r = 0.7661 (table 8). Thus the correlation between the
variables is strong, positive and linear.
The coefficient of determination is 0.5870. Thus we can predict 58.7% of the variability in
Life expectancy at 60 through household air pollution and attributable deaths.
To test the hypothesis that there is no linear relationship between Life expectancy at 60 through
household air pollution and attributable deaths -
Null Hypothesis The coefficient of the intercept is equal to zero
H0 : β1=0
Alternate Hypothesis The coefficient of the intercept is not equal to zero
H1 : β1 ≠ 0
The coefficient of the response variable β1= -0.028.
The standard error of the response variable SE = 0.003.
Thus the test statistics for the coefficient of response variable t= β1
SE =−0.028
0.003 =−9.831
The probability of the test statistics p-value = 0.000.
Thus at 0.5 level of significance we do not the Null Hypothesis. Thus, there is linear relationship
between the Life expectancy at 60 and Household air pollution and attributable deaths.
⊘ This is a preview!⊘
Do you want full access?
Subscribe today to unlock all pages.
Trusted by 1+ million students worldwide
9BUSINESS MODELING AND STATISTICS
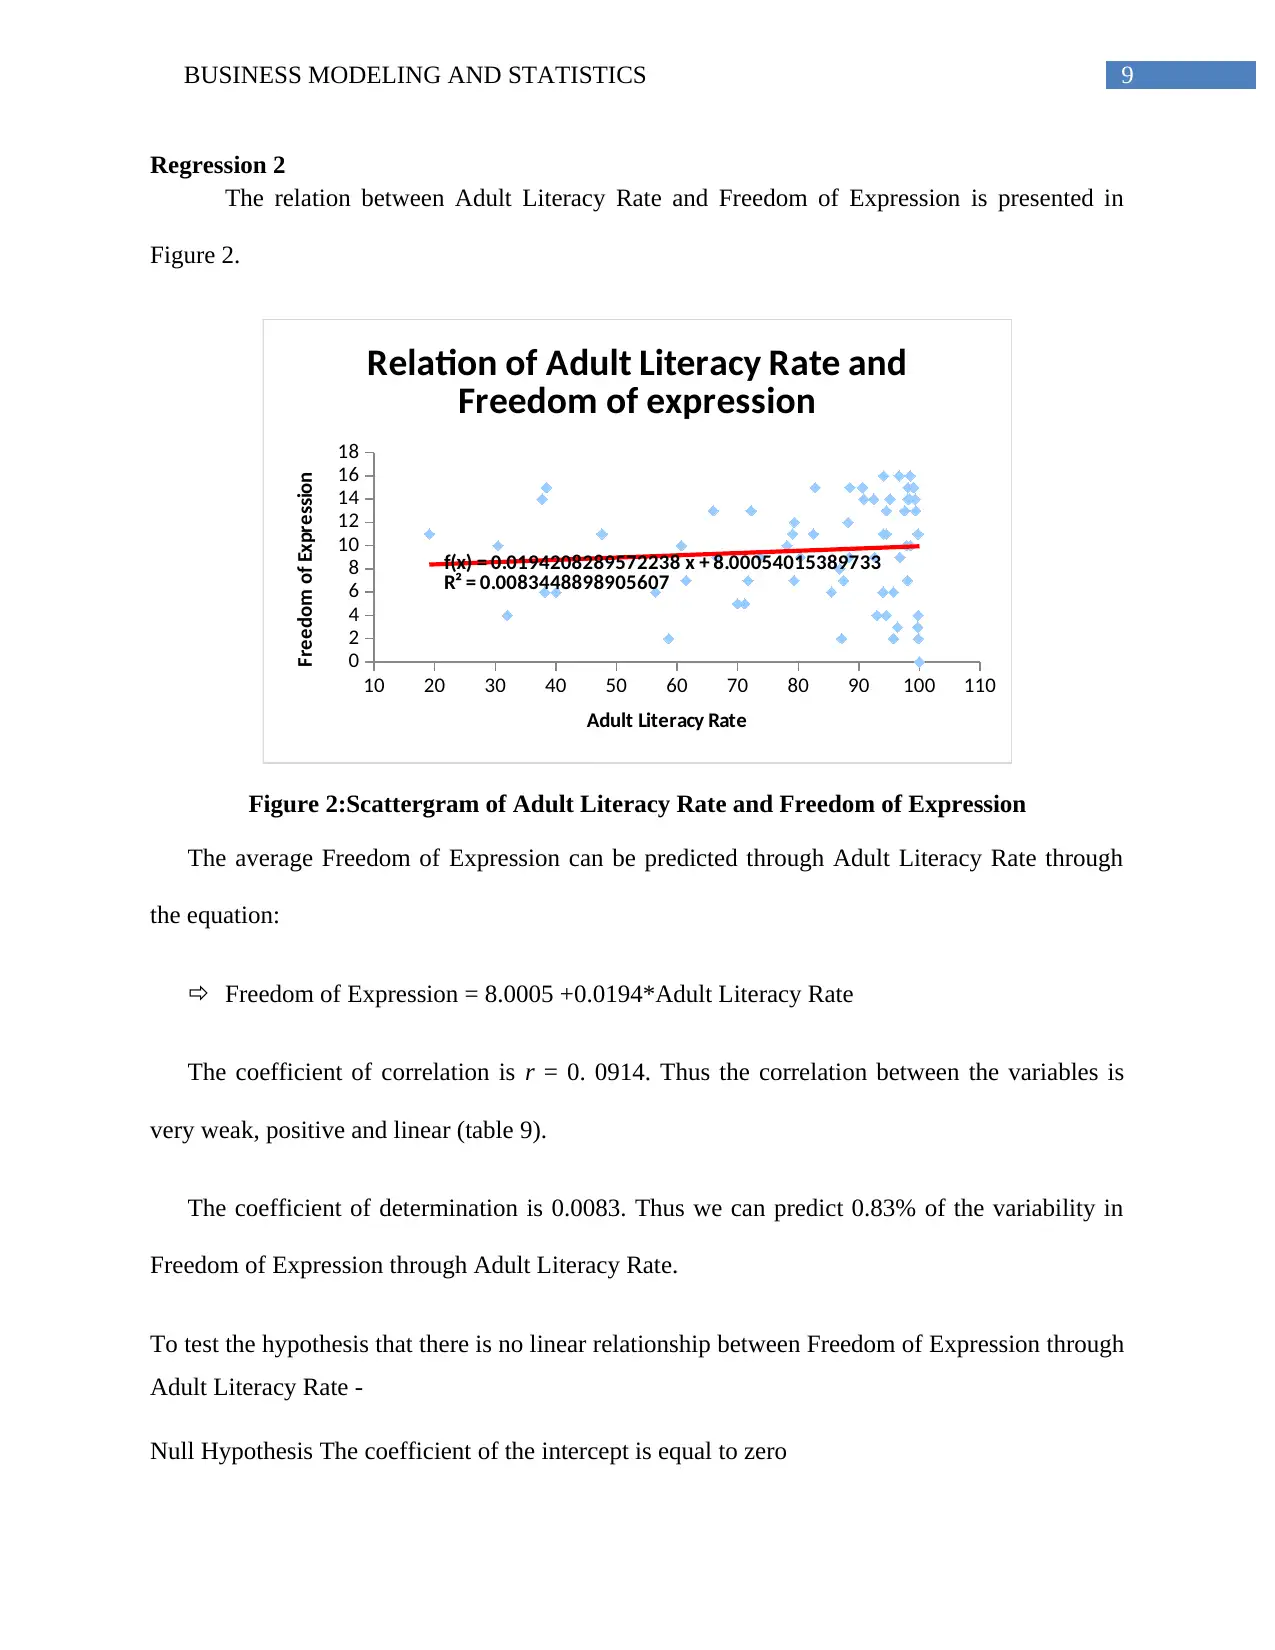
Regression 2
The relation between Adult Literacy Rate and Freedom of Expression is presented in
Figure 2.
10 20 30 40 50 60 70 80 90 100 110
0
2
4
6
8
10
12
14
16
18
f(x) = 0.0194208289572238 x + 8.00054015389733
R² = 0.0083448898905607
Relation of Adult Literacy Rate and
Freedom of expression
Adult Literacy Rate
Freedom of Expression
Figure 2:Scattergram of Adult Literacy Rate and Freedom of Expression
The average Freedom of Expression can be predicted through Adult Literacy Rate through
the equation:
Freedom of Expression = 8.0005 +0.0194*Adult Literacy Rate
The coefficient of correlation is r = 0. 0914. Thus the correlation between the variables is
very weak, positive and linear (table 9).
The coefficient of determination is 0.0083. Thus we can predict 0.83% of the variability in
Freedom of Expression through Adult Literacy Rate.
To test the hypothesis that there is no linear relationship between Freedom of Expression through
Adult Literacy Rate -
Null Hypothesis The coefficient of the intercept is equal to zero
Paraphrase This Document
Need a fresh take? Get an instant paraphrase of this document with our AI Paraphraser
10BUSINESS MODELING AND STATISTICS
H0 : β1=0
Alternate Hypothesis The coefficient of the intercept is not equal to zero
H1 : β1 ≠ 0
The coefficient of the response variable β1= 0.019.
The standard error of the response variable SE = 0.026.
Thus the test statistics for the coefficient of response variable t= β1
SE = 0.019
0.026 =0.756
The probability of the test statistics p-value = 0.452.
Thus at 0.5 level of significance we do not reject the Null Hypothesis. Thus, there is no linear
relationship between Freedom of Expression and Adult Literacy Rate.
Conclusion and Limitations
In the present analysis we selected countries from all five continents. The analysis of the
data shows that there decline in child mortality rate, Life expectancy at 60 and deaths attributed
to household air pollution. There is an increase in Adult Literacy Rates, Freedom of Expression
and Tolerance for immigrants. The study found that there is a significant difference in the
average Adult Literacy Rate for European and African Countries and average Freedom of
Expression for Asian and American Countries. On the other hand there is no significant
difference in average Life Expectancy at 60 for American and European Countries. We can
predict to some extent Life expectancy at 60 and Household air pollution and attributable deaths
for the countries.
The analysis done related to the data here of 70 countries. In order to make conclusive
report repeated further analysis of the data of all countries would be required. Moreover the data
belongs to 2017 only. Long term studies need to be done to conclusively tell that the justify the
results of the analysis.
11BUSINESS MODELING AND STATISTICS
Appendices
Descriptive Statistics
Continent Continent
ASIA
EUROPE
ASIA
EUROPE
ASIA
ASIA
AFRICA
AFRICA
AFRICA
ASIA
ASIA
ASIA
EUROPE
AFRICA
AFRICA
EUROPE
ASIA
AFRICA
OCEANIA
EUROPE
ASIA
ASIA
AMERICA
AMERICA
AFRICA
AMERICA
AFRICA
ASIA
EUROPE
AMERICA
AFRICA
ASIA
AFRICA
EUROPE
AFRICA
ASIA
ASIA
AMERICA
AFRICA
ASIA
AMERICA
AMERICA
AFRICA
EUROPE
AMERICA
ASIA
EUROPE
EUROPE
AFRICA
AFRICA
EUROPE
AFRICA
AFRICA
AMERICA
AMERICA
AMERICA
ASIA
AMERICA
ASIA
AFRICA
⊘ This is a preview!⊘
Do you want full access?
Subscribe today to unlock all pages.
Trusted by 1+ million students worldwide
1 out of 29
Related Documents


Your All-in-One AI-Powered Toolkit for Academic Success.
+13062052269
info@desklib.com
Available 24*7 on WhatsApp / Email
![[object Object]](/_next/static/media/star-bottom.7253800d.svg)
Unlock your academic potential
Copyright © 2020–2026 A2Z Services. All Rights Reserved. Developed and managed by ZUCOL.