Econometrica Research: Social Skills as Predictors of Team Success
VerifiedAdded on 2024/06/18
|15
|7074
|314
Report
AI Summary
This document is a supplementary material to an Econometrica article that investigates the impact of social skills on team performance. It provides a detailed description of the tasks used in the study to estimate the team player effect. These tasks include an Optimization task where participants find the maximum of a complex function, a Memory task focusing on short-term memory using words, images, and stories, and a Shapes task relying on measures of fluid intelligence. A Cryptography task is also described as a validation measure of group performance. The document explains the procedures for both individual and group versions of each task, highlighting the importance of cooperation and information sharing among group members. The goal of these tasks was to create scenarios where teamwork plausibly improves performance, while also allowing for objective ranking and comparison of individual and group results. The findings suggest that social skills significantly contribute to team success, emphasizing the importance of collective planning and shared understanding within a team.
Econometrica Supplementary Material
SUPPLEMENT TO “TEAM PLAYERS: HOW SOCIAL SKILLS IMPROVE TEAM
PERFORMANCE”
(Econometrica, Vol. 89, No. 6, November 2021, 2637–2657)
BEN WEIDMANN
Harvard Kennedy School, Harvard University
DAVID J. DEMING
Harvard Kennedy School, Harvard University and NBER
APPENDIX: DETAILED TASK DESCRIPTIONS
THIS PART OF THE SUPPLEMENT EXPANDS on Section 2.2 and provides a detailed descrip-
tion of the three tasks we used to estimate the team player effect (Optimization, M
and Shapes) along with our validation task (Cryptography). All the tasks aimed to m
three criteria. First, we sought tasks that could be administered to both individuals
groups,with only minor modifications between the individual and group versions.This
enabled us to estimate group performance controlling for individual task-specific s
ond,tasks needed to be objective in the sense that we could easily rank performan
across individuals and groups.Third, since we are interested in studying teamwork,we
looked for tasks where cooperation among group members would plausibly improv
formance.
A.1. Optimization Task
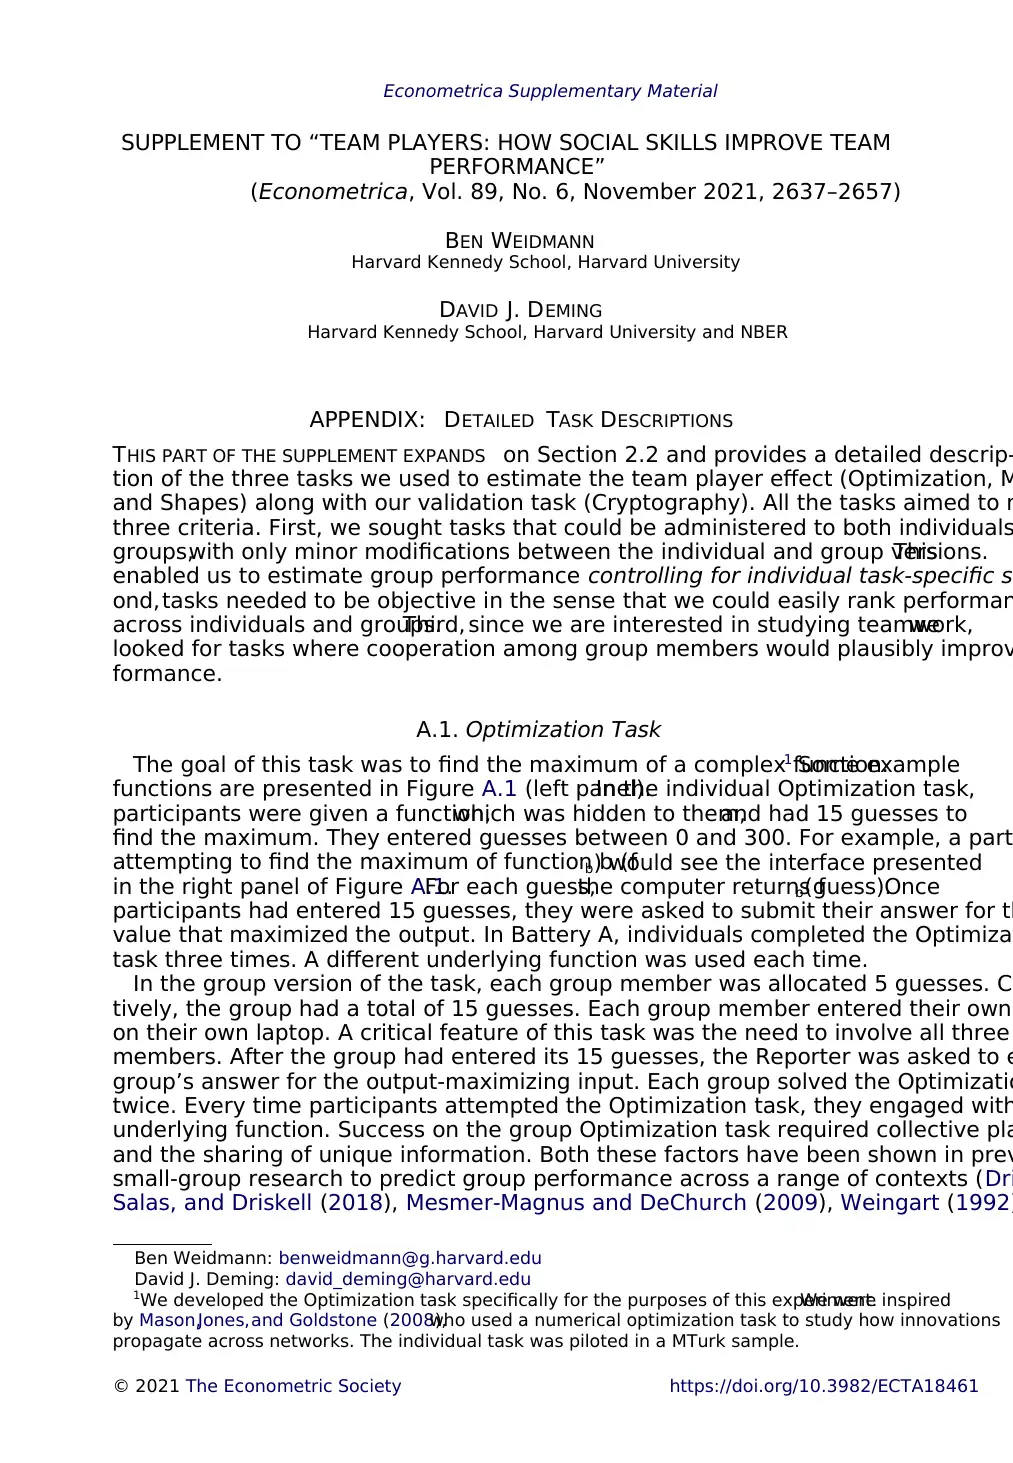
The goal of this task was to find the maximum of a complex function.1 Some example
functions are presented in Figure A.1 (left panel).In the individual Optimization task,
participants were given a function,which was hidden to them,and had 15 guesses to
find the maximum. They entered guesses between 0 and 300. For example, a part
attempting to find the maximum of function b (fb) would see the interface presented
in the right panel of Figure A.1.For each guess,the computer returns fb(guess).Once
participants had entered 15 guesses, they were asked to submit their answer for th
value that maximized the output. In Battery A, individuals completed the Optimizat
task three times. A different underlying function was used each time.
In the group version of the task, each group member was allocated 5 guesses. Co
tively, the group had a total of 15 guesses. Each group member entered their own
on their own laptop. A critical feature of this task was the need to involve all three
members. After the group had entered its 15 guesses, the Reporter was asked to e
group’s answer for the output-maximizing input. Each group solved the Optimizatio
twice. Every time participants attempted the Optimization task, they engaged with
underlying function. Success on the group Optimization task required collective pla
and the sharing of unique information. Both these factors have been shown in prev
small-group research to predict group performance across a range of contexts (Dri
Salas, and Driskell (2018), Mesmer-Magnus and DeChurch (2009), Weingart (1992)
Ben Weidmann: benweidmann@g.harvard.edu
David J. Deming: david_deming@harvard.edu
1We developed the Optimization task specifically for the purposes of this experiment.We were inspired
by Mason,Jones,and Goldstone (2008),who used a numerical optimization task to study how innovations
propagate across networks. The individual task was piloted in a MTurk sample.
© 2021 The Econometric Society https://doi.org/10.3982/ECTA18461
SUPPLEMENT TO “TEAM PLAYERS: HOW SOCIAL SKILLS IMPROVE TEAM
PERFORMANCE”
(Econometrica, Vol. 89, No. 6, November 2021, 2637–2657)
BEN WEIDMANN
Harvard Kennedy School, Harvard University
DAVID J. DEMING
Harvard Kennedy School, Harvard University and NBER
APPENDIX: DETAILED TASK DESCRIPTIONS
THIS PART OF THE SUPPLEMENT EXPANDS on Section 2.2 and provides a detailed descrip-
tion of the three tasks we used to estimate the team player effect (Optimization, M
and Shapes) along with our validation task (Cryptography). All the tasks aimed to m
three criteria. First, we sought tasks that could be administered to both individuals
groups,with only minor modifications between the individual and group versions.This
enabled us to estimate group performance controlling for individual task-specific s
ond,tasks needed to be objective in the sense that we could easily rank performan
across individuals and groups.Third, since we are interested in studying teamwork,we
looked for tasks where cooperation among group members would plausibly improv
formance.
A.1. Optimization Task
The goal of this task was to find the maximum of a complex function.1 Some example
functions are presented in Figure A.1 (left panel).In the individual Optimization task,
participants were given a function,which was hidden to them,and had 15 guesses to
find the maximum. They entered guesses between 0 and 300. For example, a part
attempting to find the maximum of function b (fb) would see the interface presented
in the right panel of Figure A.1.For each guess,the computer returns fb(guess).Once
participants had entered 15 guesses, they were asked to submit their answer for th
value that maximized the output. In Battery A, individuals completed the Optimizat
task three times. A different underlying function was used each time.
In the group version of the task, each group member was allocated 5 guesses. Co
tively, the group had a total of 15 guesses. Each group member entered their own
on their own laptop. A critical feature of this task was the need to involve all three
members. After the group had entered its 15 guesses, the Reporter was asked to e
group’s answer for the output-maximizing input. Each group solved the Optimizatio
twice. Every time participants attempted the Optimization task, they engaged with
underlying function. Success on the group Optimization task required collective pla
and the sharing of unique information. Both these factors have been shown in prev
small-group research to predict group performance across a range of contexts (Dri
Salas, and Driskell (2018), Mesmer-Magnus and DeChurch (2009), Weingart (1992)
Ben Weidmann: benweidmann@g.harvard.edu
David J. Deming: david_deming@harvard.edu
1We developed the Optimization task specifically for the purposes of this experiment.We were inspired
by Mason,Jones,and Goldstone (2008),who used a numerical optimization task to study how innovations
propagate across networks. The individual task was piloted in a MTurk sample.
© 2021 The Econometric Society https://doi.org/10.3982/ECTA18461
Paraphrase This Document
Need a fresh take? Get an instant paraphrase of this document with our AI Paraphraser
2 B. WEIDMANN AND D. J. DEMING
FIGURE A.1.—Description of the Optimization task. Note: This figure presents a visual description of the
Optimization task.Participants were asked to enter guesses between 0 and 300 (the horizontalaxis).They
received an output from a complex function (the verticalaxis).The left panelcontains example functions,
which were hidden to participants. The right panel is the participant interface. The goal of the task is to find
the maximum of the function.In the first phase of the experiment,individuals received 15 guesses before
submitting an answer. In the second phase, each member of a 3-person team received 5 guesses; once all
guesses had been entered, the group agreed upon a final answer.
A.2. Memory Task
This task focused on short-term memory, which is closely associated with fluid intell
gence and IQ (Colom, Rebollo, Abad, and Shih (2006), Nisbett et al. (2012)). We tested
participants’ ability to memorize three different types of stimuli: words, images, and s
ries.2
In Phase 1 of the experiment, individuals’ short-term memory for each type of stimu
was measured sequentially. Participants began by completing the words test. This inv
memorizing a list of 12 target words over 24 seconds (the stimuli come from the Hopk
Verbal Learning Test, reported in Brandt (1991). After the memorization period, partic
pants were presented with sets of three words and were asked to identify which, if an
the three, were target words. Next, participants completed the images test, in which t
were given 20 seconds to memorize six target faces (the stimuli come from the Camb
Face Memory Test, described in Duchaine and Nakayama (2006)). Participants were th
presented with 15 sets of three faces and asked to identify target faces. Last, particip
completed the stories test in which they had 40 seconds to read two short paragraphs
of roughly 60 words each. The stimuli were adapted from Wechsler Logical Memory III
(Wechsler (1997)). At the end of the memorization period, participants were asked nin
multiple choice questions about the two paragraphs.
Once participants had completed the three individual memory tests, we provided fe
back about their results. This included information on an individual’s overall performa
relative to other participants and emphasized the test on which they scored highest. O
2We drew on a modelof memory that emphasizes three subsystems:verbal,visual-spatial,and episodic
(Baddeley (2001)).Our three stimuli map onto these subsystems: verbal→ words; visualspatial→ images;
episodic → stories. We note that the Baddeley model focuses on working memory, not short-term memory.
The two concepts, however, are very closely linked, as discussed in Colom et al. (2006). The reason we focu
on short-term memory is that the subtests are easier to translate into a practical task for groups to perform
when working face-to-face in a lab setting.
TEAM PLAYERS 3
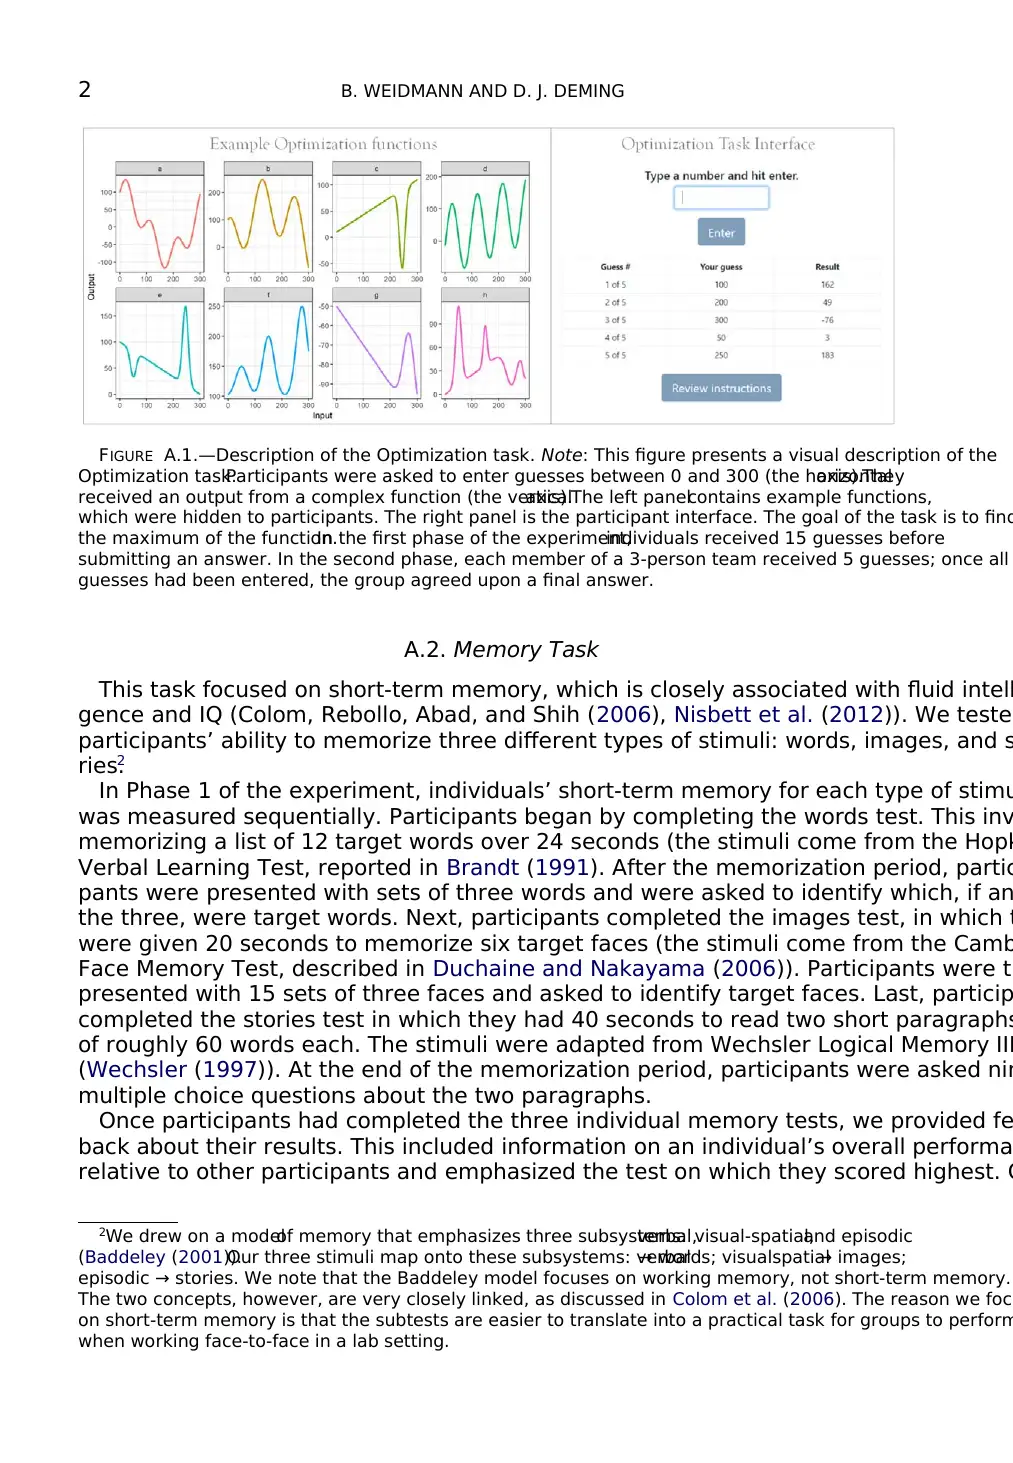
FIGURE A.2.—Description of the Memory task (for groups). Note: This figure presents a visual descript
of the group Memory task. Participants were given 40 seconds in which they could cycle through: 6 diffe
images (Panel A), 2 different stories (Panel B), and 12 different words (Panel C) on their own laptop. The
groups gathered around a single laptop and answered 24 questions together about the three sets of sti
with an equal number of questions about each.
goal with the feedback was to provide people with information they might use in th
phase of the experiment to select sub-tasks on which they were most proficient.
In the group version of the task, we combined established measures of individua
ory into a collaborative memory challenge.Each group was given 40 seconds to collec-
tively remember 12 words, 6 images, and 2 stories. We added story and images st
those described above, so that each time a group encountered the Memory task th
asked to memorize unseen material.3
Each member of the group viewed their own laptop and could view any of the thr
stimuli. Participants could change the stimuli they were memorizing during the 40-
memorization period. In the example presented in Figure A.2, participant A is mem
ing images (cars),participant B is memorizing stories,and participant C is memorizing
words.During the 40-second memorization period,participants could change the stim-
ulus they were viewing at any time by using the buttons in the top left of their scre
Before the memorization period began, groups were prompted to discuss their stra
After the memorization period,all three team members gathered around the Re-
porter’s laptop to answer a set of 24 questions about the stimuli.There were an equal
number of questions about each type of stimuli. The structure of the questions mir
those used in the individual assessments.
A.3. Shapes Task
This task relied on two well-established measures of fluid intelligence:the Culture
Fair Intelligence Test (CFIT,Scale 3) and the Raven’s Advanced Progressive Matrices
3We supplemented stories with shortened versions from Sullivan (2005). For images, we added relate
focused on cars, bikes, and bodies, described in Dennett et al. (2012).
⊘ This is a preview!⊘
Do you want full access?
Subscribe today to unlock all pages.
Trusted by 1+ million students worldwide
4 B. WEIDMANN AND D. J. DEMING
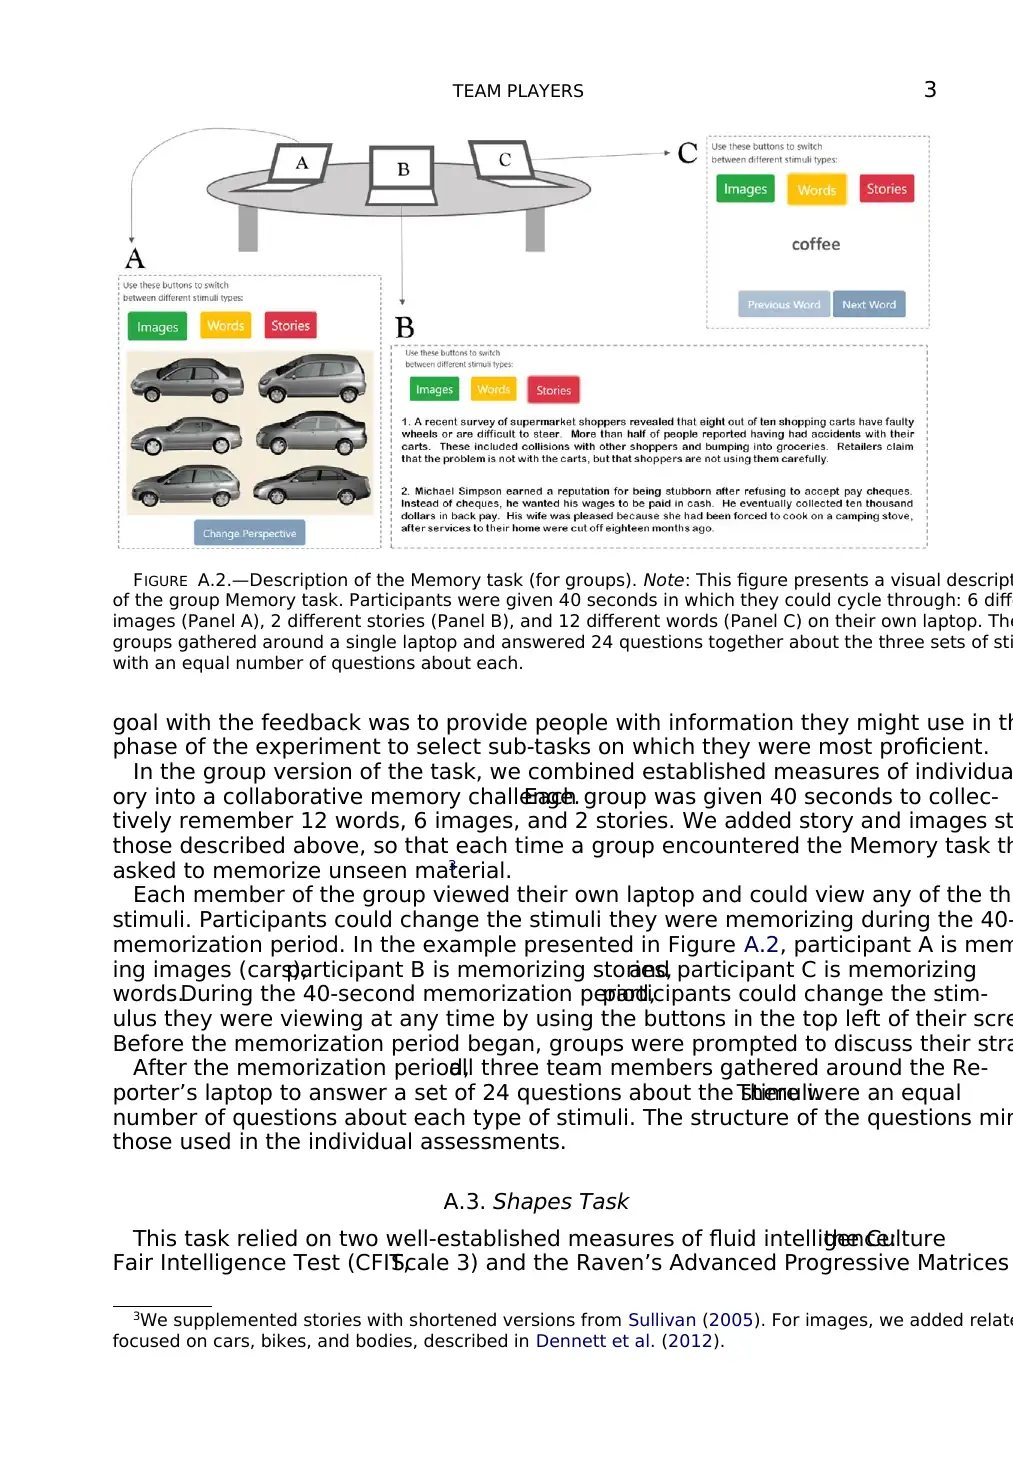
FIGURE A.3.—Description of the Shapes task.Note: This figure presents example items from the Shapes
task,which was adapted from two well-established measures of IQ or fluid intelligence—the Culture Fair
Intelligence Test (CFIT) and the Raven’s Advanced Progressive Matrices (Ravens). In the individual phase of
the experiment, participants were given 14 items and seven minutes. The mean score was 7.3, and no indiv
received a perfect score.In the group phase,all members gathered around a single laptop and collectively
decided on an answer for each item.Mean scores differed by battery but once again no groups received a
perfect score. The correct answer for the Ravens Example is ‘1’; for the CFIT example the correct answer is
‘c’.
(Ravens). In the individual testing phase, participants completed 14 Ravens items (ev
numbered items, ranging in difficulty from across sets I and II; see Raven (2003)).
This task centers on pattern recognition and spatial reasoning. Participants are aske
look for a pattern and determine “what comes next.” As an example, consider the pat
established in the left-most box of Figure A.3, which is missing a piece. Participants w
asked to find the missing element (from options a to f).
The group version of this task employed the CFIT, which is very similar to the Raven
task. All group members gathered around the Reporter’s laptop and collectively decid
on the group’s answer for each item. In each battery is contained a different form of t
CFIT. An example item is provided in the right-hand panel of Figure A.3.
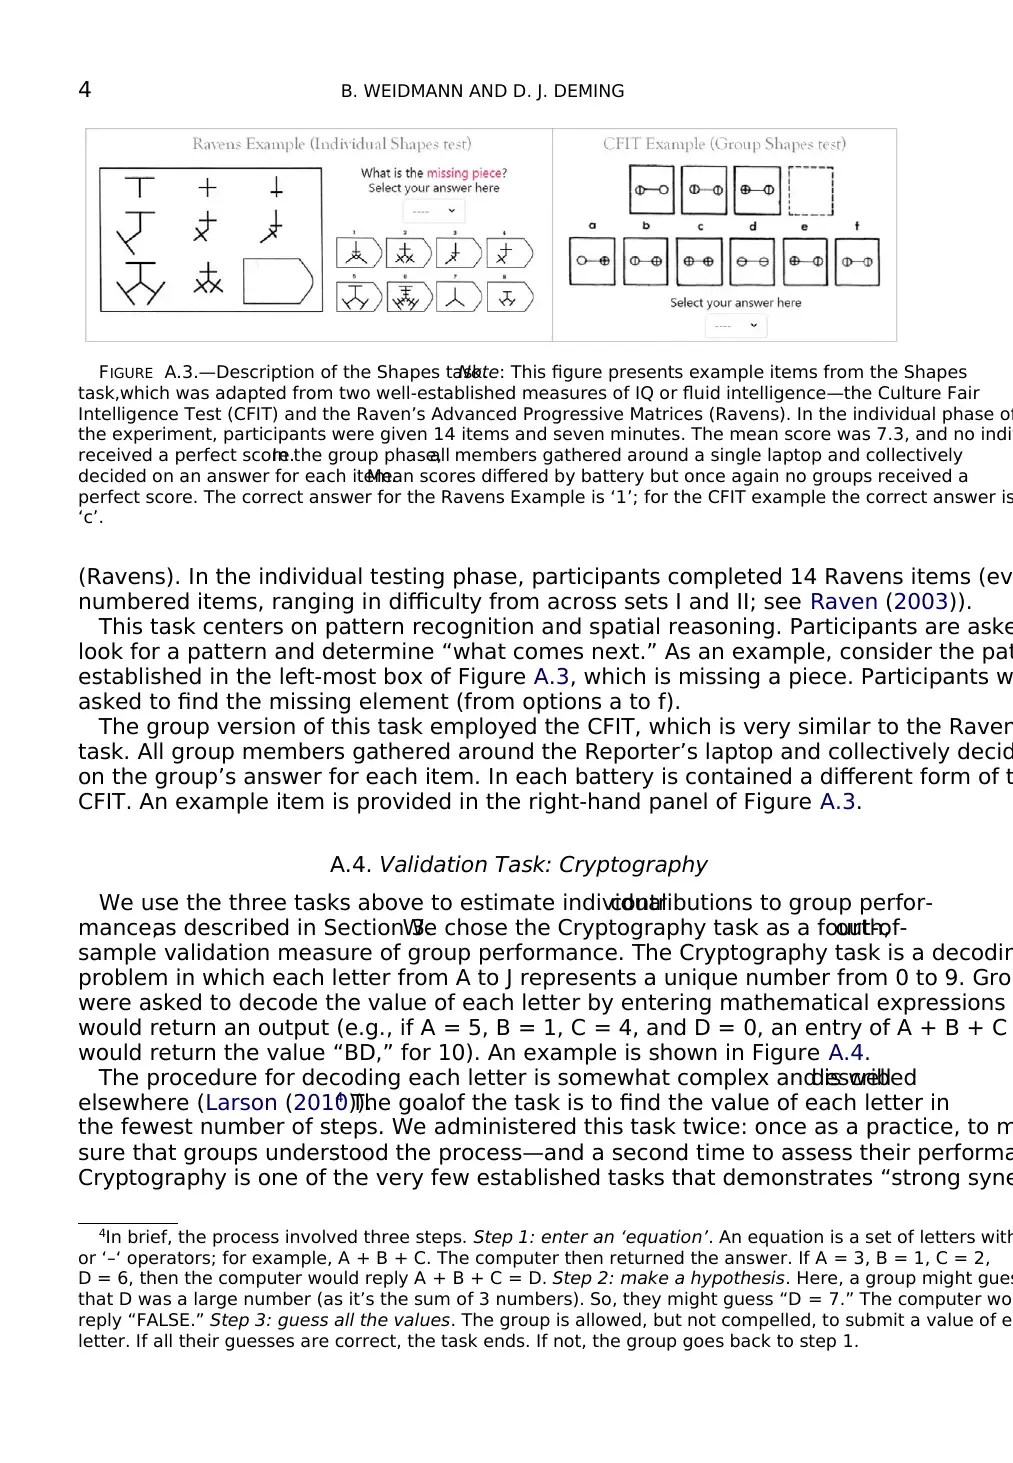
A.4. Validation Task: Cryptography
We use the three tasks above to estimate individualcontributions to group perfor-
mance,as described in Section 3.We chose the Cryptography task as a fourth,out-of-
sample validation measure of group performance. The Cryptography task is a decodin
problem in which each letter from A to J represents a unique number from 0 to 9. Grou
were asked to decode the value of each letter by entering mathematical expressions
would return an output (e.g., if A = 5, B = 1, C = 4, and D = 0, an entry of A + B + C
would return the value “BD,” for 10). An example is shown in Figure A.4.
The procedure for decoding each letter is somewhat complex and is welldescribed
elsewhere (Larson (2010)).4 The goalof the task is to find the value of each letter in
the fewest number of steps. We administered this task twice: once as a practice, to m
sure that groups understood the process—and a second time to assess their performa
Cryptography is one of the very few established tasks that demonstrates “strong syne
4In brief, the process involved three steps. Step 1: enter an ‘equation’. An equation is a set of letters with
or ‘–‘ operators; for example, A + B + C. The computer then returned the answer. If A = 3, B = 1, C = 2,
D = 6, then the computer would reply A + B + C = D. Step 2: make a hypothesis. Here, a group might gues
that D was a large number (as it’s the sum of 3 numbers). So, they might guess “D = 7.” The computer wou
reply “FALSE.” Step 3: guess all the values. The group is allowed, but not compelled, to submit a value of ea
letter. If all their guesses are correct, the task ends. If not, the group goes back to step 1.
FIGURE A.3.—Description of the Shapes task.Note: This figure presents example items from the Shapes
task,which was adapted from two well-established measures of IQ or fluid intelligence—the Culture Fair
Intelligence Test (CFIT) and the Raven’s Advanced Progressive Matrices (Ravens). In the individual phase of
the experiment, participants were given 14 items and seven minutes. The mean score was 7.3, and no indiv
received a perfect score.In the group phase,all members gathered around a single laptop and collectively
decided on an answer for each item.Mean scores differed by battery but once again no groups received a
perfect score. The correct answer for the Ravens Example is ‘1’; for the CFIT example the correct answer is
‘c’.
(Ravens). In the individual testing phase, participants completed 14 Ravens items (ev
numbered items, ranging in difficulty from across sets I and II; see Raven (2003)).
This task centers on pattern recognition and spatial reasoning. Participants are aske
look for a pattern and determine “what comes next.” As an example, consider the pat
established in the left-most box of Figure A.3, which is missing a piece. Participants w
asked to find the missing element (from options a to f).
The group version of this task employed the CFIT, which is very similar to the Raven
task. All group members gathered around the Reporter’s laptop and collectively decid
on the group’s answer for each item. In each battery is contained a different form of t
CFIT. An example item is provided in the right-hand panel of Figure A.3.
A.4. Validation Task: Cryptography
We use the three tasks above to estimate individualcontributions to group perfor-
mance,as described in Section 3.We chose the Cryptography task as a fourth,out-of-
sample validation measure of group performance. The Cryptography task is a decodin
problem in which each letter from A to J represents a unique number from 0 to 9. Grou
were asked to decode the value of each letter by entering mathematical expressions
would return an output (e.g., if A = 5, B = 1, C = 4, and D = 0, an entry of A + B + C
would return the value “BD,” for 10). An example is shown in Figure A.4.
The procedure for decoding each letter is somewhat complex and is welldescribed
elsewhere (Larson (2010)).4 The goalof the task is to find the value of each letter in
the fewest number of steps. We administered this task twice: once as a practice, to m
sure that groups understood the process—and a second time to assess their performa
Cryptography is one of the very few established tasks that demonstrates “strong syne
4In brief, the process involved three steps. Step 1: enter an ‘equation’. An equation is a set of letters with
or ‘–‘ operators; for example, A + B + C. The computer then returned the answer. If A = 3, B = 1, C = 2,
D = 6, then the computer would reply A + B + C = D. Step 2: make a hypothesis. Here, a group might gues
that D was a large number (as it’s the sum of 3 numbers). So, they might guess “D = 7.” The computer wou
reply “FALSE.” Step 3: guess all the values. The group is allowed, but not compelled, to submit a value of ea
letter. If all their guesses are correct, the task ends. If not, the group goes back to step 1.
Paraphrase This Document
Need a fresh take? Get an instant paraphrase of this document with our AI Paraphraser
TEAM PLAYERS 5
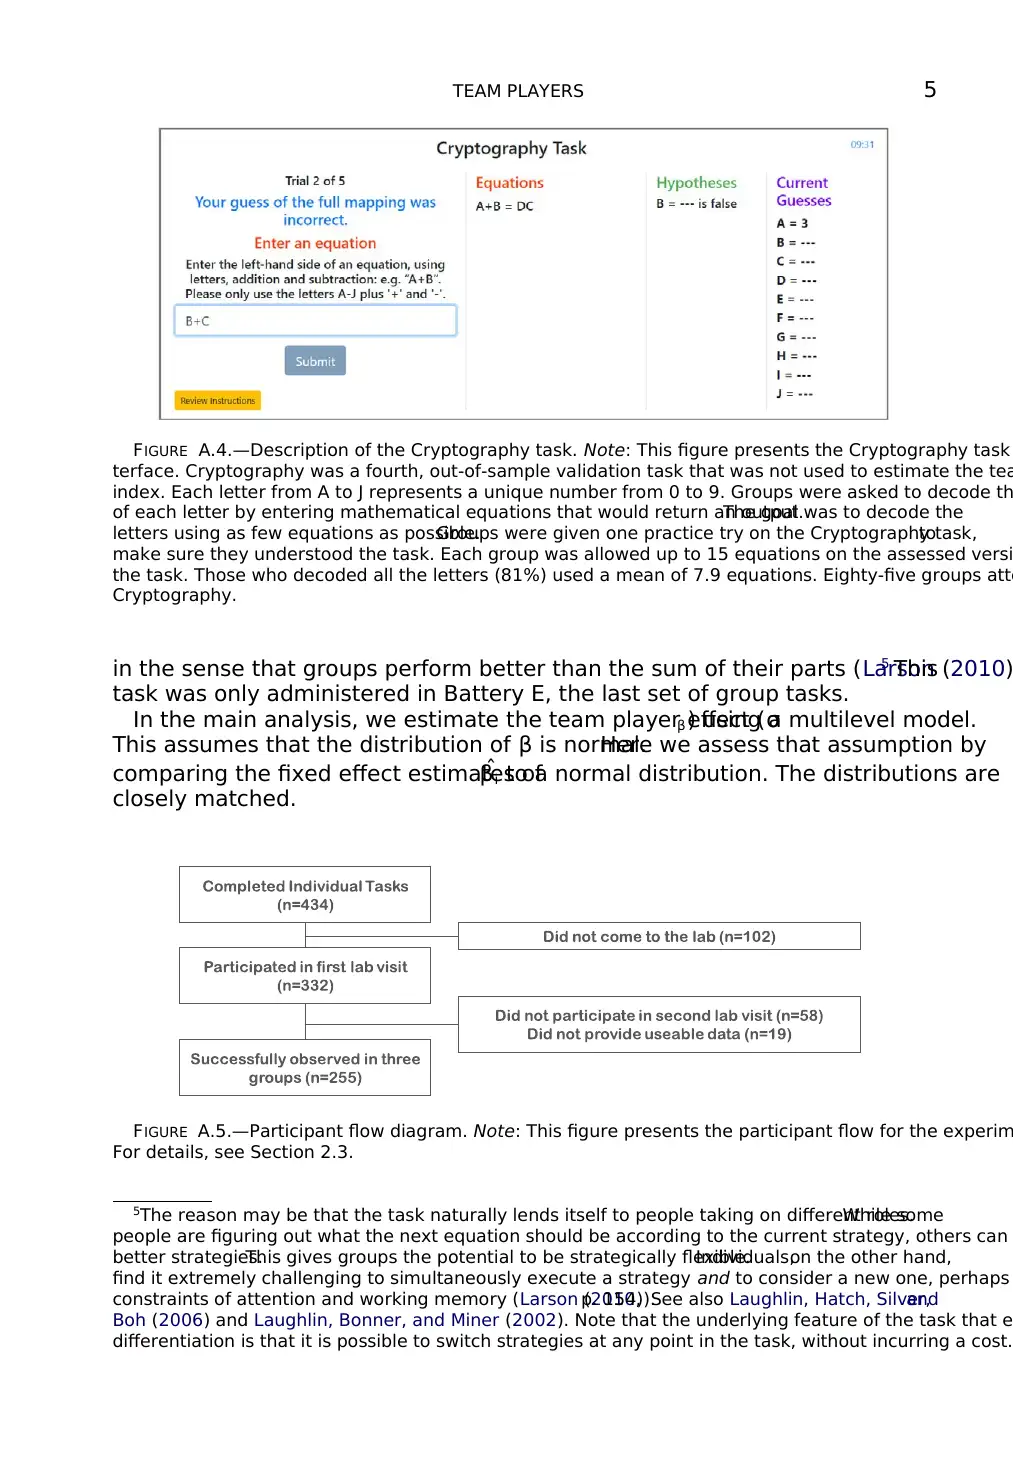
FIGURE A.4.—Description of the Cryptography task. Note: This figure presents the Cryptography task
terface. Cryptography was a fourth, out-of-sample validation task that was not used to estimate the tea
index. Each letter from A to J represents a unique number from 0 to 9. Groups were asked to decode th
of each letter by entering mathematical equations that would return an output.The goal was to decode the
letters using as few equations as possible.Groups were given one practice try on the Cryptography task,to
make sure they understood the task. Each group was allowed up to 15 equations on the assessed versi
the task. Those who decoded all the letters (81%) used a mean of 7.9 equations. Eighty-five groups atte
Cryptography.
in the sense that groups perform better than the sum of their parts (Larson (2010)5 This
task was only administered in Battery E, the last set of group tasks.
In the main analysis, we estimate the team player effect (σβ ) using a multilevel model.
This assumes that the distribution of β is normal.Here we assess that assumption by
comparing the fixed effect estimates ofˆβi to a normal distribution. The distributions are
closely matched.
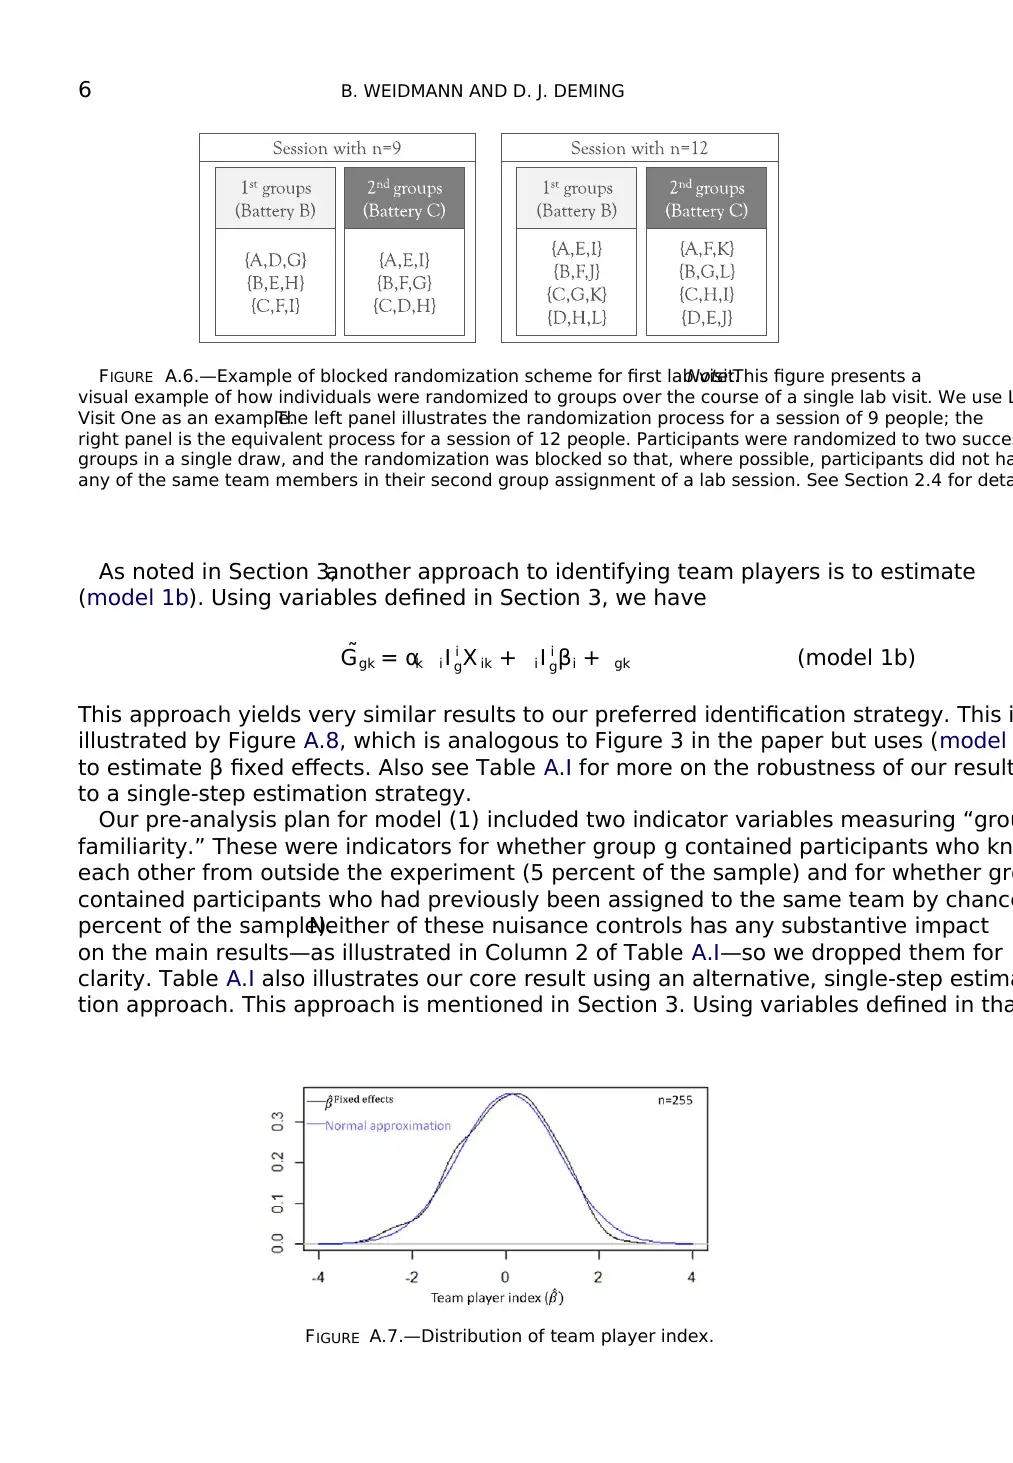
FIGURE A.5.—Participant flow diagram. Note: This figure presents the participant flow for the experim
For details, see Section 2.3.
5The reason may be that the task naturally lends itself to people taking on different roles.While some
people are figuring out what the next equation should be according to the current strategy, others can
better strategies.This gives groups the potential to be strategically flexible.Individuals,on the other hand,
find it extremely challenging to simultaneously execute a strategy and to consider a new one, perhaps
constraints of attention and working memory (Larson (2010,p. 154)).See also Laughlin, Hatch, Silver,and
Boh (2006) and Laughlin, Bonner, and Miner (2002). Note that the underlying feature of the task that e
differentiation is that it is possible to switch strategies at any point in the task, without incurring a cost.
FIGURE A.4.—Description of the Cryptography task. Note: This figure presents the Cryptography task
terface. Cryptography was a fourth, out-of-sample validation task that was not used to estimate the tea
index. Each letter from A to J represents a unique number from 0 to 9. Groups were asked to decode th
of each letter by entering mathematical equations that would return an output.The goal was to decode the
letters using as few equations as possible.Groups were given one practice try on the Cryptography task,to
make sure they understood the task. Each group was allowed up to 15 equations on the assessed versi
the task. Those who decoded all the letters (81%) used a mean of 7.9 equations. Eighty-five groups atte
Cryptography.
in the sense that groups perform better than the sum of their parts (Larson (2010)5 This
task was only administered in Battery E, the last set of group tasks.
In the main analysis, we estimate the team player effect (σβ ) using a multilevel model.
This assumes that the distribution of β is normal.Here we assess that assumption by
comparing the fixed effect estimates ofˆβi to a normal distribution. The distributions are
closely matched.
FIGURE A.5.—Participant flow diagram. Note: This figure presents the participant flow for the experim
For details, see Section 2.3.
5The reason may be that the task naturally lends itself to people taking on different roles.While some
people are figuring out what the next equation should be according to the current strategy, others can
better strategies.This gives groups the potential to be strategically flexible.Individuals,on the other hand,
find it extremely challenging to simultaneously execute a strategy and to consider a new one, perhaps
constraints of attention and working memory (Larson (2010,p. 154)).See also Laughlin, Hatch, Silver,and
Boh (2006) and Laughlin, Bonner, and Miner (2002). Note that the underlying feature of the task that e
differentiation is that it is possible to switch strategies at any point in the task, without incurring a cost.
6 B. WEIDMANN AND D. J. DEMING
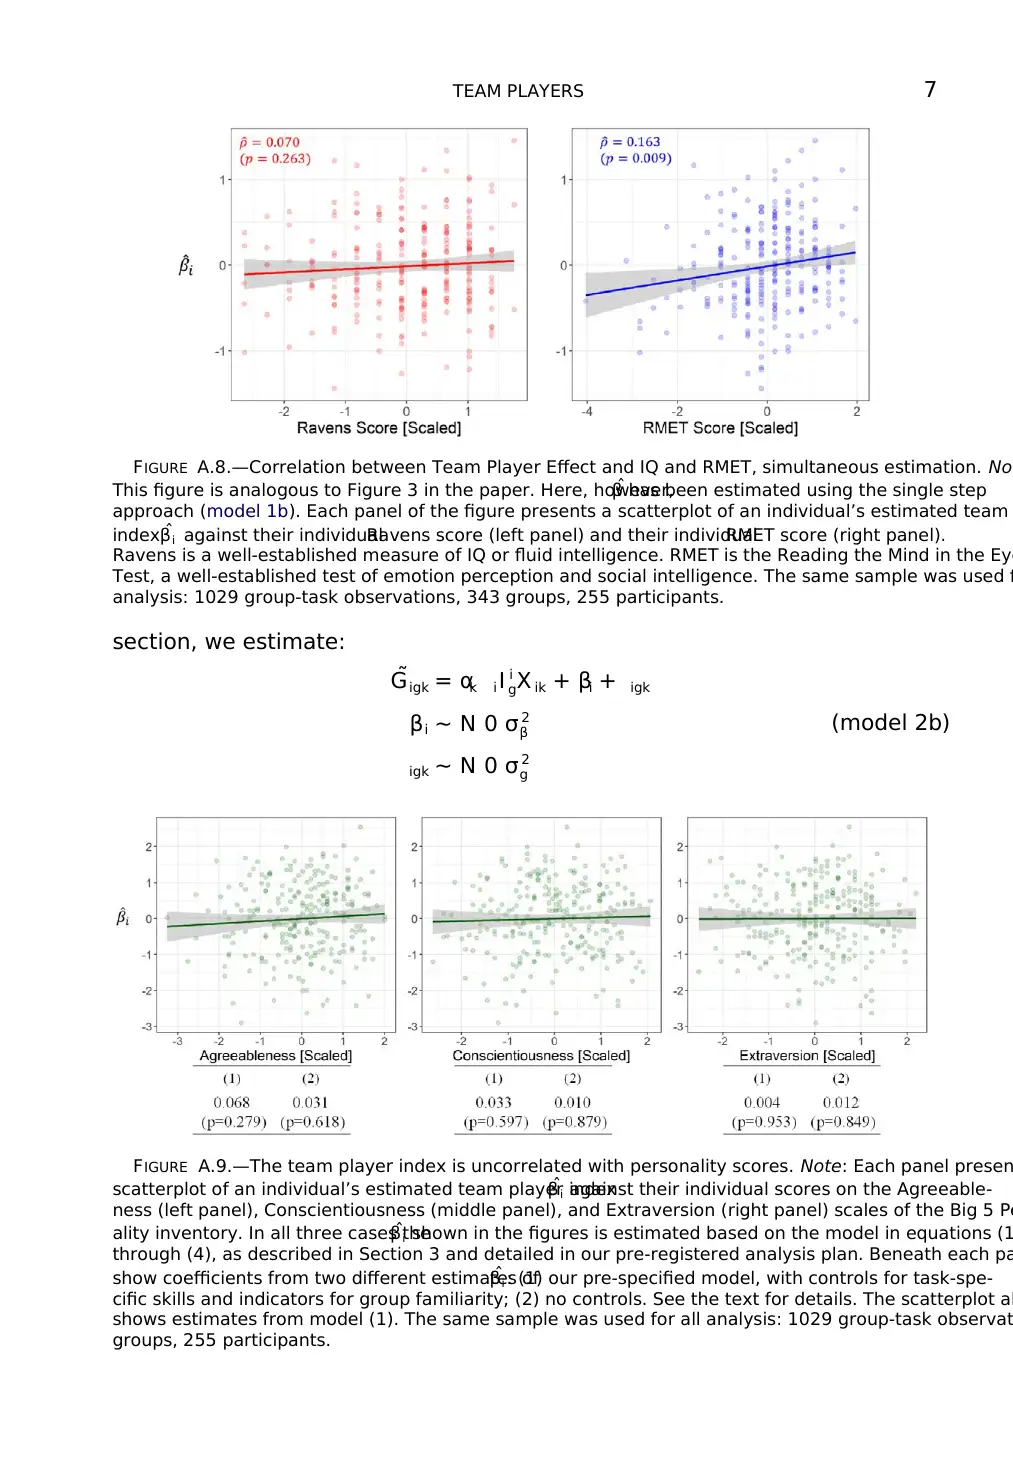
FIGURE A.6.—Example of blocked randomization scheme for first lab visit.Note:This figure presents a
visual example of how individuals were randomized to groups over the course of a single lab visit. We use L
Visit One as an example.The left panel illustrates the randomization process for a session of 9 people; the
right panel is the equivalent process for a session of 12 people. Participants were randomized to two succes
groups in a single draw, and the randomization was blocked so that, where possible, participants did not ha
any of the same team members in their second group assignment of a lab session. See Section 2.4 for deta
As noted in Section 3,another approach to identifying team players is to estimate
(model 1b). Using variables defined in Section 3, we have
˜Ggk = αk i I i
gX ik + i I i
gβi + gk (model 1b)
This approach yields very similar results to our preferred identification strategy. This i
illustrated by Figure A.8, which is analogous to Figure 3 in the paper but uses (model
to estimate β fixed effects. Also see Table A.I for more on the robustness of our result
to a single-step estimation strategy.
Our pre-analysis plan for model (1) included two indicator variables measuring “grou
familiarity.” These were indicators for whether group g contained participants who kn
each other from outside the experiment (5 percent of the sample) and for whether gro
contained participants who had previously been assigned to the same team by chance
percent of the sample).Neither of these nuisance controls has any substantive impact
on the main results—as illustrated in Column 2 of Table A.I—so we dropped them for
clarity. Table A.I also illustrates our core result using an alternative, single-step estima
tion approach. This approach is mentioned in Section 3. Using variables defined in tha
FIGURE A.7.—Distribution of team player index.
⊘ This is a preview!⊘
Do you want full access?
Subscribe today to unlock all pages.
Trusted by 1+ million students worldwide
TEAM PLAYERS 7
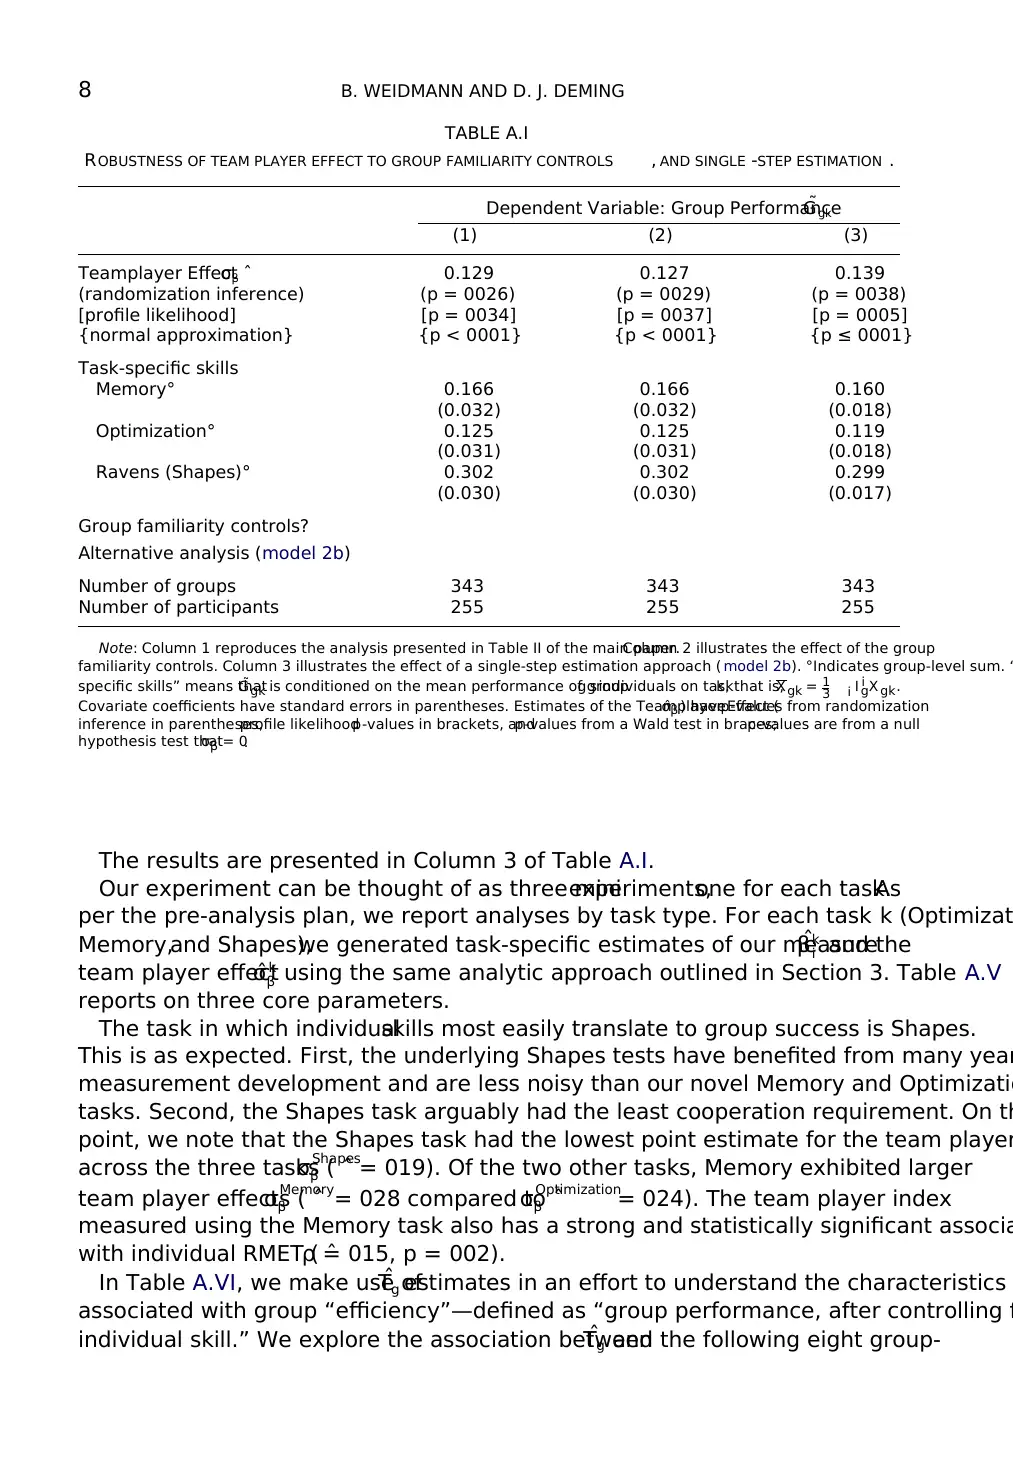
FIGURE A.8.—Correlation between Team Player Effect and IQ and RMET, simultaneous estimation. Not
This figure is analogous to Figure 3 in the paper. Here, however,ˆβ has been estimated using the single step
approach (model 1b). Each panel of the figure presents a scatterplot of an individual’s estimated team
index ˆβi against their individualRavens score (left panel) and their individualRMET score (right panel).
Ravens is a well-established measure of IQ or fluid intelligence. RMET is the Reading the Mind in the Eye
Test, a well-established test of emotion perception and social intelligence. The same sample was used f
analysis: 1029 group-task observations, 343 groups, 255 participants.
section, we estimate:
˜Gigk = αk i I i
gX ik + βi + igk
βi ∼ N 0 σ 2
β
igk ∼ N 0 σ 2
g
(model 2b)
FIGURE A.9.—The team player index is uncorrelated with personality scores. Note: Each panel presen
scatterplot of an individual’s estimated team player indexˆβi against their individual scores on the Agreeable-
ness (left panel), Conscientiousness (middle panel), and Extraversion (right panel) scales of the Big 5 Pe
ality inventory. In all three cases theˆβi shown in the figures is estimated based on the model in equations (1
through (4), as described in Section 3 and detailed in our pre-registered analysis plan. Beneath each pa
show coefficients from two different estimates ofˆβi : (1) our pre-specified model, with controls for task-spe-
cific skills and indicators for group familiarity; (2) no controls. See the text for details. The scatterplot al
shows estimates from model (1). The same sample was used for all analysis: 1029 group-task observat
groups, 255 participants.
Paraphrase This Document
Need a fresh take? Get an instant paraphrase of this document with our AI Paraphraser
8 B. WEIDMANN AND D. J. DEMING
TABLE A.I
ROBUSTNESS OF TEAM PLAYER EFFECT TO GROUP FAMILIARITY CONTROLS , AND SINGLE -STEP ESTIMATION .
Dependent Variable: Group Performance˜Ggk
(1) (2) (3)
Teamplayer Effect ˆσβ 0.129 0.127 0.139
(randomization inference) (p = 0026) (p = 0029) (p = 0038)
[profile likelihood] [p = 0034] [p = 0037] [p = 0005]
{normal approximation} {p < 0001} {p < 0001} {p ≤ 0001}
Task-specific skills
Memory° 0.166 0.166 0.160
(0.032) (0.032) (0.018)
Optimization° 0.125 0.125 0.119
(0.031) (0.031) (0.018)
Ravens (Shapes)° 0.302 0.302 0.299
(0.030) (0.030) (0.017)
Group familiarity controls?
Alternative analysis (model 2b)
Number of groups 343 343 343
Number of participants 255 255 255
Note: Column 1 reproduces the analysis presented in Table II of the main paper.Column 2 illustrates the effect of the group
familiarity controls. Column 3 illustrates the effect of a single-step estimation approach ( model 2b). °Indicates group-level sum. “
specific skills” means that˜Ggk is conditioned on the mean performance of groupg s individuals on taskk, that is,Xgk = 1
3 i I i
gX gk.
Covariate coefficients have standard errors in parentheses. Estimates of the Teamplayer Effect (ˆσβ ) havep-values from randomization
inference in parentheses,profile likelihoodp-values in brackets, andp-values from a Wald test in braces;p-values are from a null
hypothesis test thatσβ = 0.
The results are presented in Column 3 of Table A.I.
Our experiment can be thought of as three miniexperiments,one for each task.As
per the pre-analysis plan, we report analyses by task type. For each task k (Optimizat
Memory,and Shapes),we generated task-specific estimates of our measureˆβk
i and the
team player effectˆσk
β using the same analytic approach outlined in Section 3. Table A.V
reports on three core parameters.
The task in which individualskills most easily translate to group success is Shapes.
This is as expected. First, the underlying Shapes tests have benefited from many year
measurement development and are less noisy than our novel Memory and Optimizatio
tasks. Second, the Shapes task arguably had the least cooperation requirement. On th
point, we note that the Shapes task had the lowest point estimate for the team player
across the three tasks ( ˆσShapes
β = 019). Of the two other tasks, Memory exhibited larger
team player effects ( ˆσMemory
β = 028 compared to ˆσOptimization
β = 024). The team player index
measured using the Memory task also has a strong and statistically significant associa
with individual RMET ( ˆρ = 015, p = 002).
In Table A.VI, we make use ofˆTg estimates in an effort to understand the characteristics
associated with group “efficiency”—defined as “group performance, after controlling f
individual skill.” We explore the association betweenˆTg and the following eight group-
TEAM PLAYERS 9
TABLE A.II
TEAM PLAYER EFFECT WITH MANY FUNCTIONS OF INDIVIDUAL SKILL .
Dependent Variable: Group Performance˜Ggk
(1) (2) (3) (4) (5) (6) (7) (8) (9) (10)
Teamplayer Effect ˆσβ 0.129 0.202 0.155 0.131 0.129 0.209 0.184 0.211 0.204 0.120
(p = 0026) (p < 0001) (p = 0006) (p = 0023) (p = 0026) (p < 0001) (p < 0001) (p < 0001) (p < 0001) (p = 0044)
Task-specific skills
Sum ( X ki )
Max (maxg X ki )
Min (ming X ki )
All (X k1, Xk2, Xk3)
Flexible (fk ( X ki ))
Ravens
Max (maxg Ravensi )
Min (ming Ravensi )
RMET
Max (maxg RMET i )
Min (ming RMET i )
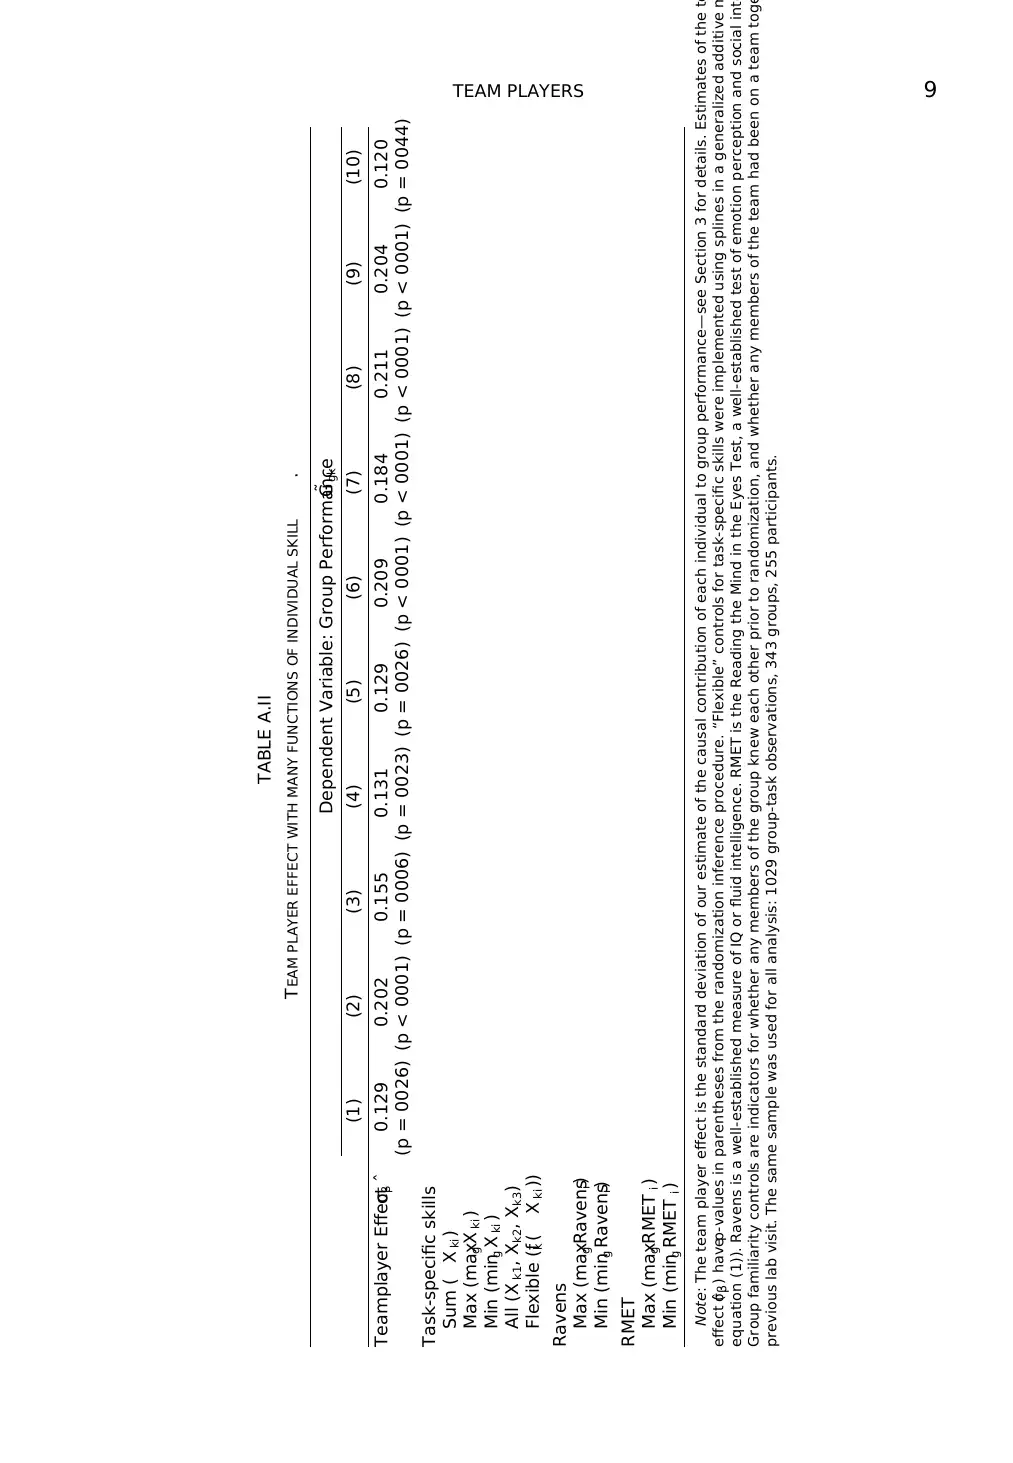
Note: The team player effect is the standard deviation of our estimate of the causal contribution of each individual to group performance—see Section 3 for details. Estimates of the te
effect (ˆσβ ) havep-values in parentheses from the randomization inference procedure. “Flexible” controls for task-specific skills were implemented using splines in a generalized additive m
equation (1)). Ravens is a well-established measure of IQ or fluid intelligence. RMET is the Reading the Mind in the Eyes Test, a well-established test of emotion perception and social inte
Group familiarity controls are indicators for whether any members of the group knew each other prior to randomization, and whether any members of the team had been on a team toge
previous lab visit. The same sample was used for all analysis: 1029 group-task observations, 343 groups, 255 participants.
TABLE A.II
TEAM PLAYER EFFECT WITH MANY FUNCTIONS OF INDIVIDUAL SKILL .
Dependent Variable: Group Performance˜Ggk
(1) (2) (3) (4) (5) (6) (7) (8) (9) (10)
Teamplayer Effect ˆσβ 0.129 0.202 0.155 0.131 0.129 0.209 0.184 0.211 0.204 0.120
(p = 0026) (p < 0001) (p = 0006) (p = 0023) (p = 0026) (p < 0001) (p < 0001) (p < 0001) (p < 0001) (p = 0044)
Task-specific skills
Sum ( X ki )
Max (maxg X ki )
Min (ming X ki )
All (X k1, Xk2, Xk3)
Flexible (fk ( X ki ))
Ravens
Max (maxg Ravensi )
Min (ming Ravensi )
RMET
Max (maxg RMET i )
Min (ming RMET i )
Note: The team player effect is the standard deviation of our estimate of the causal contribution of each individual to group performance—see Section 3 for details. Estimates of the te
effect (ˆσβ ) havep-values in parentheses from the randomization inference procedure. “Flexible” controls for task-specific skills were implemented using splines in a generalized additive m
equation (1)). Ravens is a well-established measure of IQ or fluid intelligence. RMET is the Reading the Mind in the Eyes Test, a well-established test of emotion perception and social inte
Group familiarity controls are indicators for whether any members of the group knew each other prior to randomization, and whether any members of the team had been on a team toge
previous lab visit. The same sample was used for all analysis: 1029 group-task observations, 343 groups, 255 participants.
⊘ This is a preview!⊘
Do you want full access?
Subscribe today to unlock all pages.
Trusted by 1+ million students worldwide
10 B. WEIDMANN AND D. J. DEMING
TABLE A.III
WHAT IS THE MOST PREDICTIVE MEASURE OF INDIVIDUAL SKILL ?
Dependent Variable: Group Performance on Shapes task˜Gg Shapes
Shapes ( i I i
gX ishapes) 0.302
(0.027)
Memory ( i I i
gX iMemory) 0.193 0.165
(0.032) (0.032)
Optimization ( i I i
gX iOpt ) 0.163 0.131
(0.032) (0.031)
Adj R2 0.262 0.092 0.070 0.134
Number of groups 343 343 343 343
Dependent Variable: Group Performance on Optimization task˜Gg Opt
Optimization ( i I i
gX iopt ) 0.125
(0.032)
Memory ( i I i
gX iMemory) 0.036 0.018
(0.034) (0.037)
Shapes ( i I i
gX ishapes) 0.051 0.045
(0.032) (0.035)
Adj R2 0.040 0.004 0.005 0.002
Number of groups 343 343 343 343
Dependent Variable: Group Performance on Memory task˜Gg Memory
Memory ( i I i
gX imemory) 0.166
(0.033)
Optimization ( i I i
gX iopt ) 0.096 0.042
(0.032) (0.036)
Shapes ( i I i
gX ishapes) 0.130 0.111
(0.031) (0.035)
Adj R2 0.067 0.023 0.046 0.047
Number of groups 343 343 343 343
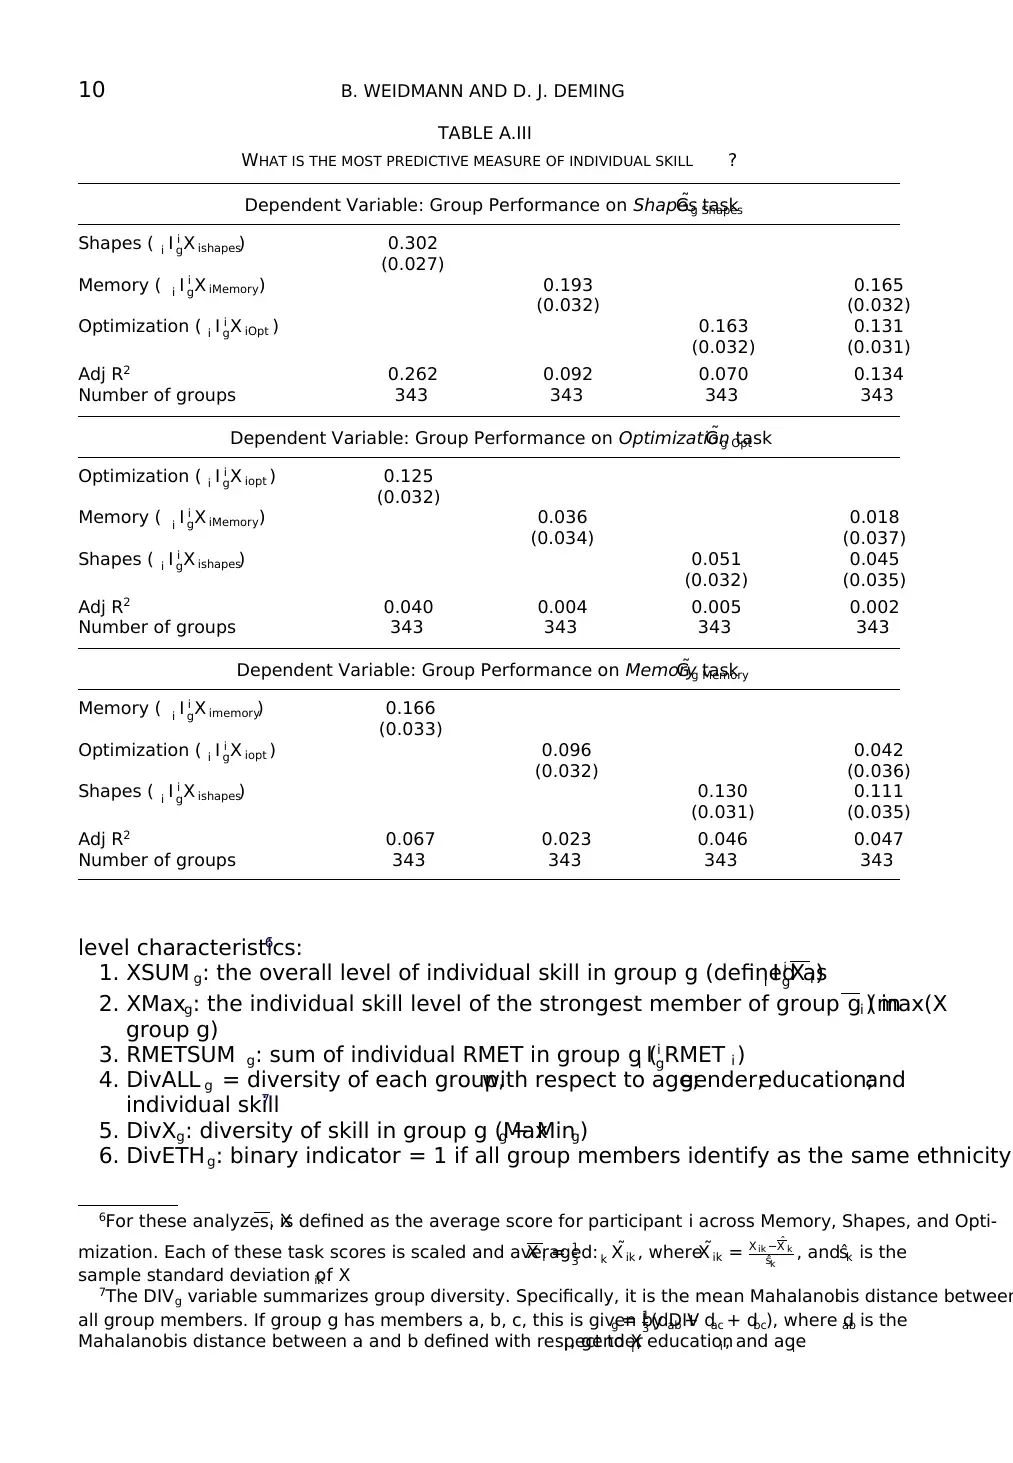
level characteristics:6
1. XSUM g: the overall level of individual skill in group g (defined asi I i
gX i )
2. XMaxg: the individual skill level of the strongest member of group g (max(Xi ) in
group g)
3. RMETSUM g: sum of individual RMET in group g (i I i
gRMET i )
4. DivALL g = diversity of each group,with respect to age;gender;education;and
individual skill7
5. DivXg: diversity of skill in group g (Maxg − Ming)
6. DivETHg: binary indicator = 1 if all group members identify as the same ethnicity
6For these analyzes, Xi is defined as the average score for participant i across Memory, Shapes, and Opti-
mization. Each of these task scores is scaled and averaged:X i = 1
3 k ˜X ik , where˜X ik = X ik − ˆX k
ˆsk , andˆsk is the
sample standard deviation of Xik .
7The DIVg variable summarizes group diversity. Specifically, it is the mean Mahalanobis distance between
all group members. If group g has members a, b, c, this is given by DIVg = 1
3 (dab + dac + dbc), where dab is the
Mahalanobis distance between a and b defined with respect to Xi , genderi , educationi , and agei .
TABLE A.III
WHAT IS THE MOST PREDICTIVE MEASURE OF INDIVIDUAL SKILL ?
Dependent Variable: Group Performance on Shapes task˜Gg Shapes
Shapes ( i I i
gX ishapes) 0.302
(0.027)
Memory ( i I i
gX iMemory) 0.193 0.165
(0.032) (0.032)
Optimization ( i I i
gX iOpt ) 0.163 0.131
(0.032) (0.031)
Adj R2 0.262 0.092 0.070 0.134
Number of groups 343 343 343 343
Dependent Variable: Group Performance on Optimization task˜Gg Opt
Optimization ( i I i
gX iopt ) 0.125
(0.032)
Memory ( i I i
gX iMemory) 0.036 0.018
(0.034) (0.037)
Shapes ( i I i
gX ishapes) 0.051 0.045
(0.032) (0.035)
Adj R2 0.040 0.004 0.005 0.002
Number of groups 343 343 343 343
Dependent Variable: Group Performance on Memory task˜Gg Memory
Memory ( i I i
gX imemory) 0.166
(0.033)
Optimization ( i I i
gX iopt ) 0.096 0.042
(0.032) (0.036)
Shapes ( i I i
gX ishapes) 0.130 0.111
(0.031) (0.035)
Adj R2 0.067 0.023 0.046 0.047
Number of groups 343 343 343 343
level characteristics:6
1. XSUM g: the overall level of individual skill in group g (defined asi I i
gX i )
2. XMaxg: the individual skill level of the strongest member of group g (max(Xi ) in
group g)
3. RMETSUM g: sum of individual RMET in group g (i I i
gRMET i )
4. DivALL g = diversity of each group,with respect to age;gender;education;and
individual skill7
5. DivXg: diversity of skill in group g (Maxg − Ming)
6. DivETHg: binary indicator = 1 if all group members identify as the same ethnicity
6For these analyzes, Xi is defined as the average score for participant i across Memory, Shapes, and Opti-
mization. Each of these task scores is scaled and averaged:X i = 1
3 k ˜X ik , where˜X ik = X ik − ˆX k
ˆsk , andˆsk is the
sample standard deviation of Xik .
7The DIVg variable summarizes group diversity. Specifically, it is the mean Mahalanobis distance between
all group members. If group g has members a, b, c, this is given by DIVg = 1
3 (dab + dac + dbc), where dab is the
Mahalanobis distance between a and b defined with respect to Xi , genderi , educationi , and agei .
Paraphrase This Document
Need a fresh take? Get an instant paraphrase of this document with our AI Paraphraser
TEAM PLAYERS 11
TABLE A.IV
EXPLORING MEASUREMENT ERROR WITH SIMULATION .
Level of
Measurement Error
ˆσβ ˆρ ˆβRMET
Estimated Teamplayer Effect Correlation Betweenˆβi and RMETi
c = 0 0.107 0.111
(p = 0087) (p = 0074)
c = 025 0.114 0.121
(p = 0072) (p = 0057)
c = 050 0.131 0.141
(p = 0038) (p = 0029)
c = 075 0.152 0.169
(p = 0015) (p = 0011)
Original Results
(for comparison)
0.129 0.156
(p = 0026) (p = 0012)
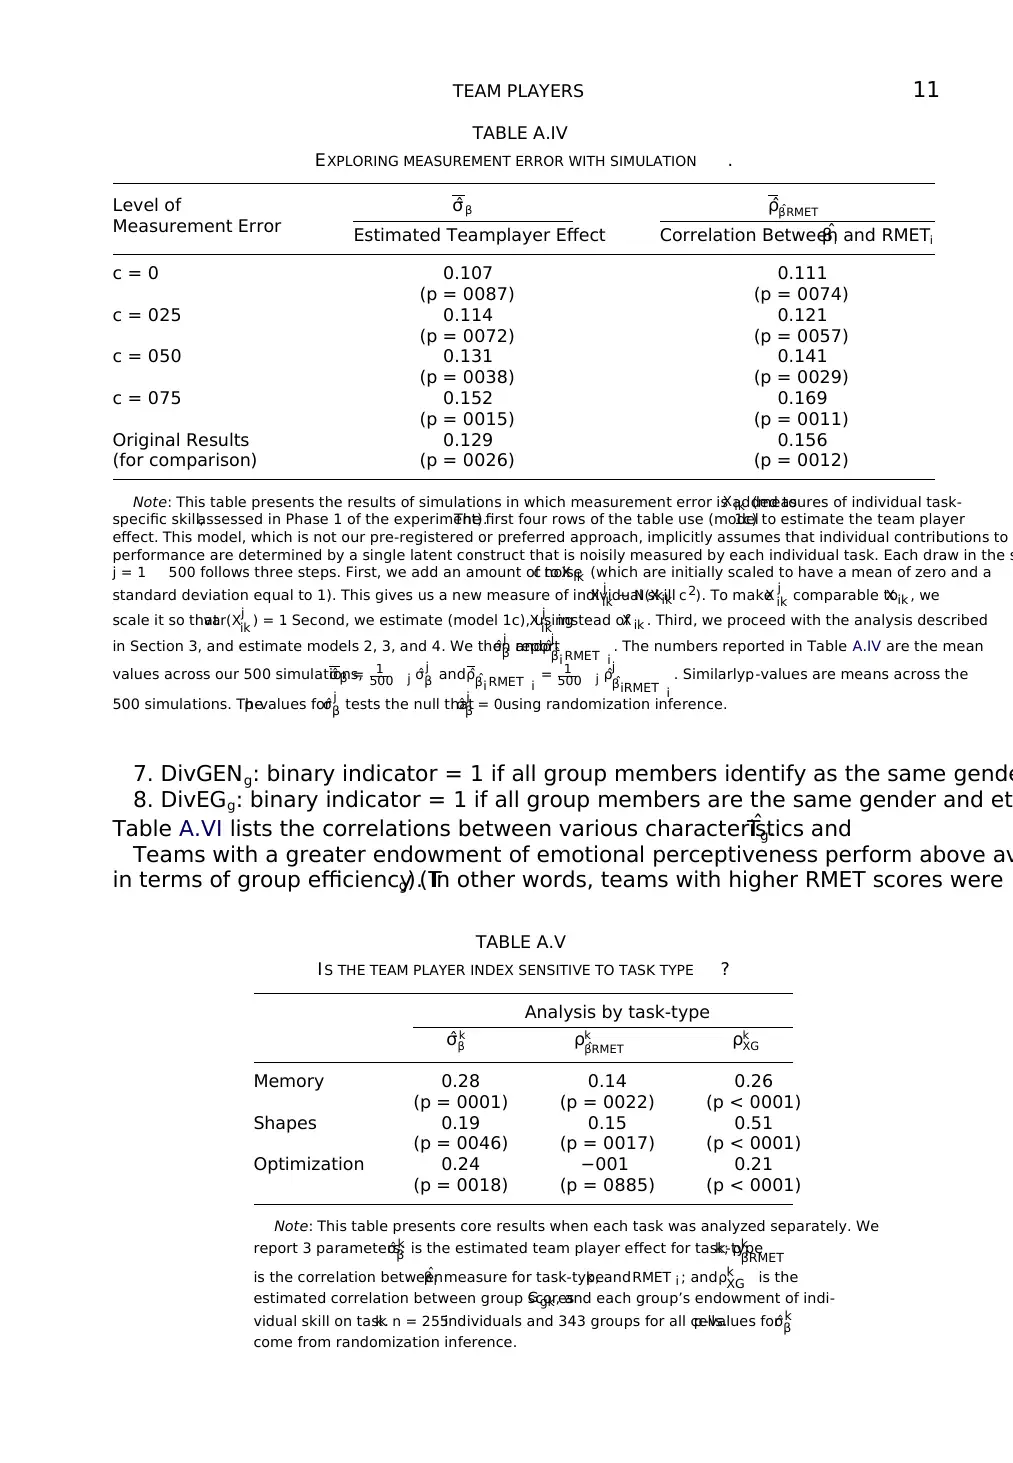
Note: This table presents the results of simulations in which measurement error is added toX ik (measures of individual task-
specific skill,assessed in Phase 1 of the experiment).The first four rows of the table use (model1c) to estimate the team player
effect. This model, which is not our pre-registered or preferred approach, implicitly assumes that individual contributions to
performance are determined by a single latent construct that is noisily measured by each individual task. Each draw in the s
j = 1 500 follows three steps. First, we add an amount of noisec to X ik (which are initially scaled to have a mean of zero and a
standard deviation equal to 1). This gives us a new measure of individual skillX j
ik ∼ N(X ik c 2). To makeX j
ik comparable toX ik , we
scale it so thatvar(Xj
ik ) = 1. Second, we estimate (model 1c), usingX j
ik instead ofX ik . Third, we proceed with the analysis described
in Section 3, and estimate models 2, 3, and 4. We then reportˆσj
β and ˆρj
ˆβi RMET i
. The numbers reported in Table A.IV are the mean
values across our 500 simulations,ˆσβ = 1
500 j ˆσj
β and ˆρ ˆβi RMET i = 1
500 j ˆρj
ˆβiRMET i
. Similarly,p-values are means across the
500 simulations. Thep-values forˆσj
β tests the null thatˆσj
β = 0using randomization inference.
7. DivGENg: binary indicator = 1 if all group members identify as the same gende
8. DivEGg: binary indicator = 1 if all group members are the same gender and et
Table A.VI lists the correlations between various characteristics andˆTg.
Teams with a greater endowment of emotional perceptiveness perform above av
in terms of group efficiency (Tg). In other words, teams with higher RMET scores were
TABLE A.V
IS THE TEAM PLAYER INDEX SENSITIVE TO TASK TYPE ?
Analysis by task-type
ˆσk
β ρk
ˆβRMET ρk
XG
Memory 0.28 0.14 0.26
(p = 0001) (p = 0022) (p < 0001)
Shapes 0.19 0.15 0.51
(p = 0046) (p = 0017) (p < 0001)
Optimization 0.24 −001 0.21
(p = 0018) (p = 0885) (p < 0001)
Note: This table presents core results when each task was analyzed separately. We
report 3 parameters:ˆσk
β is the estimated team player effect for task-typek; ρk
ˆβRMET
is the correlation betweenˆβi measure for task-typek, andRMET i ; andρk
XG is the
estimated correlation between group scoresGgk, and each group’s endowment of indi-
vidual skill on taskk. n = 255individuals and 343 groups for all cells.p-values forˆσk
β
come from randomization inference.
TABLE A.IV
EXPLORING MEASUREMENT ERROR WITH SIMULATION .
Level of
Measurement Error
ˆσβ ˆρ ˆβRMET
Estimated Teamplayer Effect Correlation Betweenˆβi and RMETi
c = 0 0.107 0.111
(p = 0087) (p = 0074)
c = 025 0.114 0.121
(p = 0072) (p = 0057)
c = 050 0.131 0.141
(p = 0038) (p = 0029)
c = 075 0.152 0.169
(p = 0015) (p = 0011)
Original Results
(for comparison)
0.129 0.156
(p = 0026) (p = 0012)
Note: This table presents the results of simulations in which measurement error is added toX ik (measures of individual task-
specific skill,assessed in Phase 1 of the experiment).The first four rows of the table use (model1c) to estimate the team player
effect. This model, which is not our pre-registered or preferred approach, implicitly assumes that individual contributions to
performance are determined by a single latent construct that is noisily measured by each individual task. Each draw in the s
j = 1 500 follows three steps. First, we add an amount of noisec to X ik (which are initially scaled to have a mean of zero and a
standard deviation equal to 1). This gives us a new measure of individual skillX j
ik ∼ N(X ik c 2). To makeX j
ik comparable toX ik , we
scale it so thatvar(Xj
ik ) = 1. Second, we estimate (model 1c), usingX j
ik instead ofX ik . Third, we proceed with the analysis described
in Section 3, and estimate models 2, 3, and 4. We then reportˆσj
β and ˆρj
ˆβi RMET i
. The numbers reported in Table A.IV are the mean
values across our 500 simulations,ˆσβ = 1
500 j ˆσj
β and ˆρ ˆβi RMET i = 1
500 j ˆρj
ˆβiRMET i
. Similarly,p-values are means across the
500 simulations. Thep-values forˆσj
β tests the null thatˆσj
β = 0using randomization inference.
7. DivGENg: binary indicator = 1 if all group members identify as the same gende
8. DivEGg: binary indicator = 1 if all group members are the same gender and et
Table A.VI lists the correlations between various characteristics andˆTg.
Teams with a greater endowment of emotional perceptiveness perform above av
in terms of group efficiency (Tg). In other words, teams with higher RMET scores were
TABLE A.V
IS THE TEAM PLAYER INDEX SENSITIVE TO TASK TYPE ?
Analysis by task-type
ˆσk
β ρk
ˆβRMET ρk
XG
Memory 0.28 0.14 0.26
(p = 0001) (p = 0022) (p < 0001)
Shapes 0.19 0.15 0.51
(p = 0046) (p = 0017) (p < 0001)
Optimization 0.24 −001 0.21
(p = 0018) (p = 0885) (p < 0001)
Note: This table presents core results when each task was analyzed separately. We
report 3 parameters:ˆσk
β is the estimated team player effect for task-typek; ρk
ˆβRMET
is the correlation betweenˆβi measure for task-typek, andRMET i ; andρk
XG is the
estimated correlation between group scoresGgk, and each group’s endowment of indi-
vidual skill on taskk. n = 255individuals and 343 groups for all cells.p-values forˆσk
β
come from randomization inference.
12 B. WEIDMANN AND D. J. DEMING
TABLE A.VI
WHAT ARE THE CHARACTERISTICS OF TEAMS THAT ARE “MORE THAN THE SUM OF
THEIR PARTS ”?
Correlation WithˆTg p-Value Number of Groups
Group skills variable
1. Xsum 0074 0.169 343
2. Xmax 0006 0.913 343
3. RMETsum 0174 0.001 343
Group diversity variable
4. DivALL −0017 0.756 342
5. DivX −0056 0.299 343
6. DivETH 0033 0.541 341
7. DivGEN −0005 0.933 332
8. DivEG −0039 0.470 332
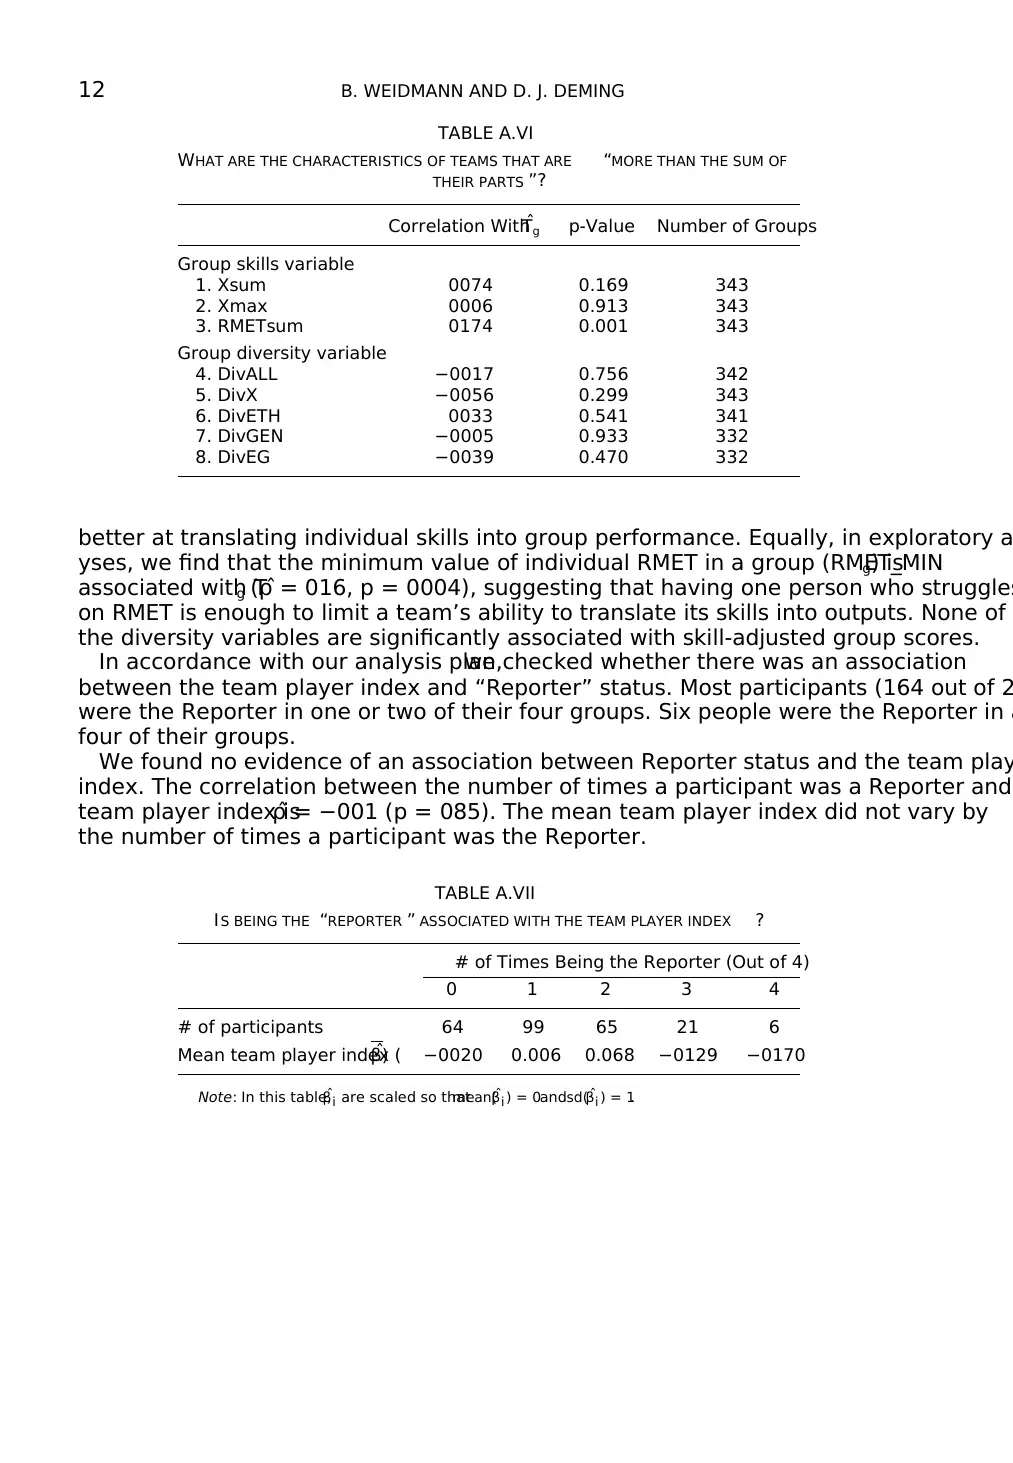
better at translating individual skills into group performance. Equally, in exploratory a
yses, we find that the minimum value of individual RMET in a group (RMET_MINg) is
associated with Tg ( ˆρ = 016, p = 0004), suggesting that having one person who struggles
on RMET is enough to limit a team’s ability to translate its skills into outputs. None of
the diversity variables are significantly associated with skill-adjusted group scores.
In accordance with our analysis plan,we checked whether there was an association
between the team player index and “Reporter” status. Most participants (164 out of 2
were the Reporter in one or two of their four groups. Six people were the Reporter in a
four of their groups.
We found no evidence of an association between Reporter status and the team play
index. The correlation between the number of times a participant was a Reporter and
team player index isˆρ = −001 (p = 085). The mean team player index did not vary by
the number of times a participant was the Reporter.
TABLE A.VII
IS BEING THE “REPORTER ” ASSOCIATED WITH THE TEAM PLAYER INDEX ?
# of Times Being the Reporter (Out of 4)
0 1 2 3 4
# of participants 64 99 65 21 6
Mean team player index (ˆβ) −0020 0.006 0.068 −0129 −0170
Note: In this table,ˆβi are scaled so thatmean(ˆβi ) = 0andsd(ˆβi ) = 1.
TABLE A.VI
WHAT ARE THE CHARACTERISTICS OF TEAMS THAT ARE “MORE THAN THE SUM OF
THEIR PARTS ”?
Correlation WithˆTg p-Value Number of Groups
Group skills variable
1. Xsum 0074 0.169 343
2. Xmax 0006 0.913 343
3. RMETsum 0174 0.001 343
Group diversity variable
4. DivALL −0017 0.756 342
5. DivX −0056 0.299 343
6. DivETH 0033 0.541 341
7. DivGEN −0005 0.933 332
8. DivEG −0039 0.470 332
better at translating individual skills into group performance. Equally, in exploratory a
yses, we find that the minimum value of individual RMET in a group (RMET_MINg) is
associated with Tg ( ˆρ = 016, p = 0004), suggesting that having one person who struggles
on RMET is enough to limit a team’s ability to translate its skills into outputs. None of
the diversity variables are significantly associated with skill-adjusted group scores.
In accordance with our analysis plan,we checked whether there was an association
between the team player index and “Reporter” status. Most participants (164 out of 2
were the Reporter in one or two of their four groups. Six people were the Reporter in a
four of their groups.
We found no evidence of an association between Reporter status and the team play
index. The correlation between the number of times a participant was a Reporter and
team player index isˆρ = −001 (p = 085). The mean team player index did not vary by
the number of times a participant was the Reporter.
TABLE A.VII
IS BEING THE “REPORTER ” ASSOCIATED WITH THE TEAM PLAYER INDEX ?
# of Times Being the Reporter (Out of 4)
0 1 2 3 4
# of participants 64 99 65 21 6
Mean team player index (ˆβ) −0020 0.006 0.068 −0129 −0170
Note: In this table,ˆβi are scaled so thatmean(ˆβi ) = 0andsd(ˆβi ) = 1.
⊘ This is a preview!⊘
Do you want full access?
Subscribe today to unlock all pages.
Trusted by 1+ million students worldwide
1 out of 15
Your All-in-One AI-Powered Toolkit for Academic Success.
+13062052269
info@desklib.com
Available 24*7 on WhatsApp / Email
![[object Object]](/_next/static/media/star-bottom.7253800d.svg)
Unlock your academic potential
Copyright © 2020–2026 A2Z Services. All Rights Reserved. Developed and managed by ZUCOL.