700159 Assessment 1: Socio-Economic Differences in Sydney Suburbs
VerifiedAdded on 2022/09/23
|10
|3172
|36
Report
AI Summary
This report analyzes socio-economic differences between the Sydney suburbs of Double Bay and Fairfield, focusing on concepts like socio-spatial polarization, globalisation, and the shift from manufacturing to services. It uses 2016 ABS QuickStats data to compare the suburbs across several key indicators, including language spoken at home, birthplace of parents, country of birth, and occupation. The report explains the main reasons for the observed socio-economic disparities, referencing academic sources and unit readings. The analysis highlights how globalisation and the economic shift have contributed to the differences between the two suburbs. The report also includes a detailed appendix with ABS QuickStat Suburb Comparison Tables, 2016 Census.
PEOPLE, PLACE AND SOCIAL DIFFERENCE (700159)
ASSESSMENT 1 TEMPLATE
This assignment is made up of three (3) parts, plus a reference list and appendix. Marks are allocated
for each section, as follows:
Part I: Identify the suburb and locality for two suburbs for comparison
Locality – 2 marks
Part II: Description of socio-economic differences (250 words) – 4 marks
Part III: Explanation of reasons for socio-economic differences (500 words) – 10
marks
Reference list: A list of the academic sources cited in Part 3 – 2 marks
Appendix: ABS QuickStats Suburb Comparison Tables, 2016 Census – 2 marks
Week 3: Computer lab tutorial: Complete Appendix, Part I and Part II. Submit before the end of the
tutorial.
Week 6: Complete and submit Part III.
PART 1: Identify the suburb and region you live in and your comparison suburb and locality (2
marks in total; half a mark for each of the four questions below)
Choose two suburbs in the Sydney region for comparison. Ensure that each suburb belongs to a
different locality of Sydney region (according to Baum 2005, Chapter 3, Figure 3.1 “Typology of
advantaged and disadvantaged localities in Australia’s metropolitan regions”).
1. What is the name of the first suburb?
2. Using Baum, O’Connor and Stimson, what locality is the suburb in?
For example: ‘Battler locality’
3. What is the name of your comparison Suburb?
Your comparison suburb MUST be located in a different region to the region the suburb
you selected above. For example, if you chose Penrith (in Outer Western Sydney), you
might choose to compare it to Manly (in Northern Sydney). You cannot choose Mount
Druitt, which is another suburb located in Outer Western Sydney.
4. Using Baum, O’Conner and Stimson, what locality is your comparison suburb in?
For example: ‘Battler locality’
PART II: DESCRIPTION OF SOCIO-ECONOMIC DIFFERENCES (250 words – 4 marks in total; 1
mark for each of the four questions below)
5. Describe four (4) of the main socio-economic differences between the suburb you live in
and your comparison suburb.
1
Double Bay
Batting family mortgage stress disadvantage localities.
New economy extremely advantage localities.
Fairfield
Working class batter disadvantaged localities.
Gentrifying population change advantage localities.
Paraphrase This Document
Need a fresh take? Get an instant paraphrase of this document with our AI Paraphraser
To answer this question, you will need to complete the ‘ABS QuickStat Comparison Tables’
located in the Appendix of this template.
Instructions on how to complete these tables are located before the tables in the Appendix.
We will also cover the skills needed to complete these tables in the Week 3 Workshop.
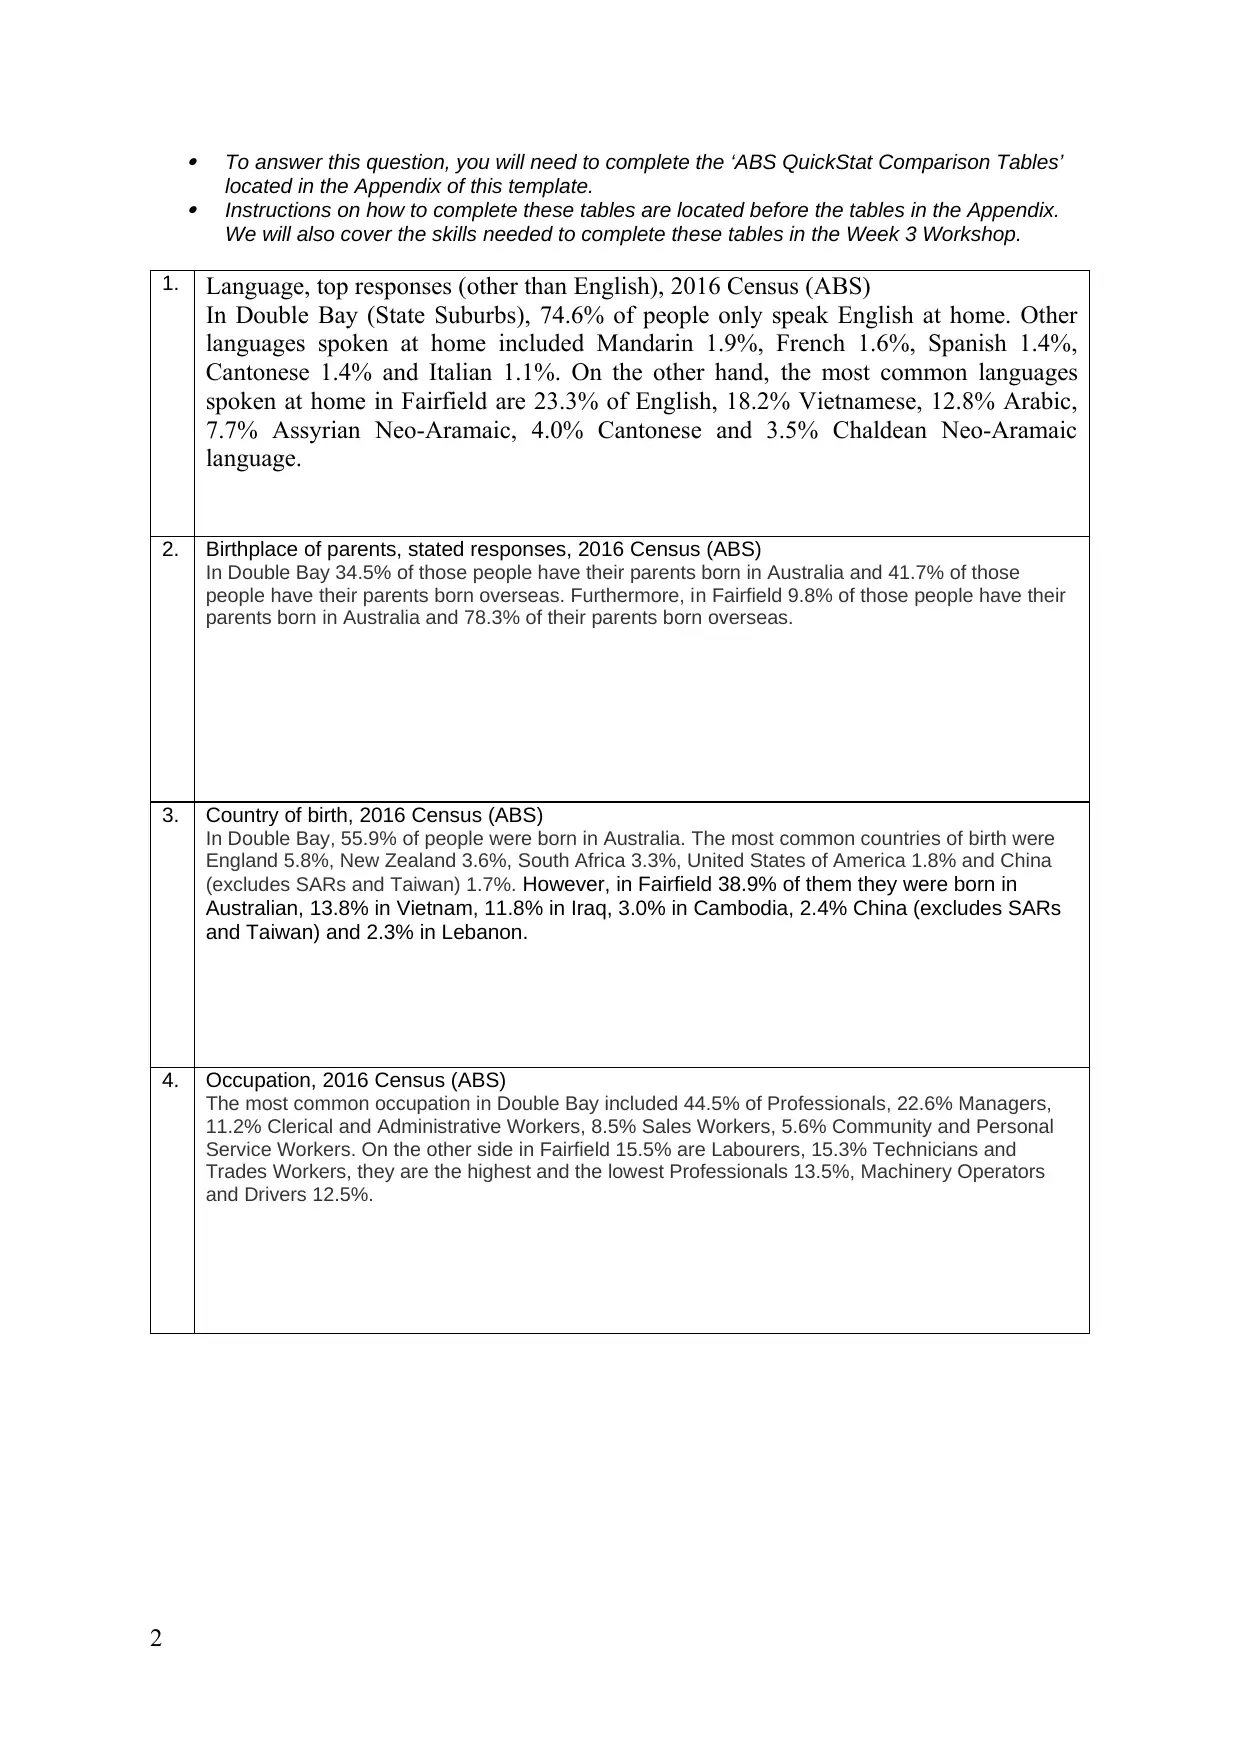
1. Language, top responses (other than English), 2016 Census (ABS)
In Double Bay (State Suburbs), 74.6% of people only speak English at home. Other
languages spoken at home included Mandarin 1.9%, French 1.6%, Spanish 1.4%,
Cantonese 1.4% and Italian 1.1%. On the other hand, the most common languages
spoken at home in Fairfield are 23.3% of English, 18.2% Vietnamese, 12.8% Arabic,
7.7% Assyrian Neo-Aramaic, 4.0% Cantonese and 3.5% Chaldean Neo-Aramaic
language.
2. Birthplace of parents, stated responses, 2016 Census (ABS)
In Double Bay 34.5% of those people have their parents born in Australia and 41.7% of those
people have their parents born overseas. Furthermore, in Fairfield 9.8% of those people have their
parents born in Australia and 78.3% of their parents born overseas.
3. Country of birth, 2016 Census (ABS)
In Double Bay, 55.9% of people were born in Australia. The most common countries of birth were
England 5.8%, New Zealand 3.6%, South Africa 3.3%, United States of America 1.8% and China
(excludes SARs and Taiwan) 1.7%. However, in Fairfield 38.9% of them they were born in
Australian, 13.8% in Vietnam, 11.8% in Iraq, 3.0% in Cambodia, 2.4% China (excludes SARs
and Taiwan) and 2.3% in Lebanon.
4. Occupation, 2016 Census (ABS)
The most common occupation in Double Bay included 44.5% of Professionals, 22.6% Managers,
11.2% Clerical and Administrative Workers, 8.5% Sales Workers, 5.6% Community and Personal
Service Workers. On the other side in Fairfield 15.5% are Labourers, 15.3% Technicians and
Trades Workers, they are the highest and the lowest Professionals 13.5%, Machinery Operators
and Drivers 12.5%.
2
located in the Appendix of this template.
Instructions on how to complete these tables are located before the tables in the Appendix.
We will also cover the skills needed to complete these tables in the Week 3 Workshop.
1. Language, top responses (other than English), 2016 Census (ABS)
In Double Bay (State Suburbs), 74.6% of people only speak English at home. Other
languages spoken at home included Mandarin 1.9%, French 1.6%, Spanish 1.4%,
Cantonese 1.4% and Italian 1.1%. On the other hand, the most common languages
spoken at home in Fairfield are 23.3% of English, 18.2% Vietnamese, 12.8% Arabic,
7.7% Assyrian Neo-Aramaic, 4.0% Cantonese and 3.5% Chaldean Neo-Aramaic
language.
2. Birthplace of parents, stated responses, 2016 Census (ABS)
In Double Bay 34.5% of those people have their parents born in Australia and 41.7% of those
people have their parents born overseas. Furthermore, in Fairfield 9.8% of those people have their
parents born in Australia and 78.3% of their parents born overseas.
3. Country of birth, 2016 Census (ABS)
In Double Bay, 55.9% of people were born in Australia. The most common countries of birth were
England 5.8%, New Zealand 3.6%, South Africa 3.3%, United States of America 1.8% and China
(excludes SARs and Taiwan) 1.7%. However, in Fairfield 38.9% of them they were born in
Australian, 13.8% in Vietnam, 11.8% in Iraq, 3.0% in Cambodia, 2.4% China (excludes SARs
and Taiwan) and 2.3% in Lebanon.
4. Occupation, 2016 Census (ABS)
The most common occupation in Double Bay included 44.5% of Professionals, 22.6% Managers,
11.2% Clerical and Administrative Workers, 8.5% Sales Workers, 5.6% Community and Personal
Service Workers. On the other side in Fairfield 15.5% are Labourers, 15.3% Technicians and
Trades Workers, they are the highest and the lowest Professionals 13.5%, Machinery Operators
and Drivers 12.5%.
2
PART III: EXPLANATION OF REASONS FOR SOCIO-ECONOMIC DIFFERENCES (500 words - 10
marks)
6. Using the assignment 1 AND weekly lecture readings, explain what socio-spatial
polarisation is and use the statistical data from the Appendix to explain some of the MAIN
reasons for the socio-economic differences between your chosen suburbs.
‒ You MUST reference at least 2 of the academic sources (journal articles, book chapters or
books) provided in the Assignment 1 reading list (available on vUWS) OR as weekly
readings.
‒ You can refer to the lectures in this unit (only for Assignment 1) however, this must be in
addition to the two academic sources outlined above.
‒ You need to use concepts covered in the unit, such as: socio-spatial polarisation, the Global
Economic Corridor (Arc), the five faces of oppressions, globalisation, and the shift in the
economy away from manufacturing to services.
‒ This section MUST NOT be based upon personal opinion. Please ensure that you provide in-
text citations using Western Sydney University’s Harvard Referencing Style
(http://library.westernsydney.edu.au/main/sites/default/files/cite_Harvard.pdf). Refer to the
materials from the Week 5 Workshop for assistance with referencing.
Type your response below this line
The socio-economic differences of the two places can be examined by the concepts of social-
spatial polarisation, globalisation and the shift of economy from the manufacturing to
services. The two localities into consideration are Double Bay and Fairfield. One can easily
stress the Social-spatial polarisation of the two neighbouring locality. This means there is a
growing gap between the riches and the poor in context of their economy and social status
(Randolph and Tice 2017). In the Double Bay the economic growth and the richer
community lives as the most of the people in this place are literate and work in the services
sectors. They are well employed and some of them also have their own business. On the other
hand, the people of Fairfield possess jobs of labourer in most numbers. They are the one who
work for the companies and factories as the part of manufacturing team. Therefore, the
economic gaps are created. This gaps also influences the social contexts of these people
living in their respective places.
Globalisation is connected with the migration for work and therefore this also contributes in
the socio-economic gaps of these two places. The ABS statistics states that 55.9% of the total
population of Double Bay were born in Australia, whereas, only 38.9% of the population of
Fairfield were actually born in Australia. The people who have migrated to other countries
usually face more challenges in their occupations and social status (Frieden 2018). They were
not been able to establish their lives in a new environment. They have to work as the
labourers in the Double Bay or other places to earn their ends meet. Therefore, this part of the
Australia is weak socially and economically and the influence of globalisation cannot be
dismissed in this condition. Globalisation has reduced the barriers between countries and
states. Hence migration for work and other stuffs has increased. The migrated populations are
experiencing a gap between the native people and them. The natives has exposure to the
resources than the migrants. The increased number of migrants in the Fairfield is the reason
of the socio-economic difference with Double Bay.
The gradual shift of economy from the manufacturing sectors to the services is another reason
of the socio-economic differences. The shift to the service sector has reduced the work scope
for the manufacturers and labours. People in Fairfield has lower educational qualifications
and most of them are depended on the labourer occupation in manufacturing industries.
Therefore, their scope of getting a job is lesser than the people in Double Bay who have
skilled employees for the service industry. 45.5% of the people in Double Bay are the
professional and major part are associated with service professions. This is the just the
3
⊘ This is a preview!⊘
Do you want full access?
Subscribe today to unlock all pages.
Trusted by 1+ million students worldwide
opposite of the Fairfield where people are associated with labouring jobs, trade workers and
machinery jobs. Therefore, they get paid less in spite of giving greater labour. This is one of
the major reason of the socio-economic gaps between the two neighbouring states. These
three factors contribute equally between the different socio-economic conditions of these two
localities.
4
machinery jobs. Therefore, they get paid less in spite of giving greater labour. This is one of
the major reason of the socio-economic gaps between the two neighbouring states. These
three factors contribute equally between the different socio-economic conditions of these two
localities.
4
Paraphrase This Document
Need a fresh take? Get an instant paraphrase of this document with our AI Paraphraser
Reference List
‒ Please ensure that your reference list is formatted using Western Sydney University’s
Harvard Referencing Style
(http://library.westernsydney.edu.au/main/sites/default/files/cite_Harvard.pdf).
‒ Refer to the materials from Week 5’s Workshop for additional advice.
Write your reference list below this line
Frieden, J., 2018. The politics of the globalization backlash: Sources and implications.
Unpublished manuscript, Department of Government, Harvard University.
Randolph, B. and Tice, A., 2017. Relocating disadvantage in five Australian cities: Socio-
spatial polarisation under neo-liberalism. Urban policy and research, 35(2), pp.103-121.
Appendix – ABS QuickStat Suburb Comparison Tables, 2016 Census
Part II of Assignment 1 requires you to download and enter ABS QuickStats data into the comparison
tables presented in this document. Please see below for step-by-step instructions.
Step-by-Step Instructions for Completing the Comparison Tables
Step One – Download the data you need from the ABS QuickStats website by following these steps:
Click on the link http://www.abs.gov.au/websitedbs/D3310114.nsf/Home/Census
If the link does not work, copy and paste the link into your web browser.
The link will take you to the ABS Census home page.
Find the ‘QuickStats Search’ box listed under ‘Data by Geographies’.
Type the name of the suburb in which you live in the search box under ‘Search QuickStats’.
You will need to choose a statistical level from a list of options. These options will be
automatically generated once you enter the suburb name. Please select ‘State Suburb
(SSC)’. For example, if your suburb is Blacktown, the correct option to choose is: ‘Blacktown,
NSW State Suburb (SSC)’,
Make sure 2016 census data is selected (the last Australian census was conducted in 2016,
and the next will take place in 2021) and click on ‘go’.
QuickStats data for your suburb will then be generated.
Repeat the process for your comparison suburb. Remember that the comparison suburb is to
be selected from a Sydney region that is different to the region in which the suburb you live in
is located.
5
Step Two – Enter the ABS QuickStats data for the two suburbs chosen into the tables below, noting:
You will need to manually enter the data in the tables.
Please note that you WON’T need to enter all the data generated by the ABS website, only
the data for the tables below.
Step Three – Use the Comparison Tables to complete Part III of the assignment
Step Four – Include these completed tables as an Appendix to your completed Assignment
6
⊘ This is a preview!⊘
Do you want full access?
Subscribe today to unlock all pages.
Trusted by 1+ million students worldwide
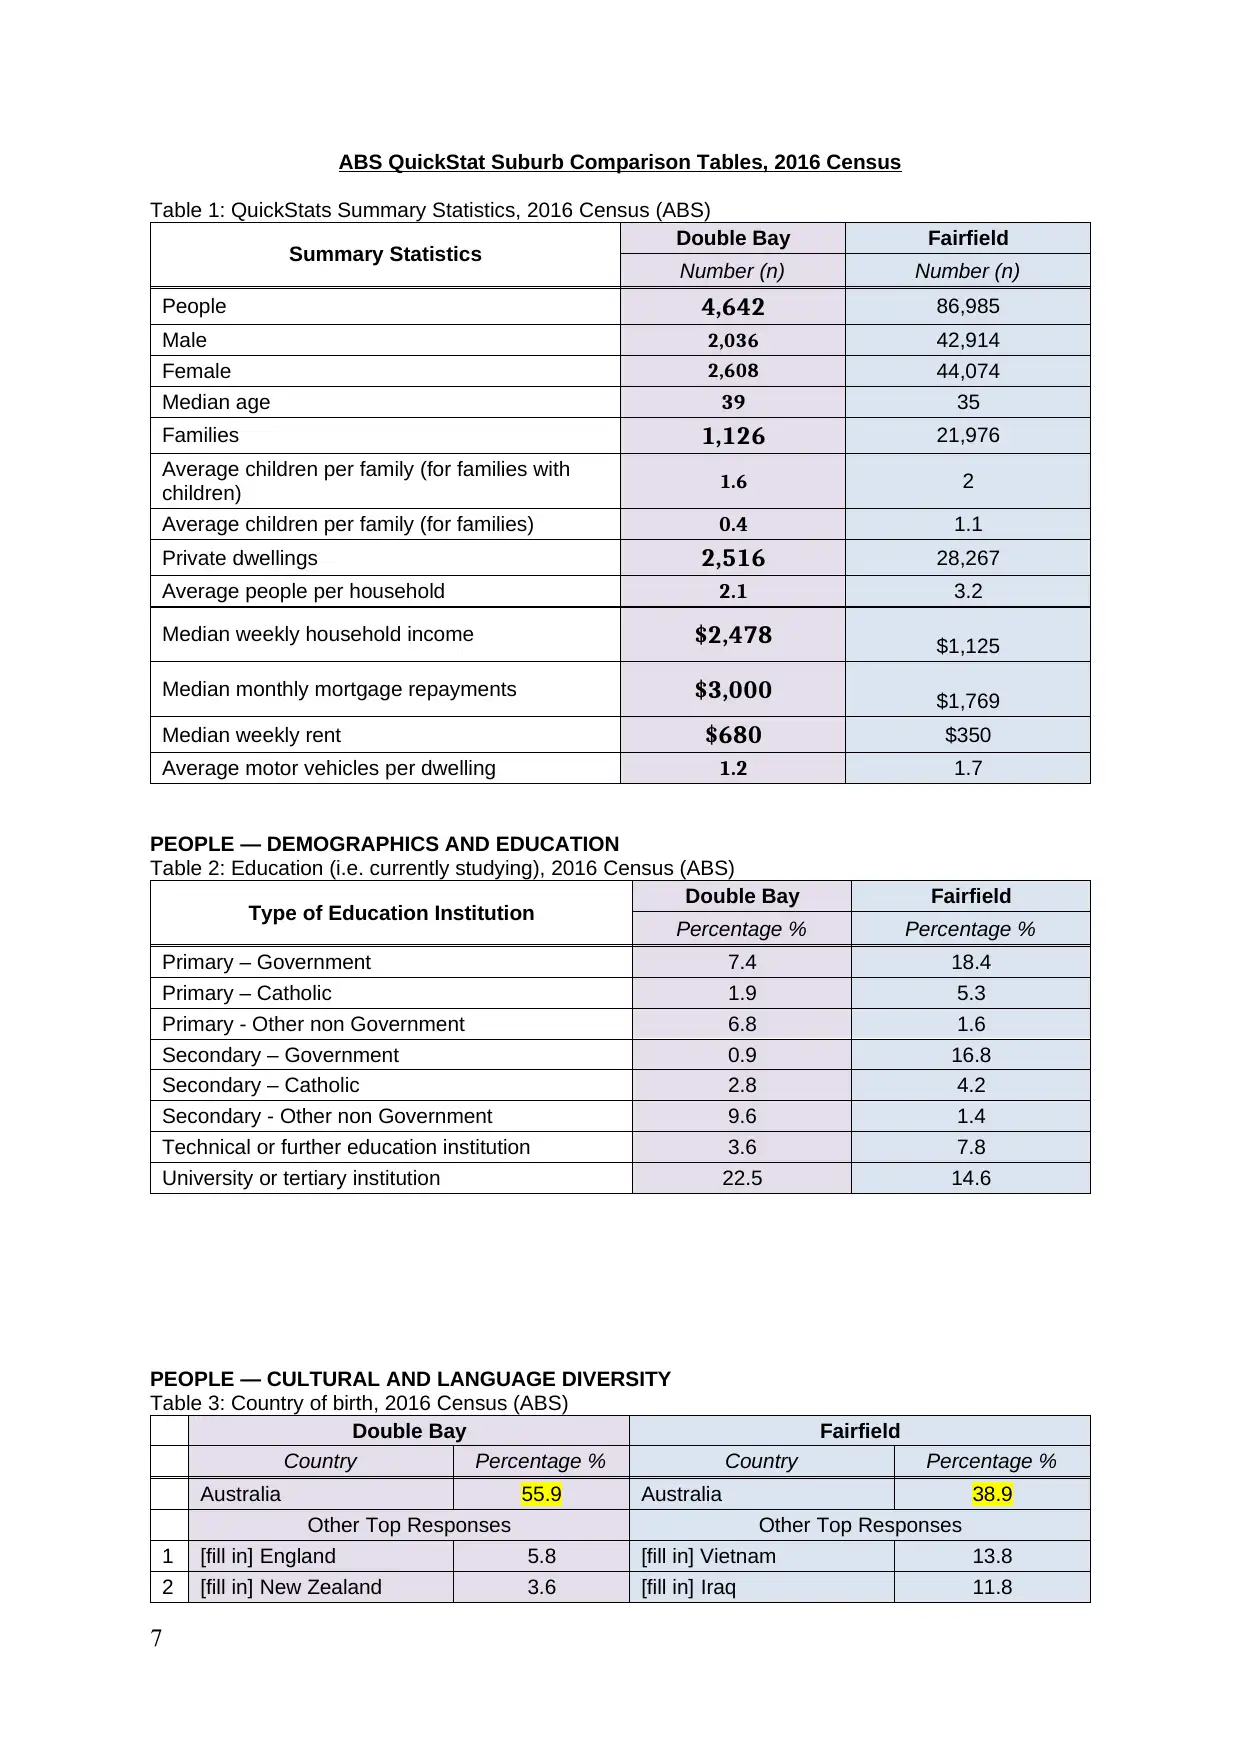
ABS QuickStat Suburb Comparison Tables, 2016 Census
Table 1: QuickStats Summary Statistics, 2016 Census (ABS)
Summary Statistics Double Bay Fairfield
Number (n) Number (n)
People 4,642 86,985
Male 2,036 42,914
Female 2,608 44,074
Median age 39 35
Families 1,126 21,976
Average children per family (for families with
children) 1.6 2
Average children per family (for families) 0.4 1.1
Private dwellings 2,516 28,267
Average people per household 2.1 3.2
Median weekly household income $2,478 $1,125
Median monthly mortgage repayments $3,000 $1,769
Median weekly rent $680 $350
Average motor vehicles per dwelling 1.2 1.7
PEOPLE — DEMOGRAPHICS AND EDUCATION
Table 2: Education (i.e. currently studying), 2016 Census (ABS)
Type of Education Institution Double Bay Fairfield
Percentage % Percentage %
Primary – Government 7.4 18.4
Primary – Catholic 1.9 5.3
Primary - Other non Government 6.8 1.6
Secondary – Government 0.9 16.8
Secondary – Catholic 2.8 4.2
Secondary - Other non Government 9.6 1.4
Technical or further education institution 3.6 7.8
University or tertiary institution 22.5 14.6
PEOPLE — CULTURAL AND LANGUAGE DIVERSITY
Table 3: Country of birth, 2016 Census (ABS)
Double Bay Fairfield
Country Percentage % Country Percentage %
Australia 55.9 Australia 38.9
Other Top Responses Other Top Responses
1 [fill in] England 5.8 [fill in] Vietnam 13.8
2 [fill in] New Zealand 3.6 [fill in] Iraq 11.8
7
Paraphrase This Document
Need a fresh take? Get an instant paraphrase of this document with our AI Paraphraser
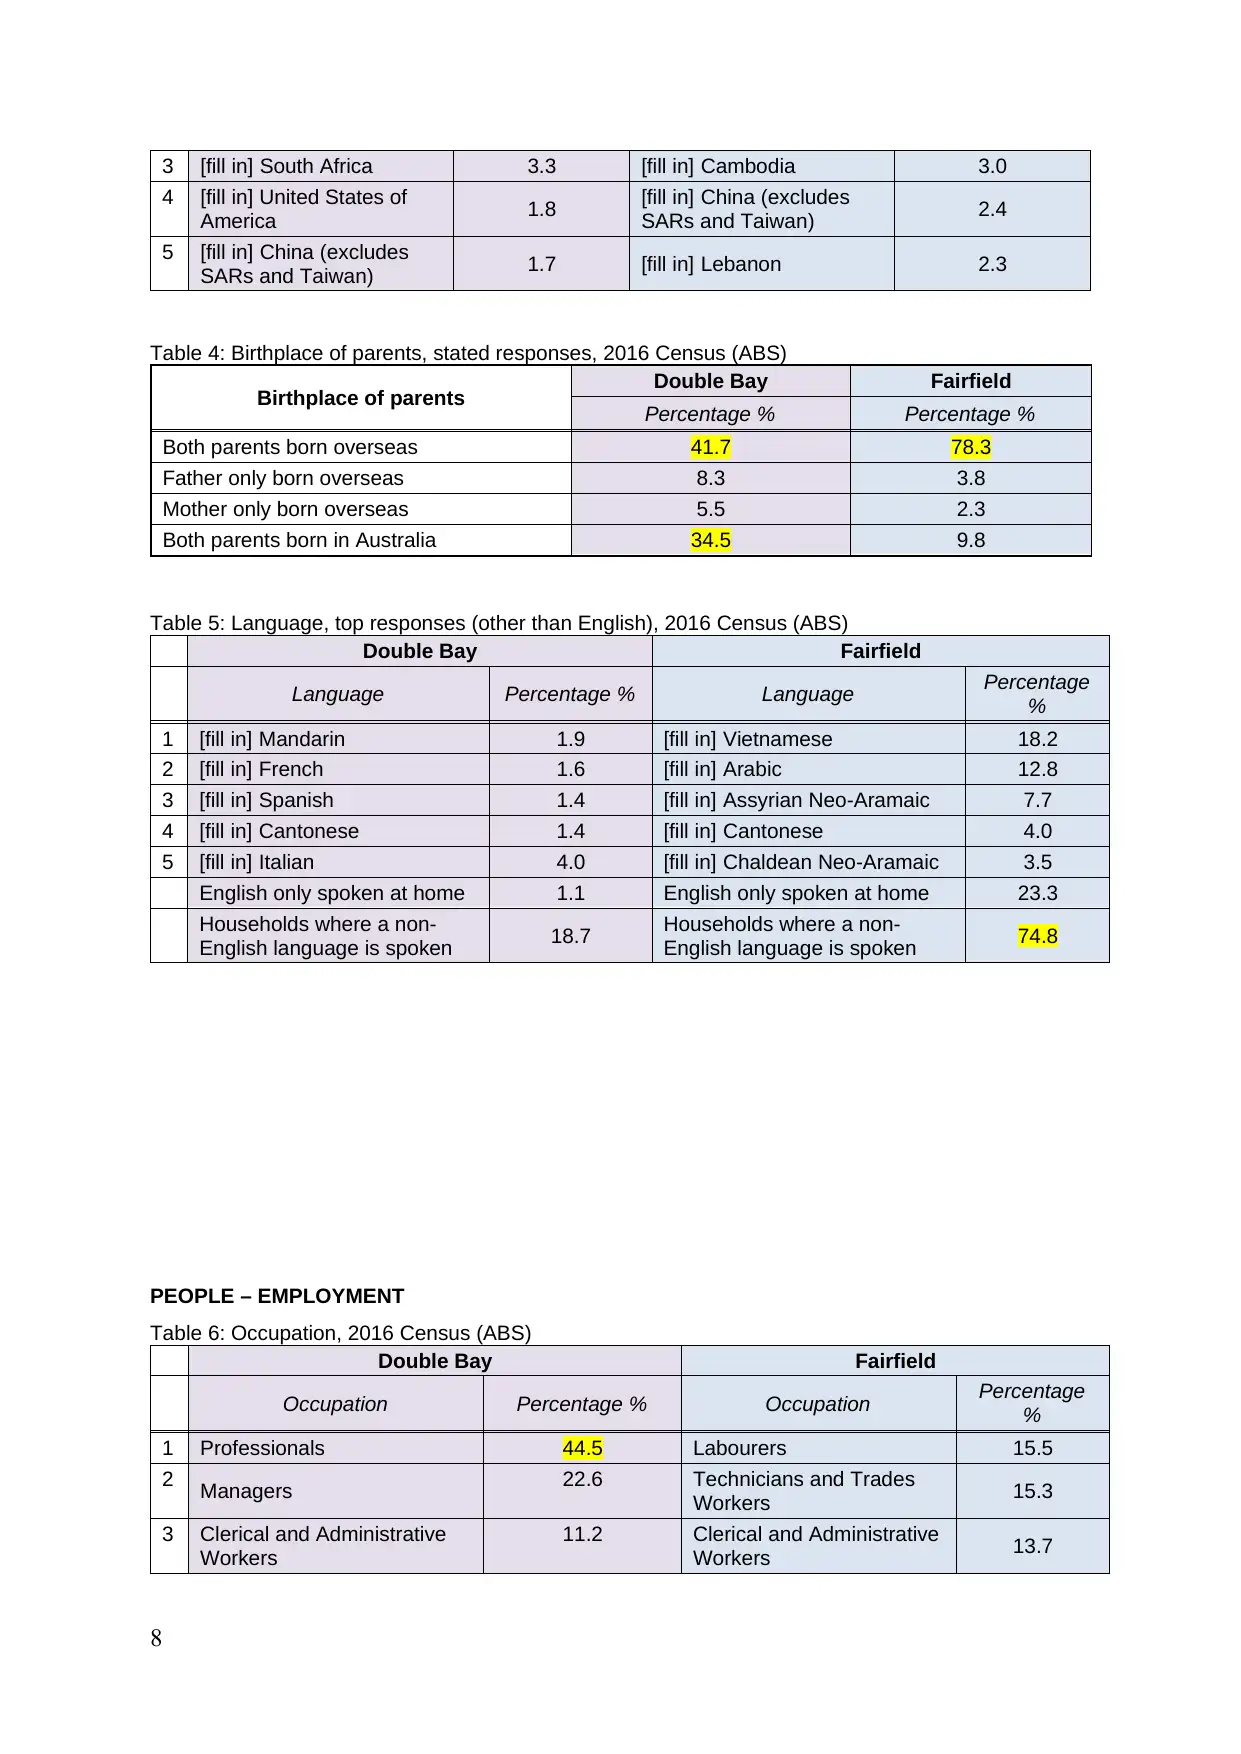
3 [fill in] South Africa 3.3 [fill in] Cambodia 3.0
4 [fill in] United States of
America 1.8 [fill in] China (excludes
SARs and Taiwan) 2.4
5 [fill in] China (excludes
SARs and Taiwan) 1.7 [fill in] Lebanon 2.3
Table 4: Birthplace of parents, stated responses, 2016 Census (ABS)
Birthplace of parents Double Bay Fairfield
Percentage % Percentage %
Both parents born overseas 41.7 78.3
Father only born overseas 8.3 3.8
Mother only born overseas 5.5 2.3
Both parents born in Australia 34.5 9.8
Table 5: Language, top responses (other than English), 2016 Census (ABS)
Double Bay Fairfield
Language Percentage % Language Percentage
%
1 [fill in] Mandarin 1.9 [fill in] Vietnamese 18.2
2 [fill in] French 1.6 [fill in] Arabic 12.8
3 [fill in] Spanish 1.4 [fill in] Assyrian Neo-Aramaic 7.7
4 [fill in] Cantonese 1.4 [fill in] Cantonese 4.0
5 [fill in] Italian 4.0 [fill in] Chaldean Neo-Aramaic 3.5
English only spoken at home 1.1 English only spoken at home 23.3
Households where a non-
English language is spoken 18.7 Households where a non-
English language is spoken 74.8
PEOPLE – EMPLOYMENT
Table 6: Occupation, 2016 Census (ABS)
Double Bay Fairfield
Occupation Percentage % Occupation Percentage
%
1 Professionals 44.5 Labourers 15.5
2 Managers 22.6 Technicians and Trades
Workers 15.3
3 Clerical and Administrative
Workers
11.2 Clerical and Administrative
Workers 13.7
8
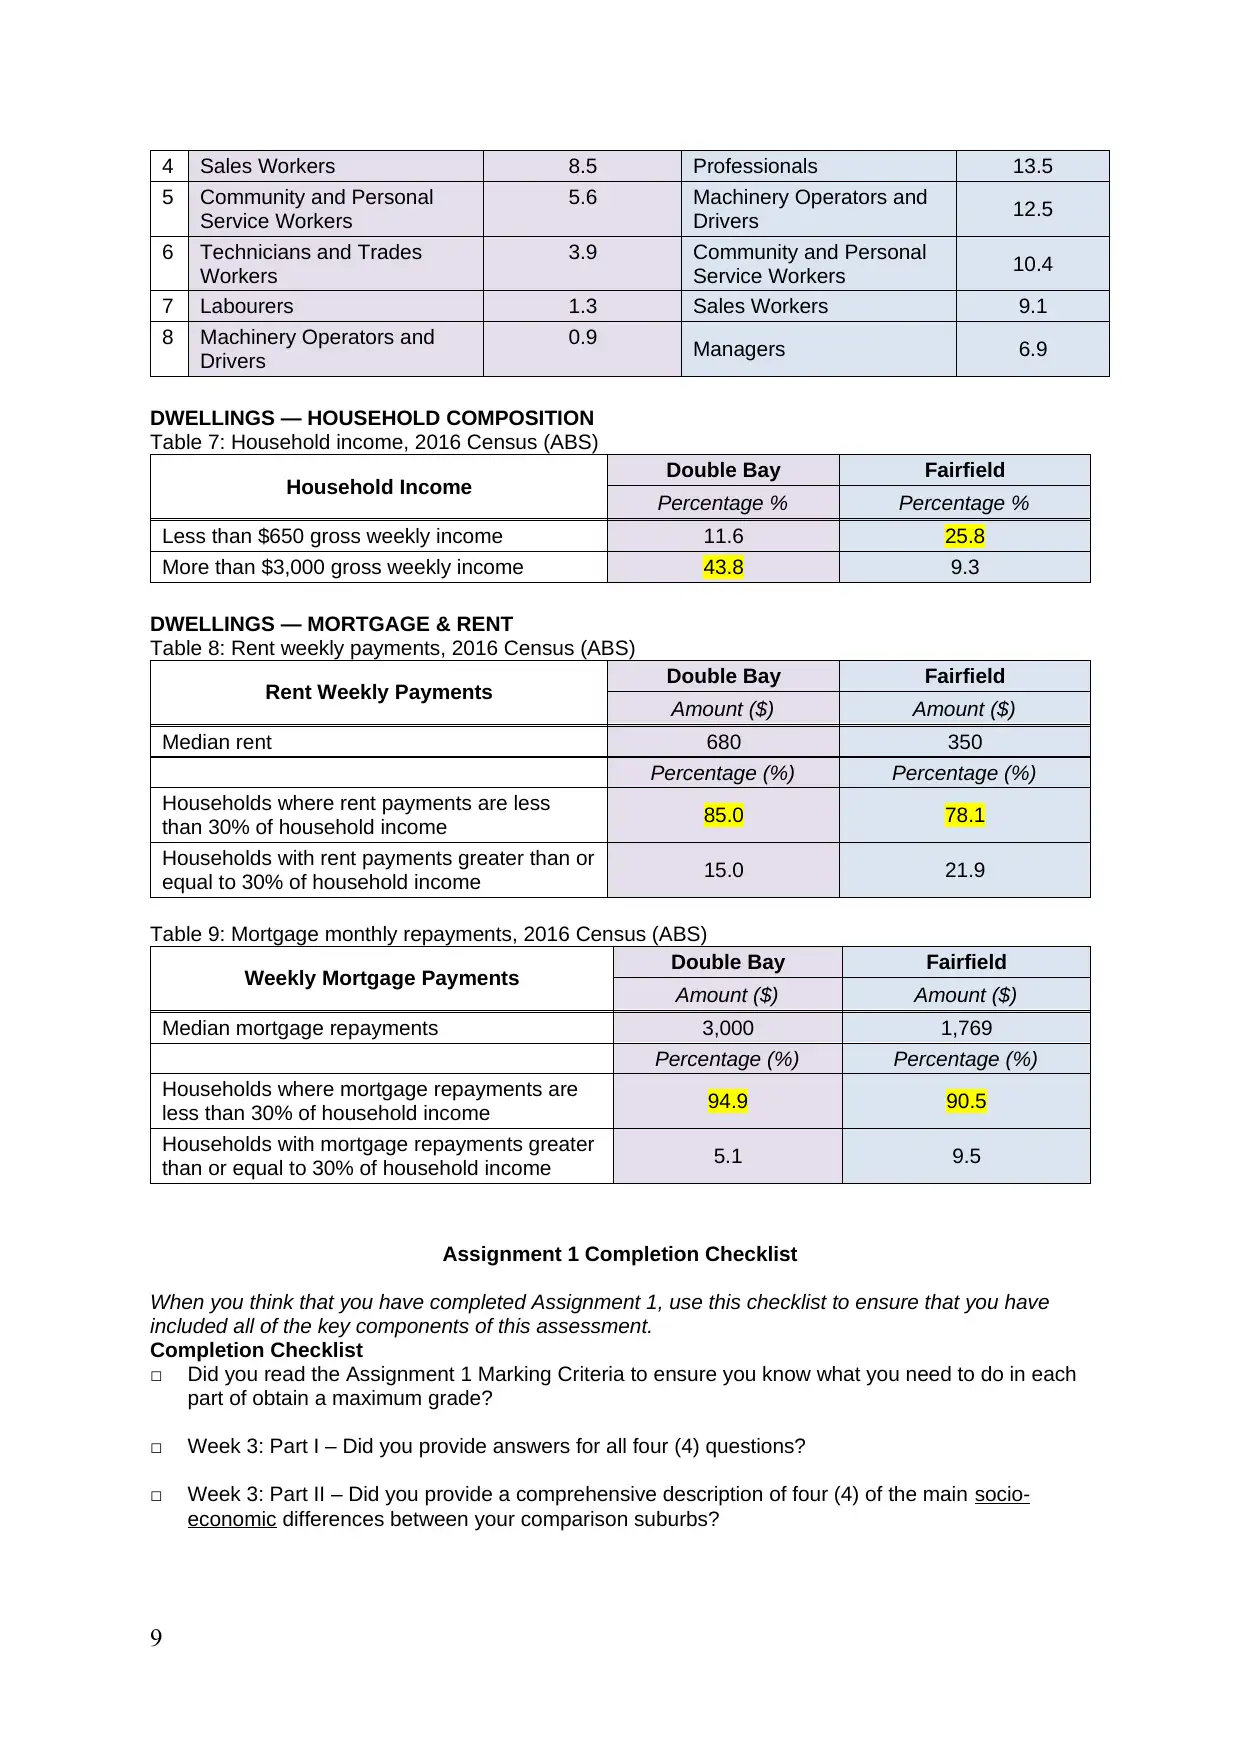
4 Sales Workers 8.5 Professionals 13.5
5 Community and Personal
Service Workers
5.6 Machinery Operators and
Drivers 12.5
6 Technicians and Trades
Workers
3.9 Community and Personal
Service Workers 10.4
7 Labourers 1.3 Sales Workers 9.1
8 Machinery Operators and
Drivers
0.9 Managers 6.9
DWELLINGS — HOUSEHOLD COMPOSITION
Table 7: Household income, 2016 Census (ABS)
Household Income Double Bay Fairfield
Percentage % Percentage %
Less than $650 gross weekly income 11.6 25.8
More than $3,000 gross weekly income 43.8 9.3
DWELLINGS — MORTGAGE & RENT
Table 8: Rent weekly payments, 2016 Census (ABS)
Rent Weekly Payments Double Bay Fairfield
Amount ($) Amount ($)
Median rent 680 350
Percentage (%) Percentage (%)
Households where rent payments are less
than 30% of household income 85.0 78.1
Households with rent payments greater than or
equal to 30% of household income 15.0 21.9
Table 9: Mortgage monthly repayments, 2016 Census (ABS)
Weekly Mortgage Payments Double Bay Fairfield
Amount ($) Amount ($)
Median mortgage repayments 3,000 1,769
Percentage (%) Percentage (%)
Households where mortgage repayments are
less than 30% of household income 94.9 90.5
Households with mortgage repayments greater
than or equal to 30% of household income 5.1 9.5
Assignment 1 Completion Checklist
When you think that you have completed Assignment 1, use this checklist to ensure that you have
included all of the key components of this assessment.
Completion Checklist
□ Did you read the Assignment 1 Marking Criteria to ensure you know what you need to do in each
part of obtain a maximum grade?
□ Week 3: Part I – Did you provide answers for all four (4) questions?
□ Week 3: Part II – Did you provide a comprehensive description of four (4) of the main socio-
economic differences between your comparison suburbs?
9
⊘ This is a preview!⊘
Do you want full access?
Subscribe today to unlock all pages.
Trusted by 1+ million students worldwide
□ Week 6: Part III – Did you demonstrate a comprehensive knowledge of the reasons for the socio-
economic differences between your comparison suburbs using academic literature (books, journal
articles and books) and the lectures from Module 1?
□ Part III – Did you use at least two (2) journal articles, book chapters or books from the list of
suggested readings for Assignment 1 AND/OR Module 1 readings?
□ Part III – Are your in-text citations correctly formatted using Western Sydney University’s Harvard
Referencing Guidelines?
□ References – Have you included a reference list correctly formatted using Western Sydney
University’s Harvard Style Referencing Guidelines?
□ Week 3: Appendix – Have you included your ABS QuickStat Comparison Tables as an appendix
item?
□ Turnitin – Have you submitted your assignment to Turnitin and carefully checked the familiarity
report to ensure that you have correctly paraphrased information from secondary sources in your
own words?
If you have successfully completed all of these steps, CONGRATULATIONS on completing the
first assignment for People, Place and Social Difference!
10
1 out of 10

Your All-in-One AI-Powered Toolkit for Academic Success.
+13062052269
info@desklib.com
Available 24*7 on WhatsApp / Email
![[object Object]](/_next/static/media/star-bottom.7253800d.svg)
Unlock your academic potential
Copyright © 2020–2026 A2Z Services. All Rights Reserved. Developed and managed by ZUCOL.