BAC21 Report: Analysis of Soft Drink Consumption Among USC Students

Verified

Added on  2022/11/15

|9
|1126
|289
Report
AI Summary
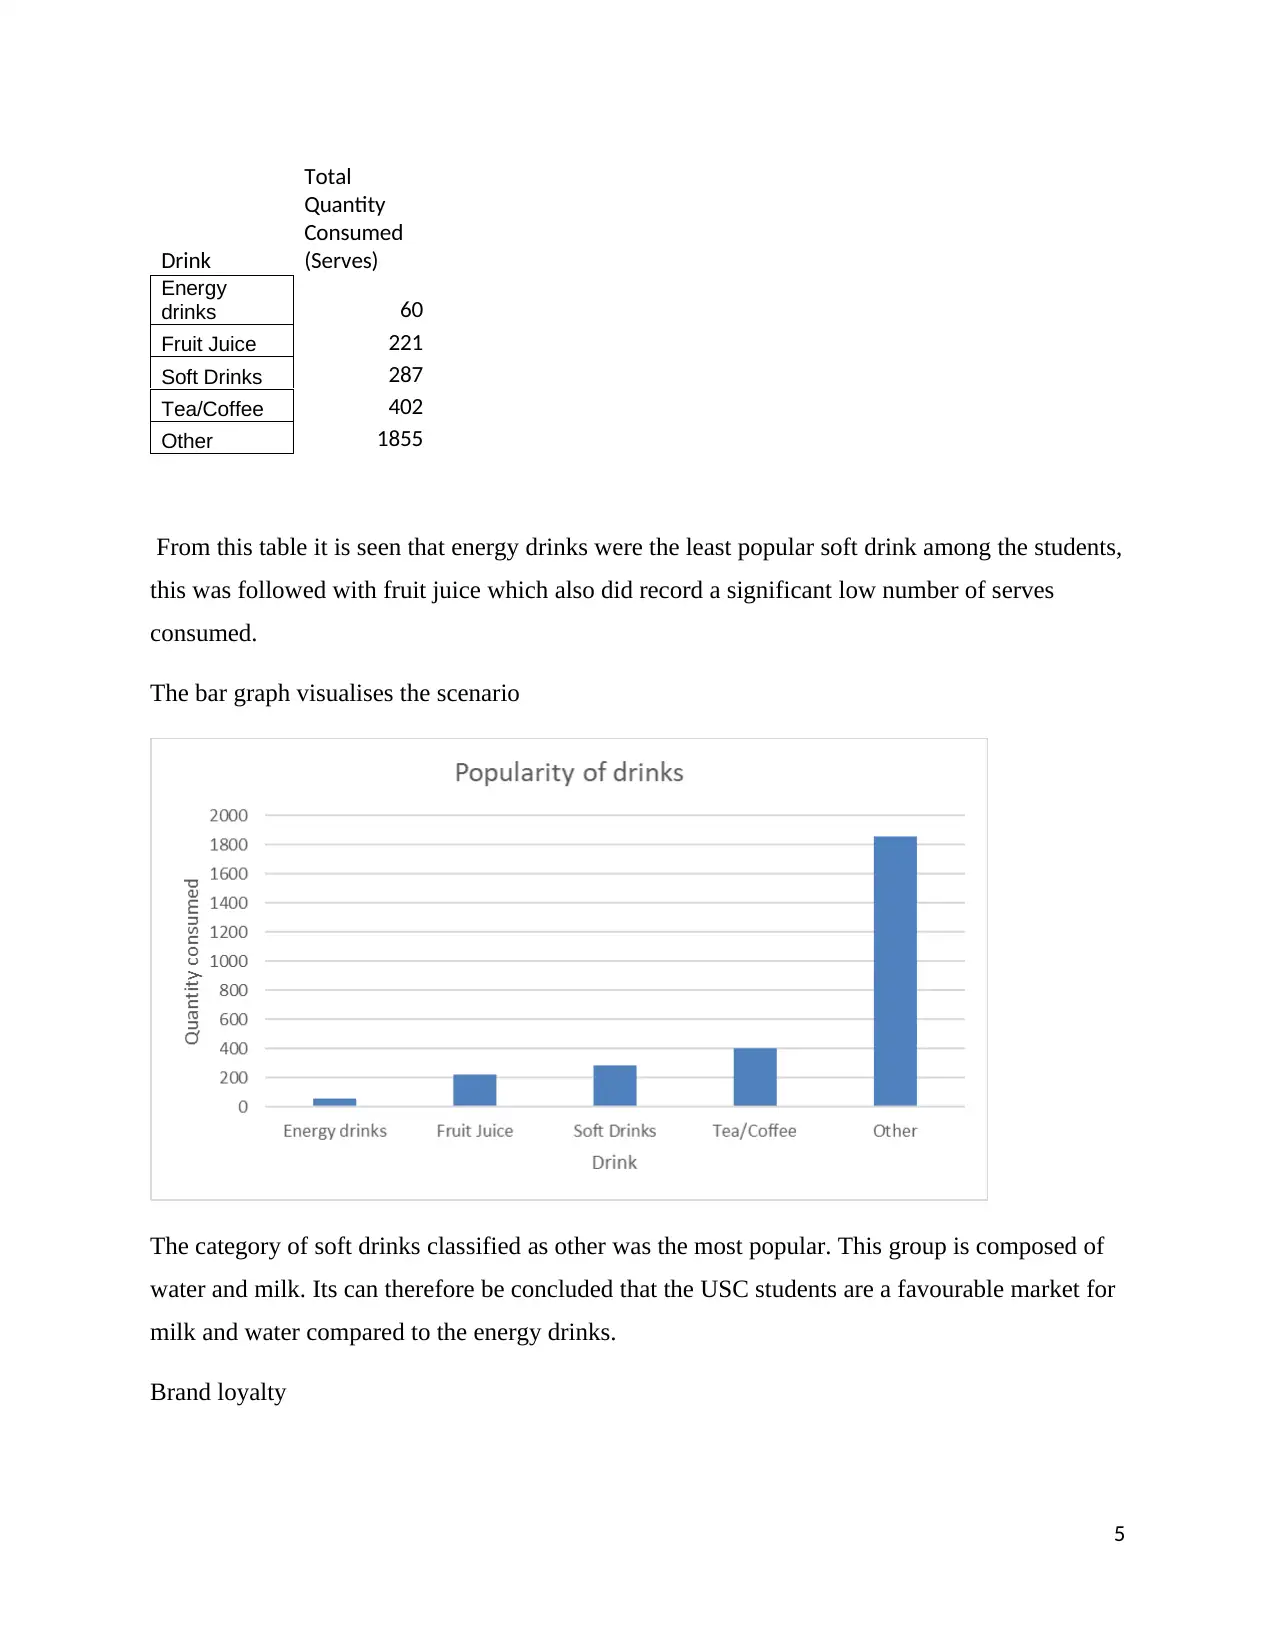
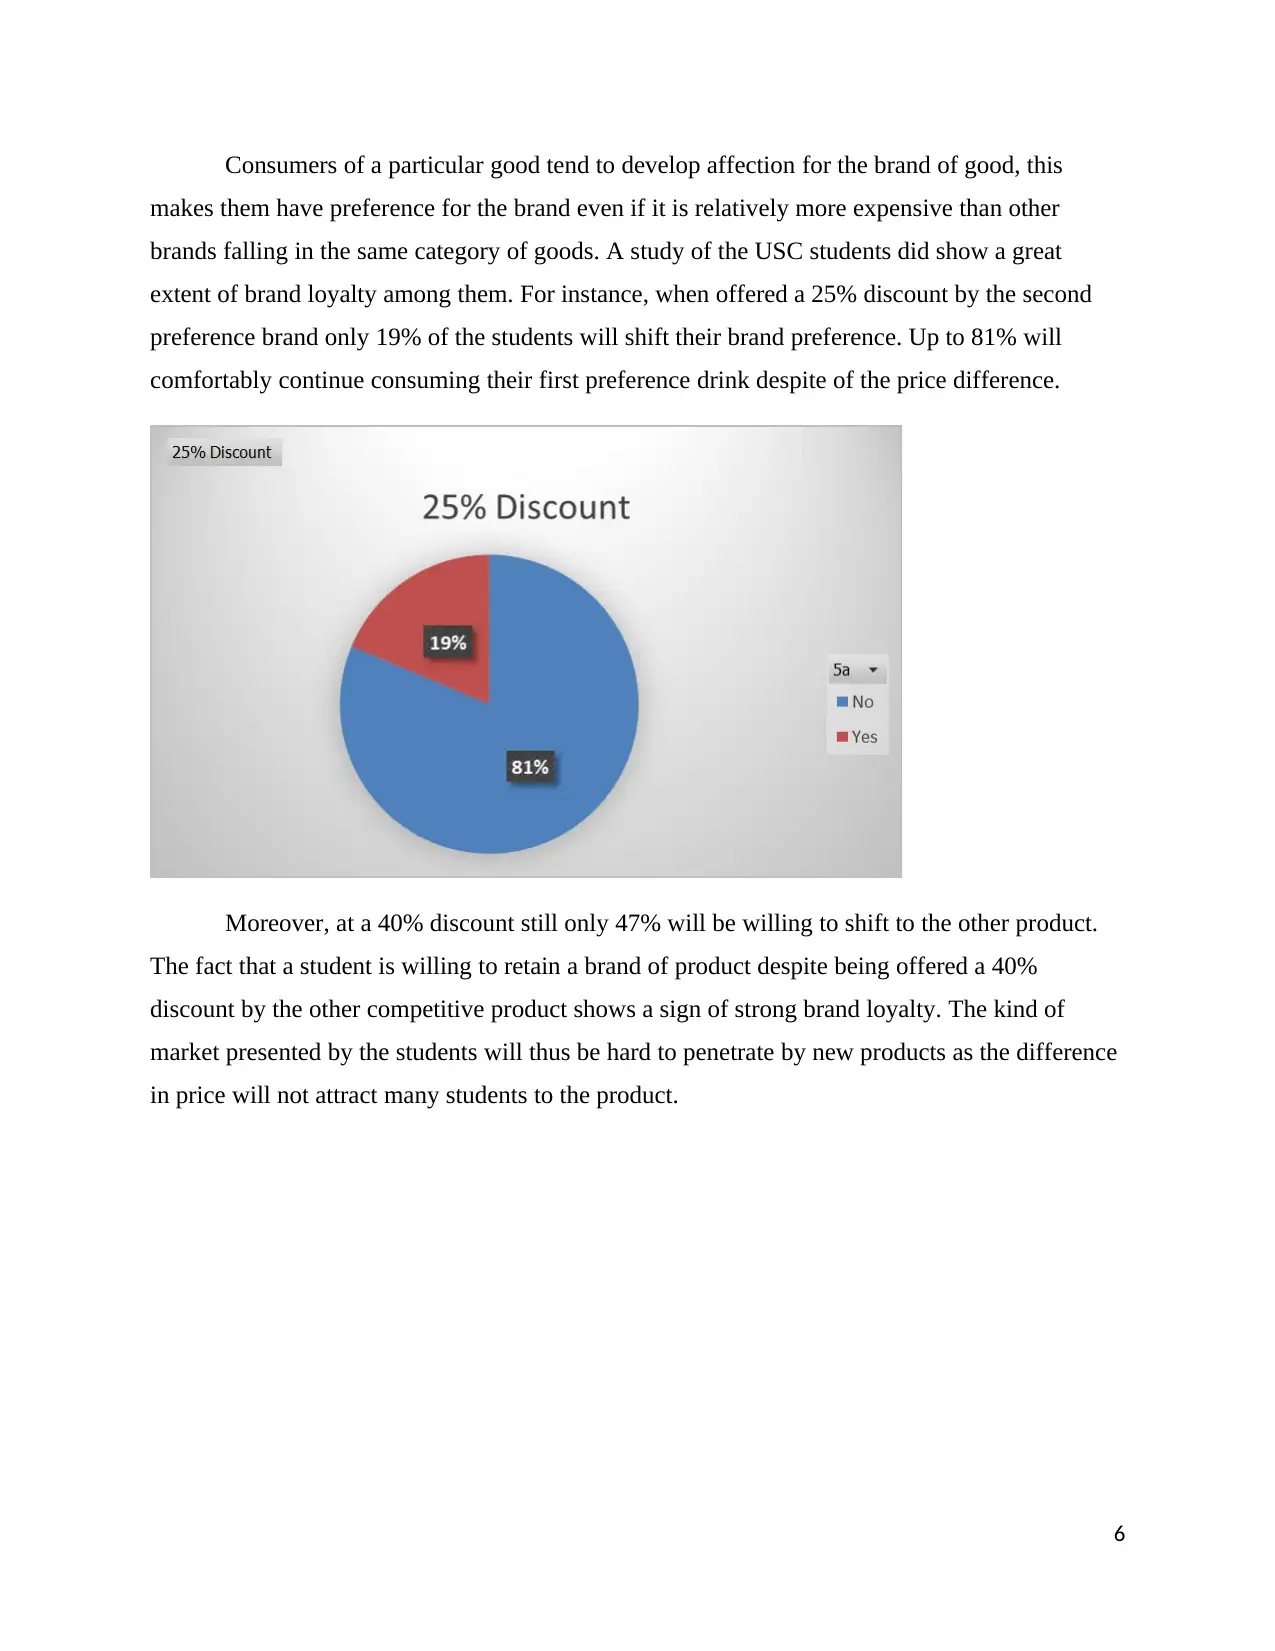
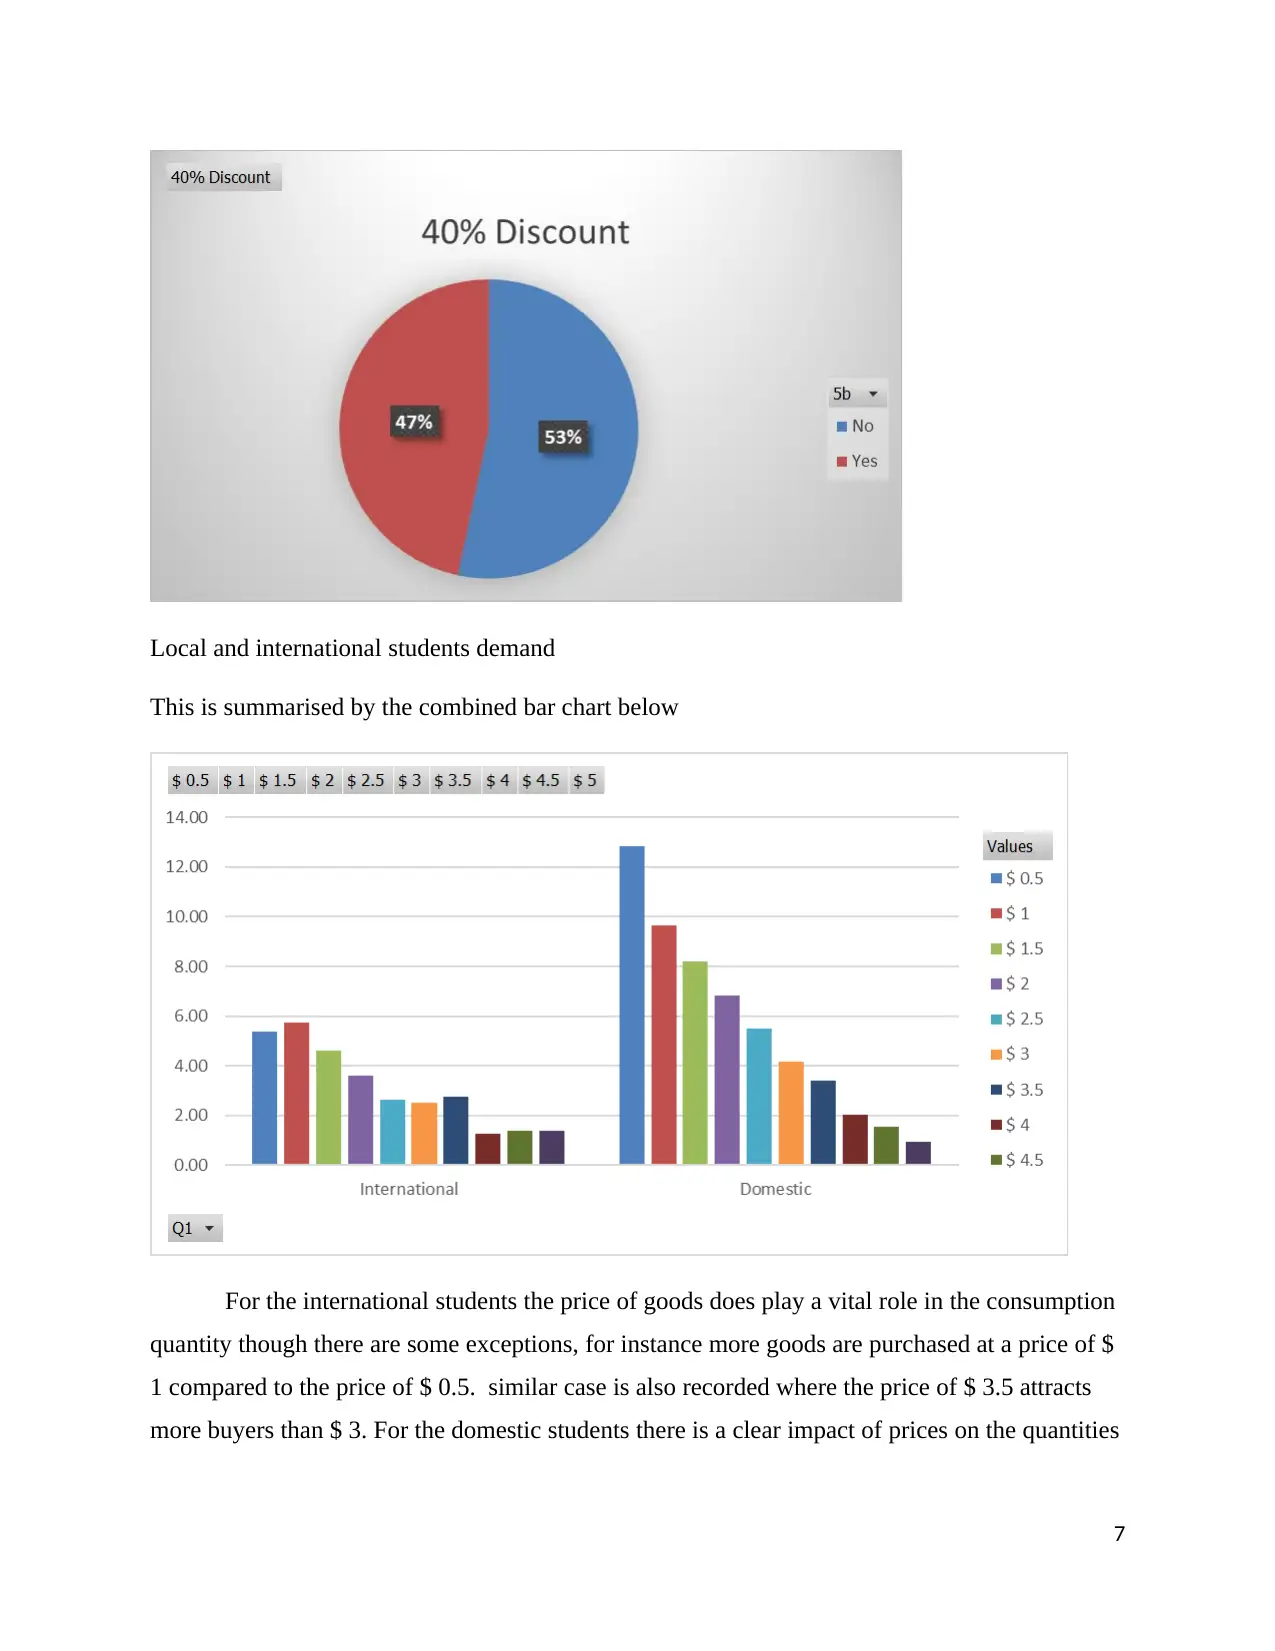
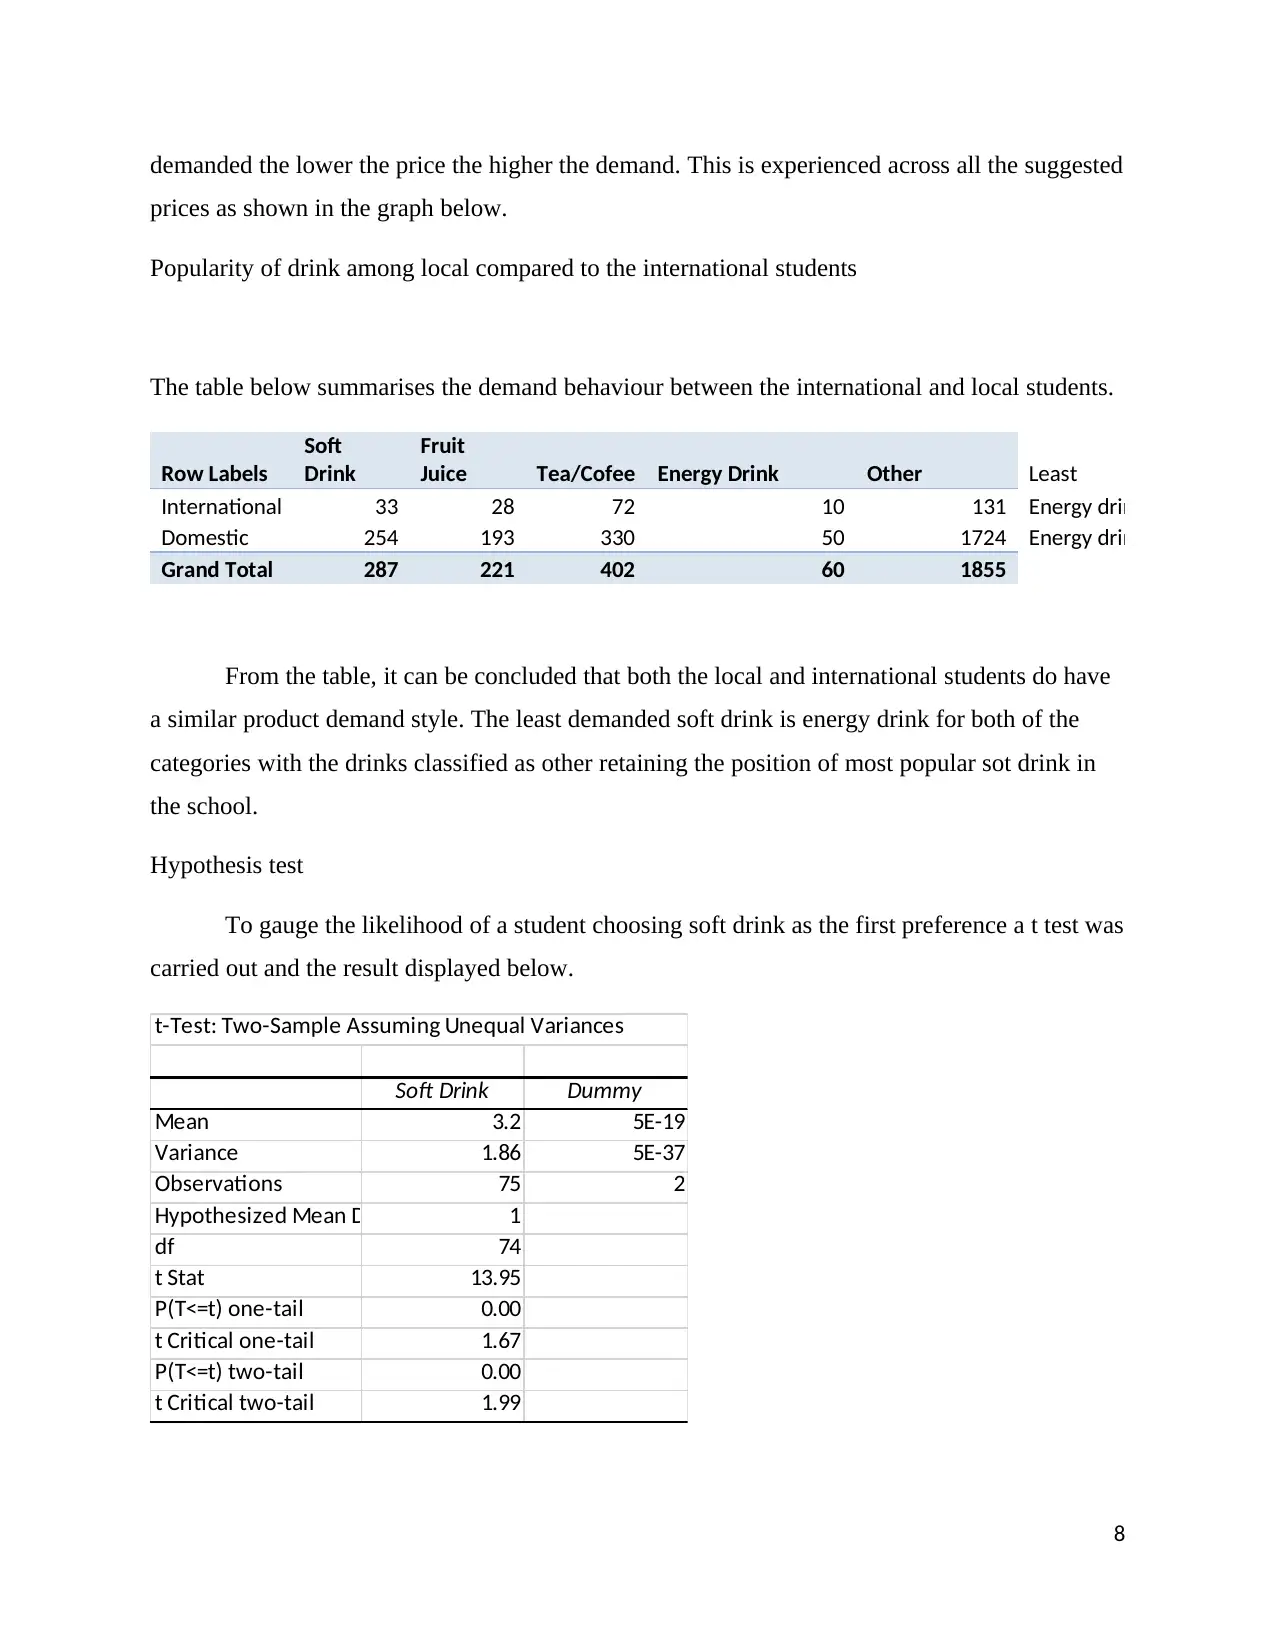
This business report presents the findings of a BAC21 group research project investigating the soft drink market at the University of Southern California (USC). The study analyzed a sample of 75 student responses to understand consumption patterns, brand preferences, and the impact of price on demand. Key findings include the dominance of domestic students, an inverse relationship between price and quantity consumed, the popularity of water and milk over energy drinks, and a significant degree of brand loyalty among students. The report also compares consumption patterns between local and international students and includes a hypothesis test on soft drink preference. The analysis, conducted using Microsoft Excel, provides insights into the USC student market and the factors influencing their soft drink consumption, offering valuable information for businesses targeting this demographic.
Document Page
BAC21 Group Research Project
Student Name
Institution
1
tabler-icon-diamond-filled.svg

Paraphrase This Document

Need a fresh take? Get an instant paraphrase of this document with our AI Paraphraser
Document Page
Introduction
USC is an international educational centre that admits students from all corners of the
world. Due to the large number of students residing within and around the university, the school
has become a market for a number of commodities. In this research the focus is to study and
understand the students’ consumption of soft drinks. As a way of getting the students feedback
regarding their consumption of soft drinks, the BAC21 students were interviewed and the data
recorded in form of an excel document. A sample of 75 responses was thereafter selected at
random from the excel data containing the interview responses. This sample was analysed using
Microsoft Excel and the result of the analysis documented as a business report.
Data Analysis
Students origin
USC admits students both from the international and the local community, based on the
sample data the table below presents the distribution of the students.
Student
origin Sum
International 8
Domestic 67
Grand
Total 75
From this table it’s notable that the domestic students are the majority in the school. Drawing a
pie chart as presented below, the percentage of domestic students is derived to be 89% with the
international students only contributing 11% of the students in USC. This indicates that even
though the school is open to students from all over the world, it is yet to attract a proportionate
number of students from outside the country.
2
Document Page
Relationship between price and average quantity consumed
Based on the consumption theories, one of the factors that had been shown to affect the
quantity of goods and services consumed is their prices. In this case the interest is to gauge how
the price changes affect the average quantities of soft drinks consumed by a student. The table
below summarises the findings.
Price
Average
Quantity
$0.50 12.04
$1.00 9.24
$1.50 7.83
$2.00 5.19
$2.50 6.48
$3.00 3.99
$3.50 3.33
$4.00 1.95
$4.50 1.55
$5.00 1.00
3
Document Page
To present this data in a more visible form, a line graph was drawn as presented below.
Looking at the graph its notable that the average serves consumed by a student is higher
when the price is lower and the number reduces gradually as the price goes up. At a price of $
0.5 a student is consuming an average of 12 serves which higher than the 1.95 serves being
consumed when the price rises to $ 4. It can thus be concluded that the price and average
quantity consumed do have an inverse relationship, that is as the increase in one variable is
associated with a decrease of the other.
Popularity of drinks among students
To gauge the popularity of the sift drinks among the students, the total number of serves
that the sampled students consumed was recorded and compared among each brand of drink. The
information is presented in the table below.
4
tabler-icon-diamond-filled.svg

Paraphrase This Document

Need a fresh take? Get an instant paraphrase of this document with our AI Paraphraser
Document Page
Drink
Total
Quantity
Consumed
(Serves)
Energy
drinks 60
Fruit Juice 221
Soft Drinks 287
Tea/Coffee 402
Other 1855
From this table it is seen that energy drinks were the least popular soft drink among the students,
this was followed with fruit juice which also did record a significant low number of serves
consumed.
The bar graph visualises the scenario
The category of soft drinks classified as other was the most popular. This group is composed of
water and milk. Its can therefore be concluded that the USC students are a favourable market for
milk and water compared to the energy drinks.
Brand loyalty
5
Document Page
Consumers of a particular good tend to develop affection for the brand of good, this
makes them have preference for the brand even if it is relatively more expensive than other
brands falling in the same category of goods. A study of the USC students did show a great
extent of brand loyalty among them. For instance, when offered a 25% discount by the second
preference brand only 19% of the students will shift their brand preference. Up to 81% will
comfortably continue consuming their first preference drink despite of the price difference.
Moreover, at a 40% discount still only 47% will be willing to shift to the other product.
The fact that a student is willing to retain a brand of product despite being offered a 40%
discount by the other competitive product shows a sign of strong brand loyalty. The kind of
market presented by the students will thus be hard to penetrate by new products as the difference
in price will not attract many students to the product.
6
Document Page
Local and international students demand
This is summarised by the combined bar chart below
For the international students the price of goods does play a vital role in the consumption
quantity though there are some exceptions, for instance more goods are purchased at a price of $
1 compared to the price of $ 0.5. similar case is also recorded where the price of $ 3.5 attracts
more buyers than $ 3. For the domestic students there is a clear impact of prices on the quantities
7
tabler-icon-diamond-filled.svg

Paraphrase This Document

Need a fresh take? Get an instant paraphrase of this document with our AI Paraphraser
Document Page
demanded the lower the price the higher the demand. This is experienced across all the suggested
prices as shown in the graph below.
Popularity of drink among local compared to the international students
The table below summarises the demand behaviour between the international and local students.
Row Labels
Soft
Drink
Fruit
Juice Tea/Cofee Energy Drink Other Least
International 33 28 72 10 131 Energy drink
Domestic 254 193 330 50 1724 Energy drink
Grand Total 287 221 402 60 1855
From the table, it can be concluded that both the local and international students do have
a similar product demand style. The least demanded soft drink is energy drink for both of the
categories with the drinks classified as other retaining the position of most popular sot drink in
the school.
Hypothesis test
To gauge the likelihood of a student choosing soft drink as the first preference a t test was
carried out and the result displayed below.
t-Test: Two-Sample Assuming Unequal Variances
Soft Drink Dummy
Mean 3.2 5E-19
Variance 1.86 5E-37
Observations 75 2
Hypothesized Mean Difference 1
df 74
t Stat 13.95
P(T<=t) one-tail 0.00
t Critical one-tail 1.67
P(T<=t) two-tail 0.00
t Critical two-tail 1.99
8
Document Page
The test p value was observed to be lower than 0.05. hence at a 95% level of confidence, it can
be concluded that a student is not likely to chose soft drink as a first preference.
Summary
Consumption of goods is based on personal preference; this though is influenced by price
which is a factor of income. From the analysis conducted above it has been observed that as the
product price increases the quantities consumed reduces. The USC students are majorly from the
local community. This though have not altered their consumption pattern as both the
international and local students least prefers energy drink and demands more of water and milk
which are classified as other products. The hypothesis test on the other hand indicates that soft
drinks has a very lower likelihood of being selected as a first preference product.
9
chevron_up_icon
1 out of 9
circle_padding
hide_on_mobile
zoom_out_icon
[object Object]