A Comprehensive Report on Software Engineering and UML Diagrams
VerifiedAdded on 2022/08/18
|14
|1380
|12
Report
AI Summary
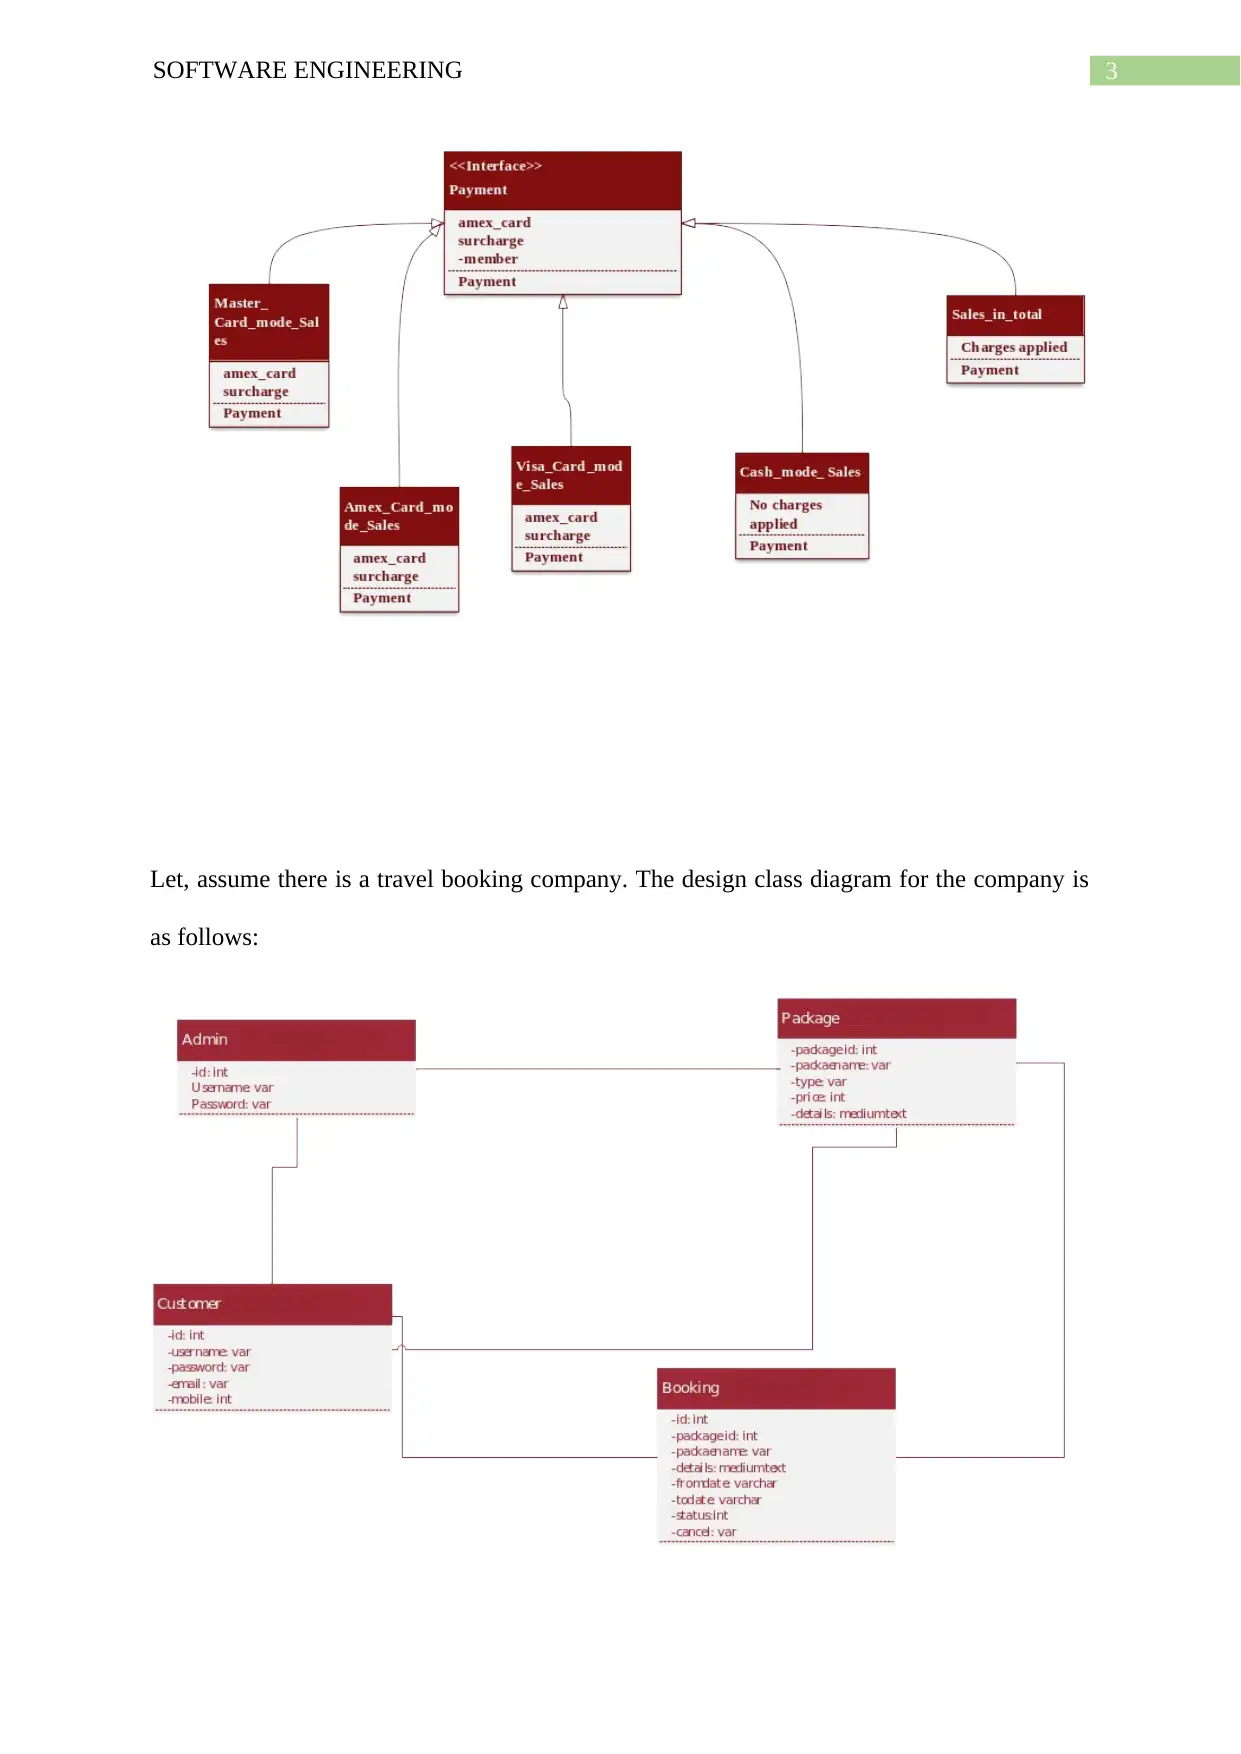
This report delves into key aspects of software engineering, focusing on the application and analysis of UML diagrams. It begins by exploring the analysis and design class diagrams, highlighting their roles in system abstraction and detailed design, alongside the factors influencing their application. The report then examines the strengths of sequence diagrams, illustrating their use with a coffee shop scenario and discussing the factors that contribute to their effectiveness. Furthermore, it explains the various types of CRUD methods (Create, Read, Update, Delete) and their importance in data management, providing an e-commerce example. Finally, the report concludes with an examination of state machine diagrams, describing their purpose in depicting state-dependent object behavior, and uses a travel agency scenario for illustration, comparing and contrasting it with sequence diagrams. References are provided throughout to support the analysis.

Running head: SOFTWARE ENGINEERING
SOFTWARE ENGINEERING
Name of the Student
Name of the University
Author Note
SOFTWARE ENGINEERING
Name of the Student
Name of the University
Author Note
Paraphrase This Document
Need a fresh take? Get an instant paraphrase of this document with our AI Paraphraser

SOFTWARE ENGINEERING 1
Table of Contents
Part 1:.........................................................................................................................................2
References:.................................................................................................................................4
Part 2:.........................................................................................................................................5
Strength of Sequence Diagram:.............................................................................................5
Scenario:.................................................................................................................................5
Factors:...................................................................................................................................6
References:.................................................................................................................................6
Part 3:.........................................................................................................................................8
Types of CRUD method and importance:..............................................................................8
References:.................................................................................................................................9
Part 4:.......................................................................................................................................10
Purpose of State Machine Diagram:....................................................................................10
Scenario:...............................................................................................................................10
References:...............................................................................................................................13

2SOFTWARE ENGINEERING
Part 1:
The analysis class diagram can represent the abstraction of various classes or sub
systems that are included in the design of the system (Deryugina & Nikulchev, 2017). It is the
initial stage for the system. The analysis class diagram shows only the initial classes as it is
an overview of the system. On the other side, the design class diagram is the detailed
overview of the system as the code for the system will be developed on the basis of design
class diagram.
The factors are as follows:
Name: Each of the design pattern will be having a name that will be utilized for the role of
design pattern in the software design.
Problem: It describes the scope of issues that are existed in system design.
Solution: It describes the element structure which can make up the pattern.
Consequences: There are several advantages and disadvantages of the design pattern. The
consequences will concern time trade-offs and spaces (Vanderdonckt & Nguyen, 2019).
Let, there is a wine shop that accept payment in cash, visa card, Amex card and master card.
The analysis class diagram is as follows:
You're viewing a preview
Unlock full access by subscribing today!

3SOFTWARE ENGINEERING
Let, assume there is a travel booking company. The design class diagram for the company is
as follows:
Let, assume there is a travel booking company. The design class diagram for the company is
as follows:
Paraphrase This Document
Need a fresh take? Get an instant paraphrase of this document with our AI Paraphraser

4SOFTWARE ENGINEERING
References:
Deryugina, O., & Nikulchev, E. (2017). Algorithms of the UML Class Diagram Analysis and
Their Effectiveness: Strategy and Interface Insertion Transformations. In ITM Web of
Conferences (Vol. 10, p. 04002). EDP Sciences.
Vanderdonckt, J., & Nguyen, T. D. (2019). MoCaDiX: Designing Cross-Device User
Interfaces of an Information System based on its Class Diagram. Proceedings of the
ACM on Human-Computer Interaction, 3(EICS), 1-40.

5SOFTWARE ENGINEERING
Part 2:
Strength of Sequence Diagram:
Sequence diagram is an interactive diagram in UML, so the interaction between
the system’s objects is depicted sequentially to the user. The life span of the two
objects is known to the user through this diagram.
By using this diagram we can see the implementation of the scenario of the
system and also the features of the scenario is known to the user (Campean &
Yildirim, 2017).
User can update this diagram easily according to the requirements of the system.
Generating and maintaining this sequence diagram is also the easiest task for the
user.
Any kind of real applications or any system can be discussed in detail by using
this diagram.
Scenario:
Let assume there is a coffee shop, currently the shop is accepting cash payment only.
However, the owner of the shop wants to implement card payment as one more payment
option. The sequence diagram for the scenario is as follows:
You're viewing a preview
Unlock full access by subscribing today!

6SOFTWARE ENGINEERING
Factors:
The sequence diagram is clearly stating the scenario. As one can easily understand
that there are two options for making the payment (Karim et al., 2017). At first, the customer
will select the payment method (cash or card). Then there will be two options for the
consumer to make the payment. Then the customer will make the payment by the selected
payment method.
References:
Campean, I. F., & Yildirim, U. (2017). Enhanced sequence diagram for function modelling of
complex systems.
Karim, S., Liawatimena, S., Trisetyarso, A., Abbas, B. S., & Suparta, W. (2017, November).
Automating functional and structural software size measurement based on XML
Paraphrase This Document
Need a fresh take? Get an instant paraphrase of this document with our AI Paraphraser

7SOFTWARE ENGINEERING
structure of UML sequence diagram. In 2017 IEEE International Conference on
Cybernetics and Computational Intelligence (CyberneticsCom) (pp. 24-28). IEEE.
structure of UML sequence diagram. In 2017 IEEE International Conference on
Cybernetics and Computational Intelligence (CyberneticsCom) (pp. 24-28). IEEE.

8SOFTWARE ENGINEERING
Part 3:
Types of CRUD method and importance:
CRUD represents the four basic tasks that are create, read, update and delete for
persistence storage (Bures & Cerny, 2017). There are four types of CRUD method they are as
follows; DAVE that stands for delete, add, view and edit, CRUDE that means create, read,
update, delete and experience, BREAD means browse, read, edit, add and delete, CRAP is
create, replicate, append and process.
The data management process that is used to involve to manage the database or the
application that is already used are based on this CRUD method (Do et al., 2016). Not only
the programmer but also the user get affected by the CRUP method as it gives the user
allowance to create or add new entity or update or delete the existing elements.
Let, assume there is an ecommerce company. The customer can order a product from
their site. Below is a crud diagram for the scenario. All the types of crud method has been
applied in this scenario.
You're viewing a preview
Unlock full access by subscribing today!

9SOFTWARE ENGINEERING
References:
Bures, M., & Cerny, T. (2017, March). Static Testing Using Different Types of CRUD
Matrices. In International Conference on Information Science and Applications (pp.
594-602). Springer, Singapore.
Do, C., Hussey, D., Epperson, K., & Wells, D. M. (2016). Optimization method to determine
mass transfer variables in a PWR crud deposition risk assessment tool. Journal of
Nuclear Science and Technology, 53(10), 1476-1483.
Paraphrase This Document
Need a fresh take? Get an instant paraphrase of this document with our AI Paraphraser

10SOFTWARE ENGINEERING
Part 4:
Purpose of State Machine Diagram:
It is used to depict to behavior of the object that is state dependent. So it is called
behavioral diagram. It describes the different entity and its state and the previous features of
an entity can be modified by using this diagram (Shetty, Geetha & Kumar, 2017). State
machine diagram is also used to show the entity’s performance or response in the events and
how the entity interchange their state. It is also used to show the system’s dynamic features.
This diagram shows the different state of the systems that are initial state, transition, state,
fork, join, self-transition, composite state and final state.
Scenario:
Let, assume that there is travel agency. The agency helps people for generating rail
ticket. There are two payment options for making payment. One is by cash and another is via
online payment. The state machine diagram for the scenario is as follows:
First diagram:

11SOFTWARE ENGINEERING
Second diagram:
Second diagram:
You're viewing a preview
Unlock full access by subscribing today!

12SOFTWARE ENGINEERING
Sequence diagram:
Sequence diagram:
Paraphrase This Document
Need a fresh take? Get an instant paraphrase of this document with our AI Paraphraser

13SOFTWARE ENGINEERING
Both type of diagrams are describing the scenario. However, there are differences
between the diagrams (Campean & Yildirim, 2017). The state machine diagram is having
logical view of the functionalities. The sequence diagram is only aiming at a specific
framework. On the other hand, the SMD is stating the whole system.
References:
Campean, I. F., & Yildirim, U. (2017). Enhanced sequence diagram for function modelling of
complex systems.
Shetty, R., Geetha, M., & Kumar, A. P. (2017). Generation of Test Cases for Object Oriented
Software using UML State Machine Diagram. International Journal of Innovations in
Engineering and Technology, 8(2), 142-148.
1 out of 14
Related Documents

Your All-in-One AI-Powered Toolkit for Academic Success.
+13062052269
info@desklib.com
Available 24*7 on WhatsApp / Email
Unlock your academic potential
© 2024 | Zucol Services PVT LTD | All rights reserved.