ITECH1103 - Solar City Project: Power Usage Analysis and CO2 Emissions

Verified

Added on  2023/06/12

|26
|1577
|188
Report
AI Summary
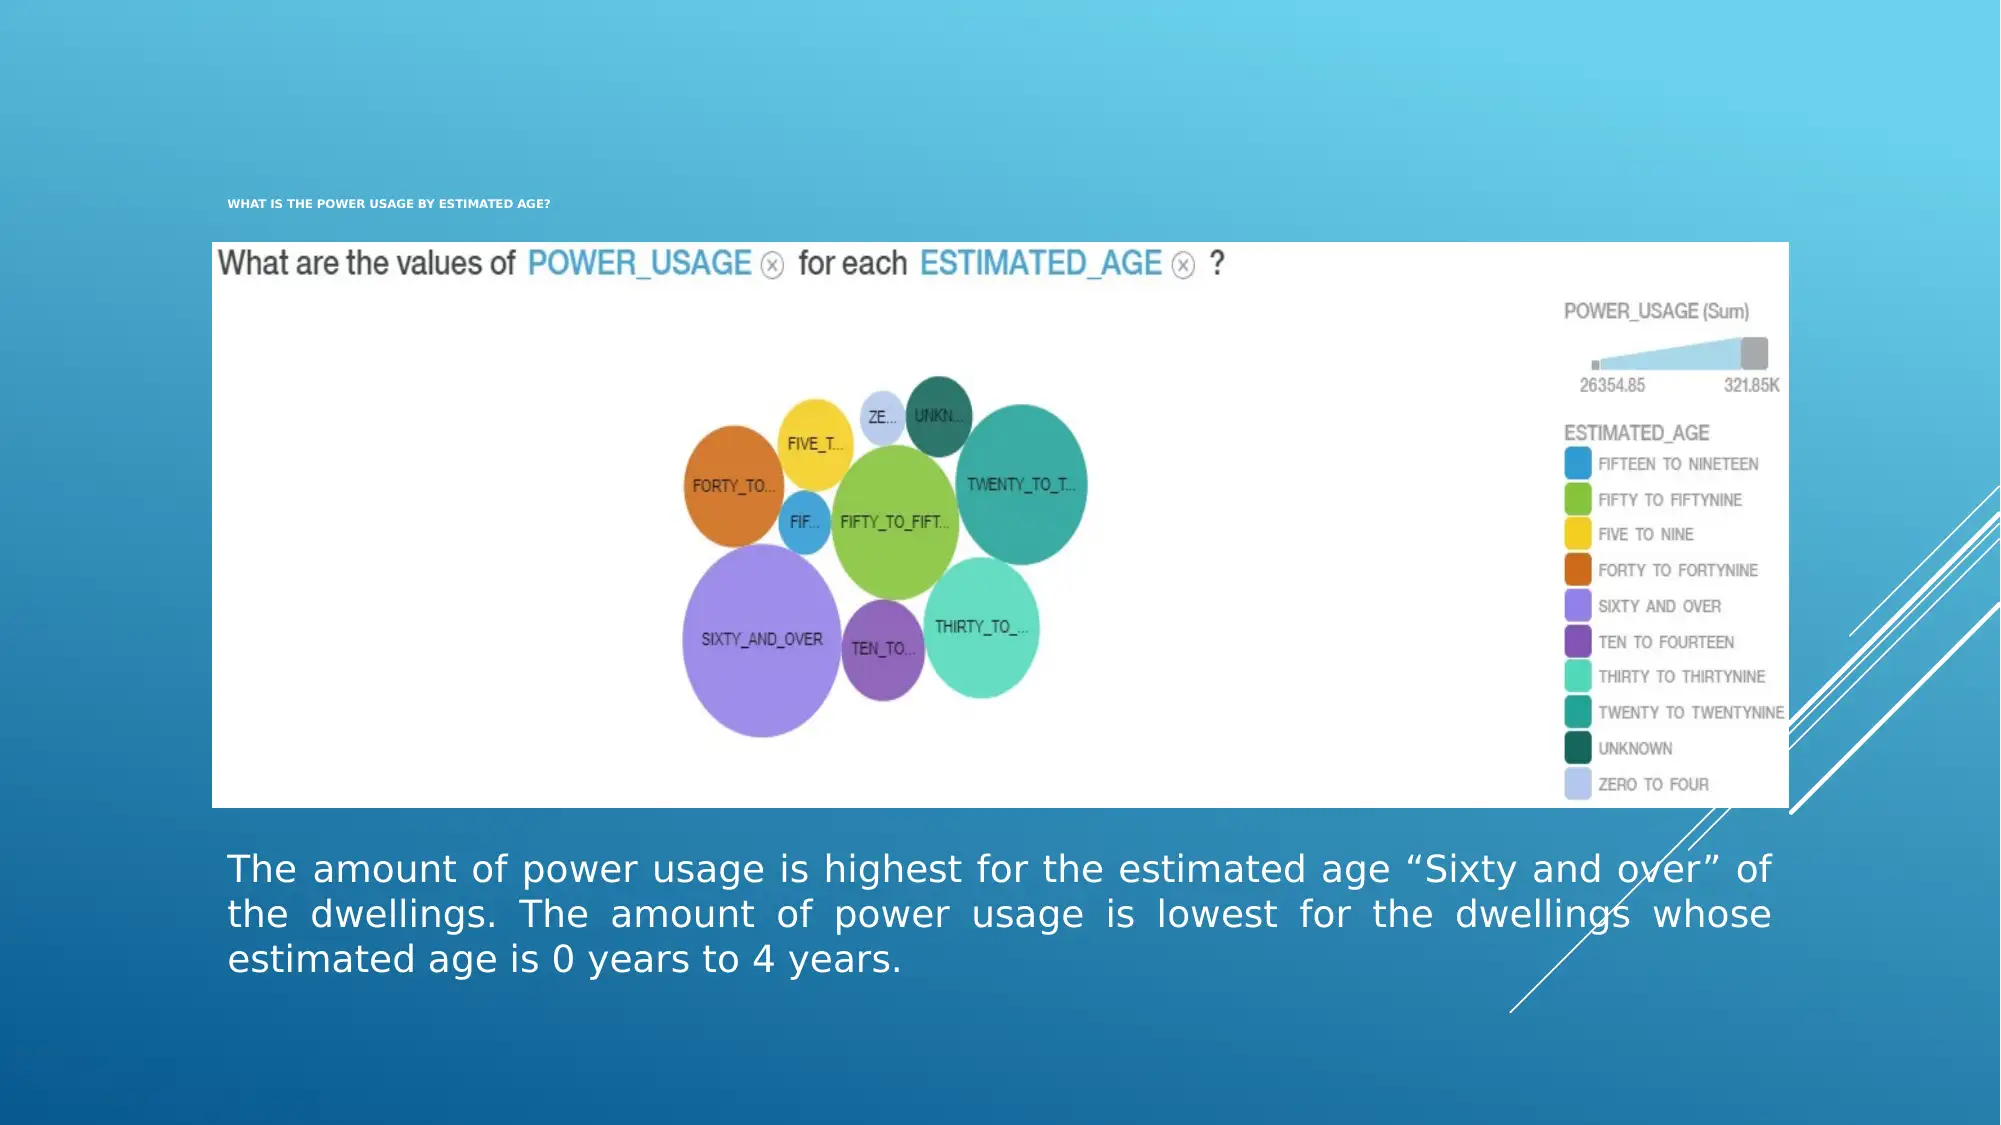
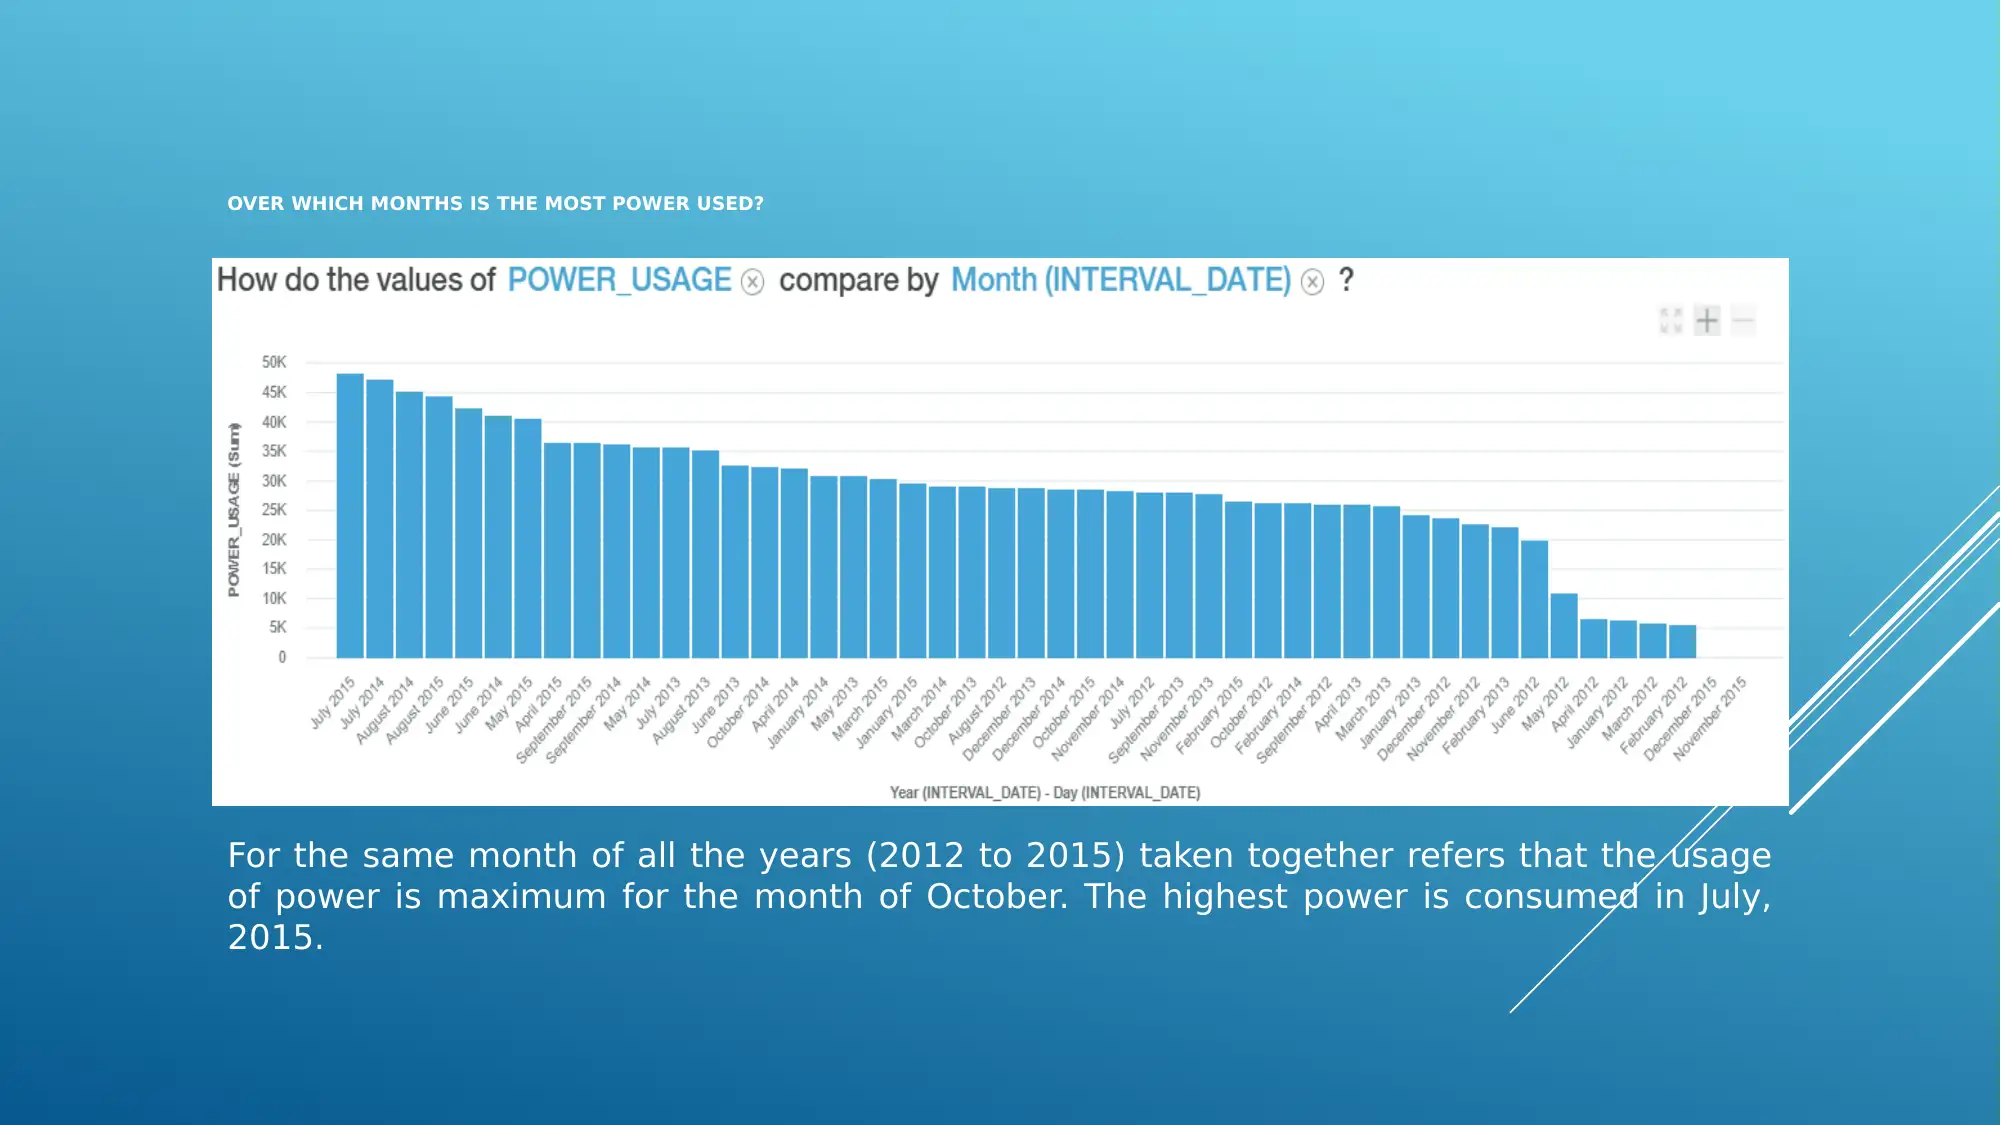
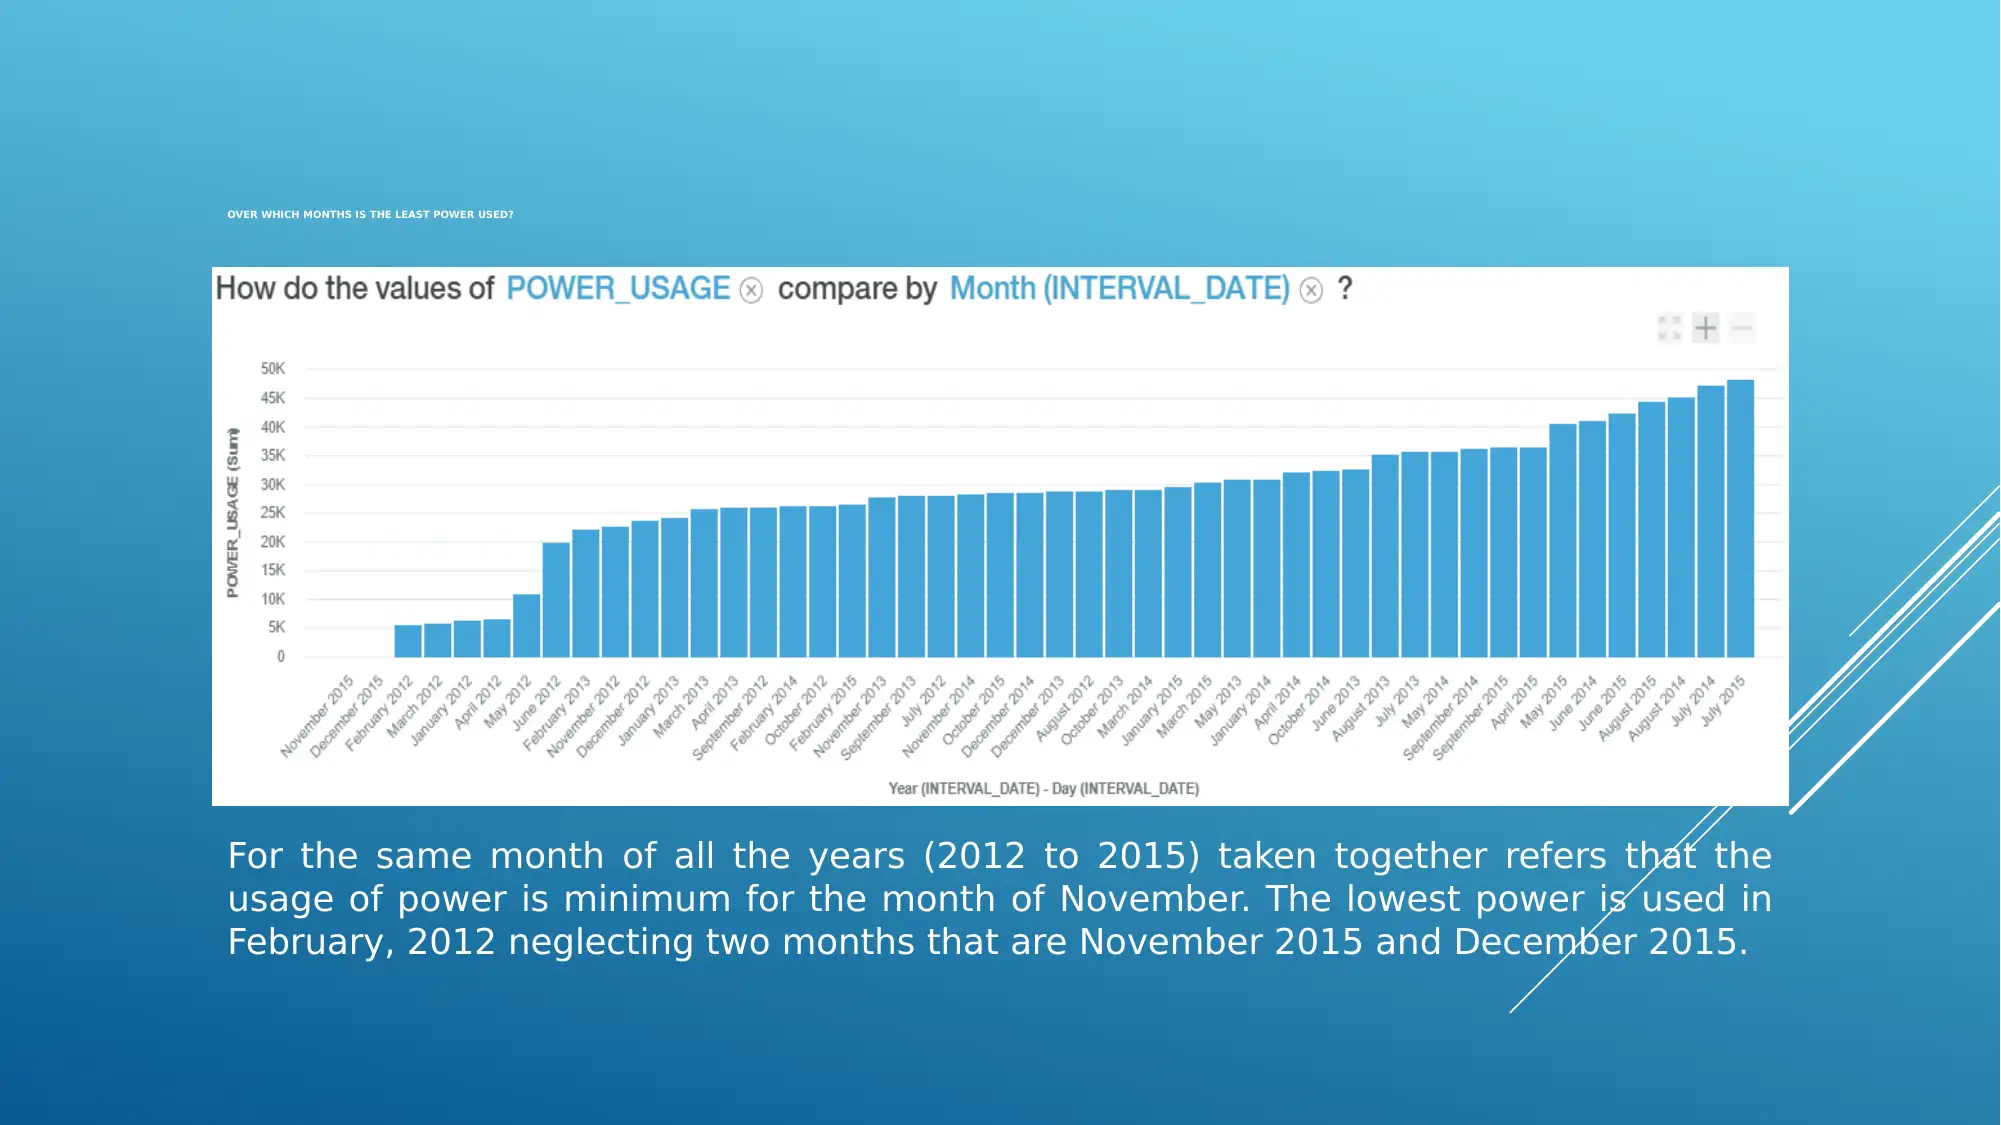
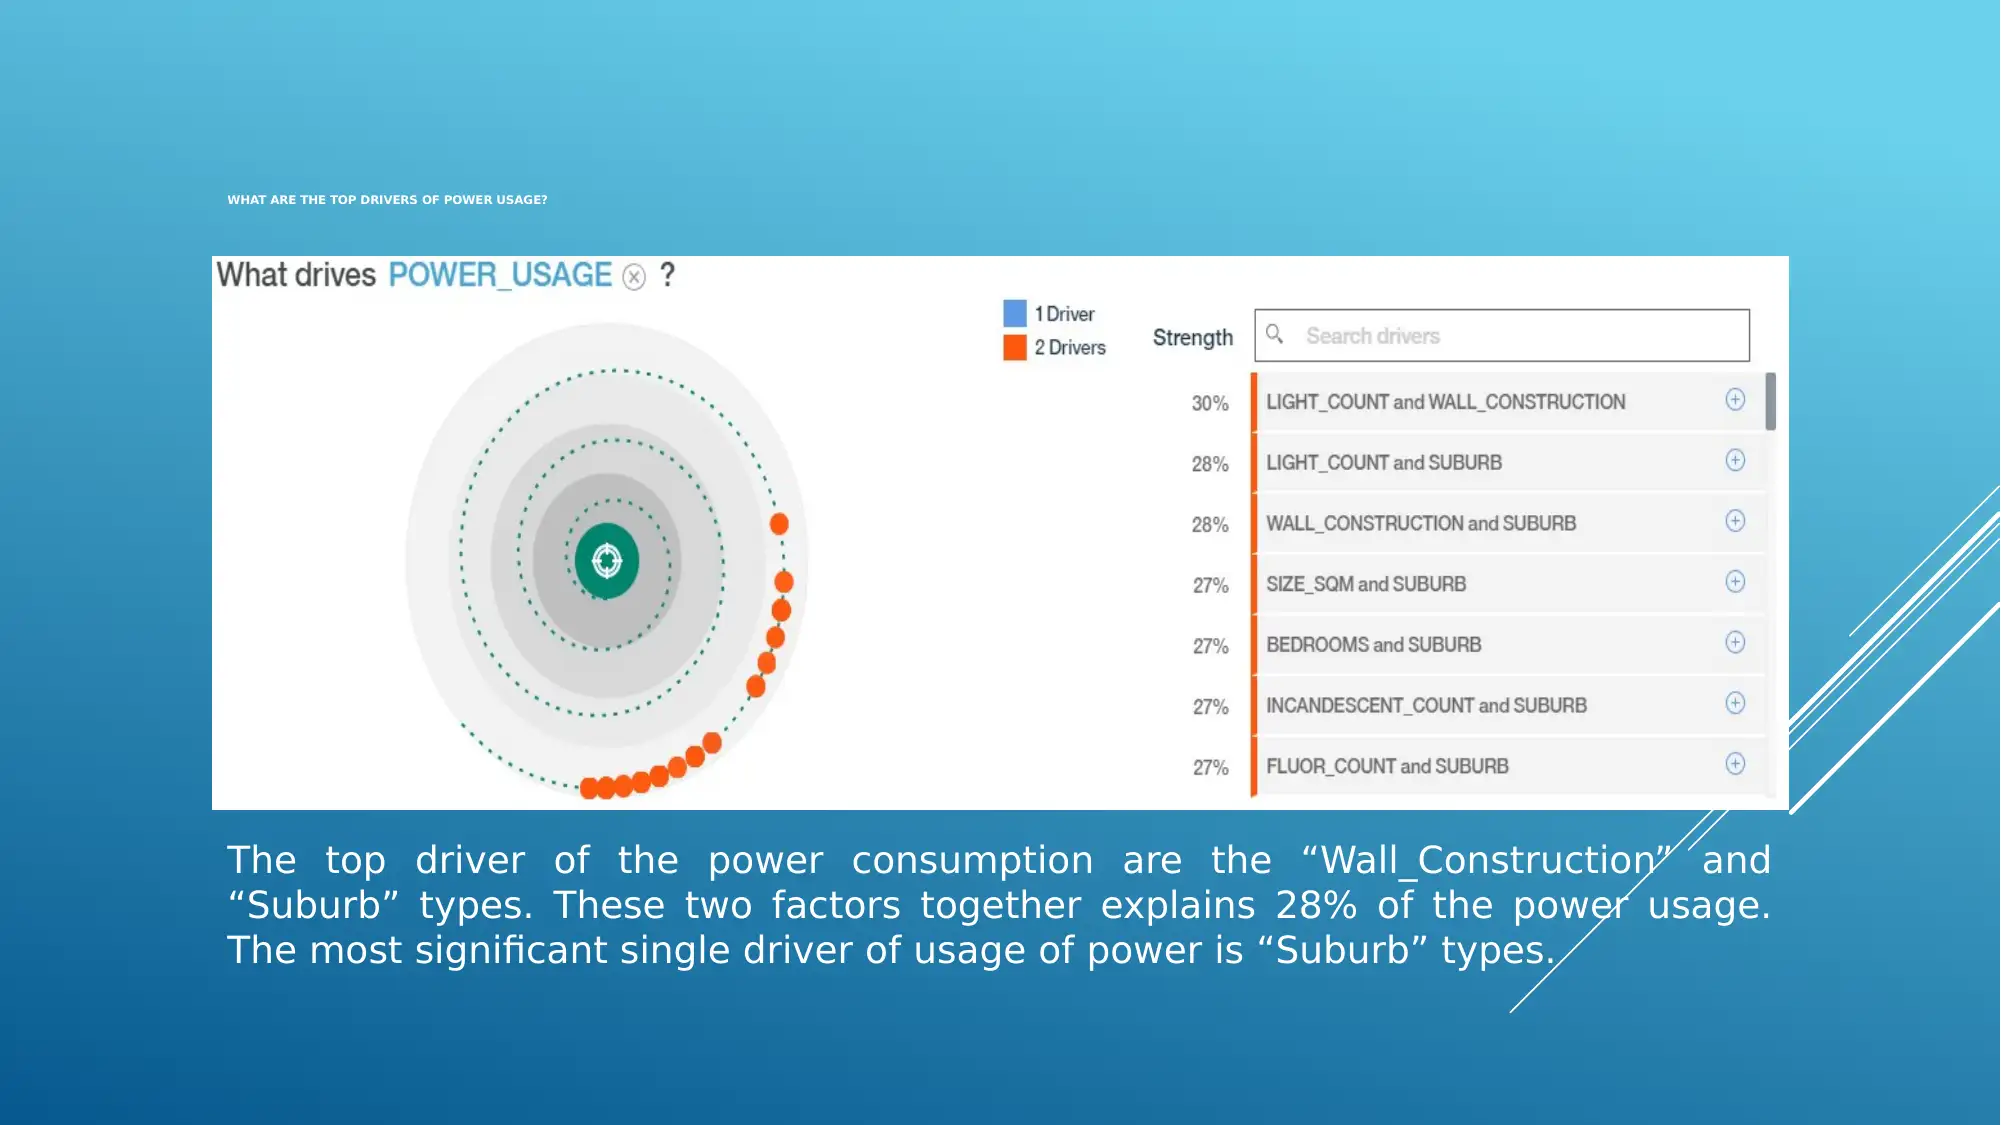
This report presents a comprehensive analysis of the Solar City Project data, focusing on power usage patterns across different demographics and dwelling characteristics. Key findings include the significant impact of roof color, PV capacity, insulation, dwelling age, and suburb type on energy consumption. The analysis identifies 'Wall_Construction' and 'Suburb' as the top drivers of power usage, with 'Portland' and 'Heywood' suburbs exhibiting the highest energy consumption. The report also explores the relationship between dwelling features like square meterage, number of lights, and window types on power usage, and concludes with recommendations for reducing energy consumption and CO2 emissions, such as promoting light-colored roofs, higher PV capacity, and avoiding brick constructions in high-consumption suburbs. The report emphasizes the importance of considering wall construction and suburb type in predictive models for future energy demand.
Document Page
SOLAR CITY PROJECT
- Business Intelligence and Big Data
Analytics
tabler-icon-diamond-filled.svg

Paraphrase This Document

Need a fresh take? Get an instant paraphrase of this document with our AI Paraphraser
Document Page
INTRODUCTION AND BACKGROUND
The University of Ballarat accomplished the research report on the
basis of “Solar city project” data.
The data for analysis was collected from households and businesses
across two regions such as “Loddon Mallee” and “Grampians”.
The project focuses a number of variables that may impact the
energy consumption in various households of different suburbs of
Australia.
The visualizations as well as data analysis of technology regarding solar
energy distillate on three kinds of features that are-
Geographic characteristics”
Adoption of solar energy technologies”
Physical characteristics of the dwellings”
The crucial objective of the research project is to comprehend the
significant drivers of the consumption of power.
Document Page
WHAT IS THE CONTRIBUTION OF POWER USAGE OVER A YEAR BY ROOF COLOUR?
The power use is comparatively lesser for light coloured roofs. Mostly power is
used in dark coloured roofs followed by intermediate coloured rooms over 2012,
2013 and 2015.
Document Page
WHAT IS THE CONTRIBUTION OF POWER USAGE OVER A YEAR BY PV_CAPACITY?
The low PV_capacity (0 to 1500) consumes most energy. Correspondingly, higher
PV_capacity that over 1500 results lesser power usage. In 2014, the usage of
power is highest for the PV_capacity 0 to 1500.
tabler-icon-diamond-filled.svg

Paraphrase This Document

Need a fresh take? Get an instant paraphrase of this document with our AI Paraphraser
Document Page
WHAT IS THE CONTRIBUTION OF POWER USAGE OVER A YEAR BY PV_CAPACITY AND INSULATION?
For lowest PV_capacity (0) and insulation = 960, the usage of power is highest in 2014. The
power usage is second highest when PV_capacity is 0 and insulation is 960 in both 2013 and
2015.
Document Page
WHAT IS THE POWER USAGE BY ESTIMATED AGE?
The amount of power usage is highest for the estimated age “Sixty and over” of
the dwellings. The amount of power usage is lowest for the dwellings whose
estimated age is 0 years to 4 years.
Document Page
OVER WHICH MONTHS IS THE MOST POWER USED?
For the same month of all the years (2012 to 2015) taken together refers that the usage
of power is maximum for the month of October. The highest power is consumed in July,
2015.
tabler-icon-diamond-filled.svg

Paraphrase This Document

Need a fresh take? Get an instant paraphrase of this document with our AI Paraphraser
Document Page
OVER WHICH MONTHS IS THE LEAST POWER USED?
For the same month of all the years (2012 to 2015) taken together refers that the
usage of power is minimum for the month of November. The lowest power is used in
February, 2012 neglecting two months that are November 2015 and December 2015.
Document Page
WHAT ARE THE TOP DRIVERS OF POWER USAGE?
The top driver of the power consumption are the “Wall_Construction” and
“Suburb” types. These two factors together explains 28% of the power usage.
The most significant single driver of usage of power is “Suburb” types.
Document Page
WHICH SUBURBS HAVE THE MOST HOUSES WITH PV_CAPACITY?
The “Heywood” suburb has highest number of houses that have non-null PV_Capacity.
tabler-icon-diamond-filled.svg

Paraphrase This Document

Need a fresh take? Get an instant paraphrase of this document with our AI Paraphraser
Document Page
WHICH AGE HOUSES ARE MORE LIKELY TO HAVE PV_CAPACITY?
The age house that have PV_Capacity are most likely when PV_Capacity is 1500
and estimated age is “Thirty to Thirty-nine”.
Document Page
ARE HOUSES THAT ARE OWNED MORE LIKELY TO USE LESS POWER THAN THE ONES THAT ARE RENTED?
The power usage in “Owned” houses is higher than power usage in “Rented”
houses.
chevron_up_icon
1 out of 26
circle_padding
hide_on_mobile
zoom_out_icon
[object Object]