Macroeconomics: Analyzing Economic Growth with Solow Model Homework

Verified

Added on  2022/09/18

|7
|1095
|18
Homework Assignment
AI Summary
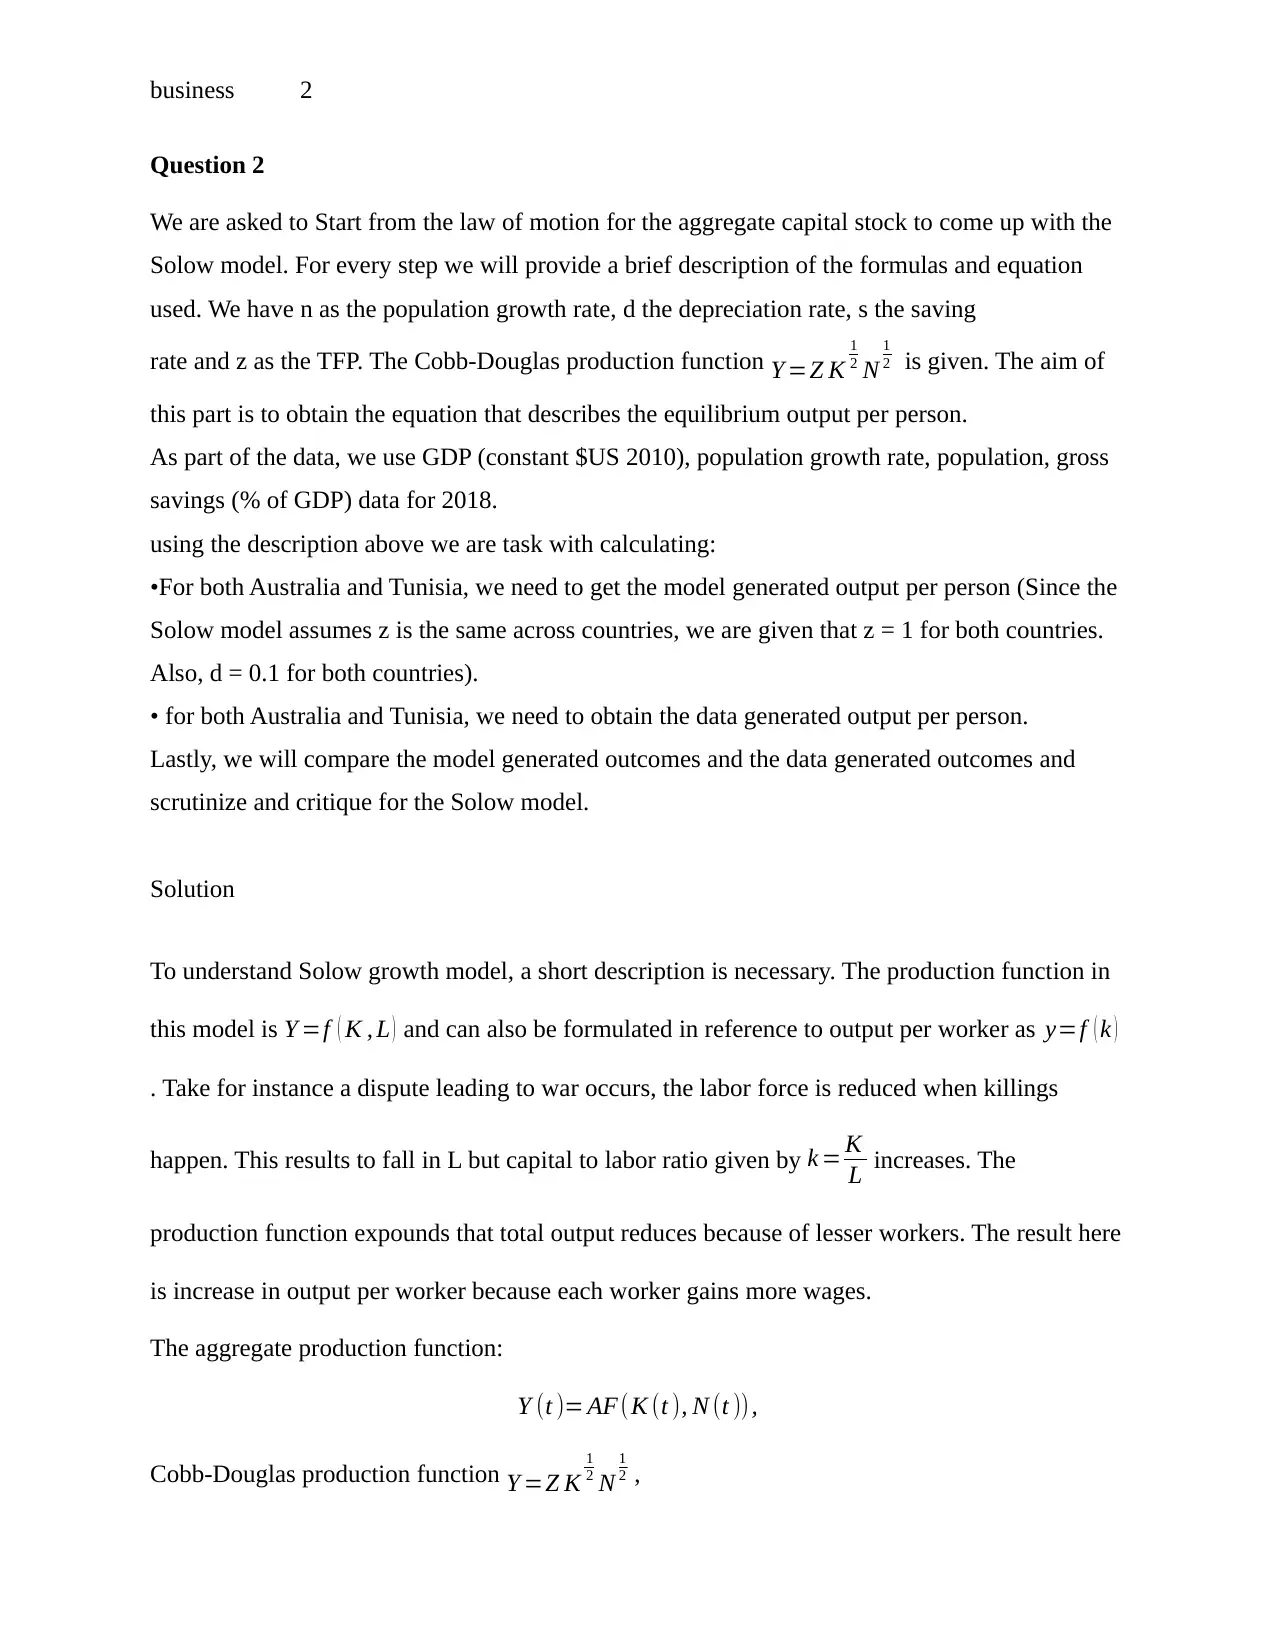
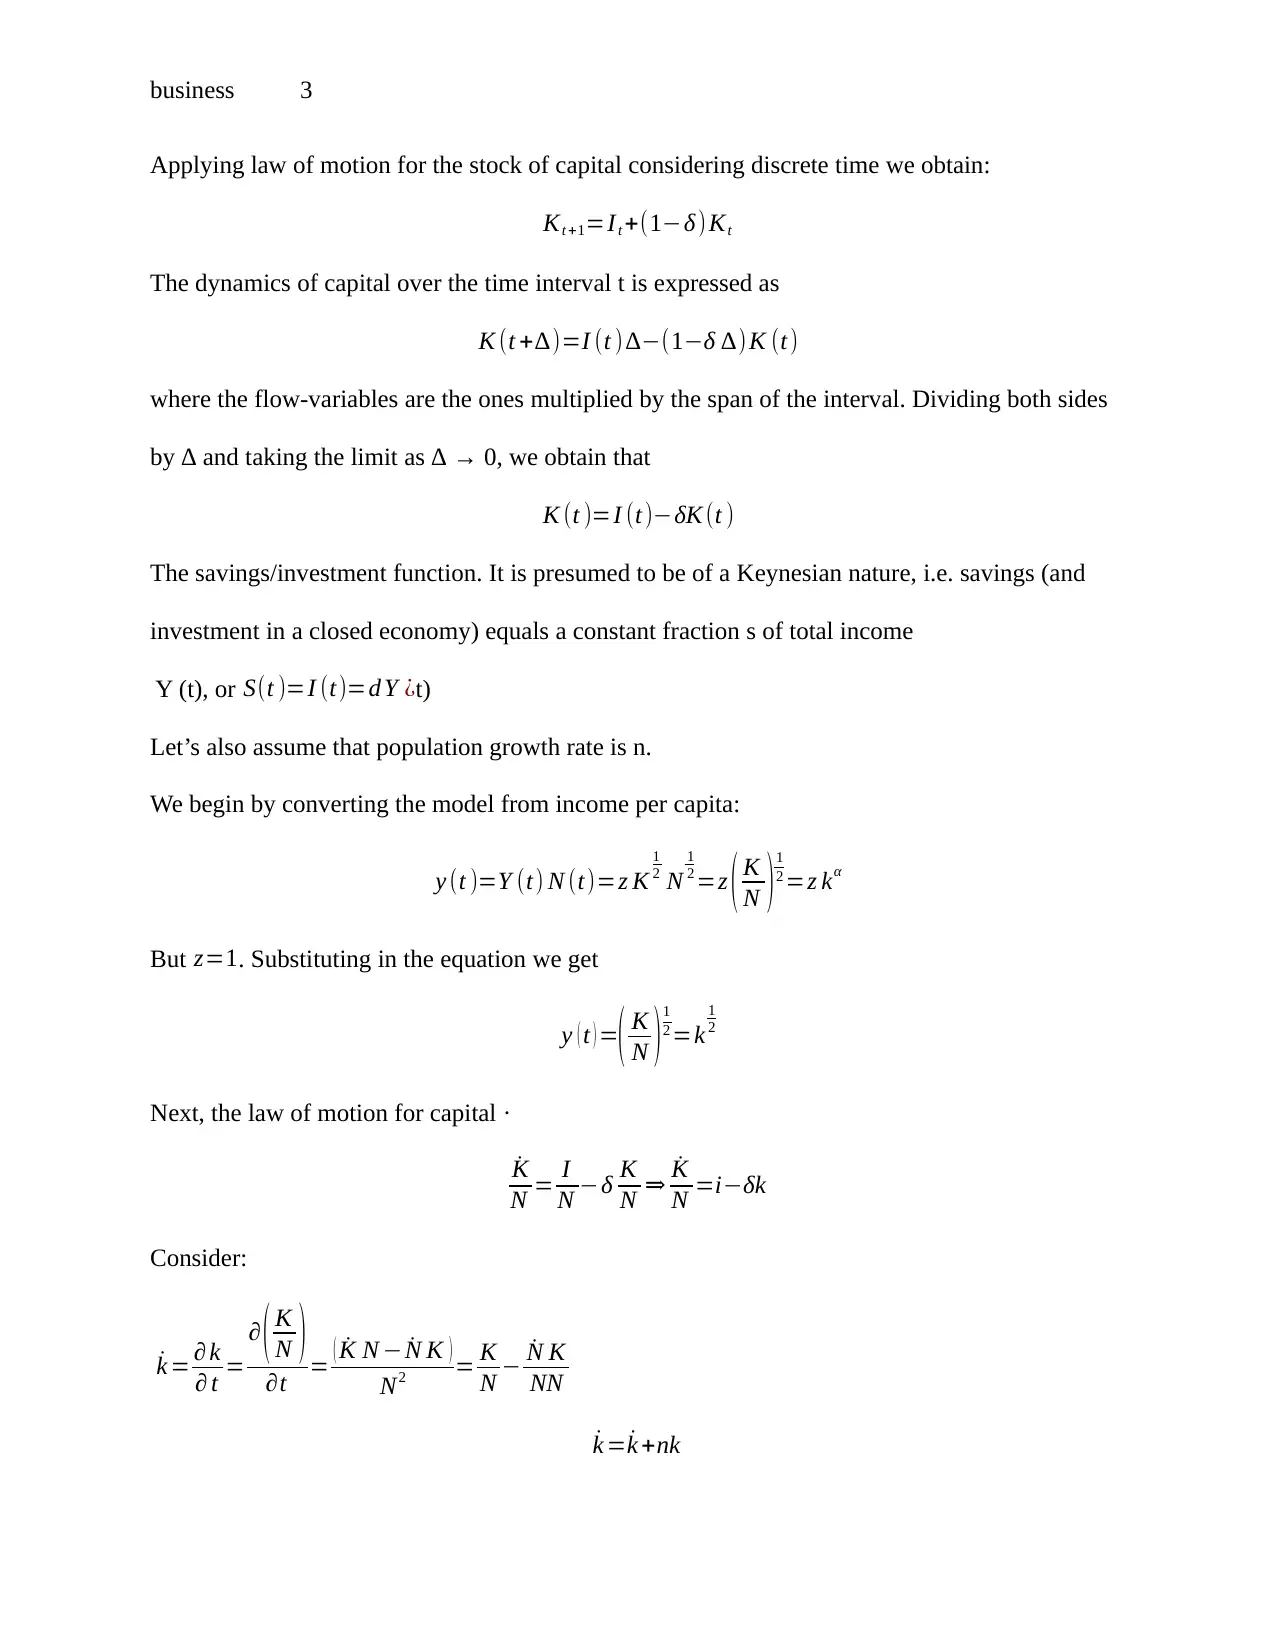
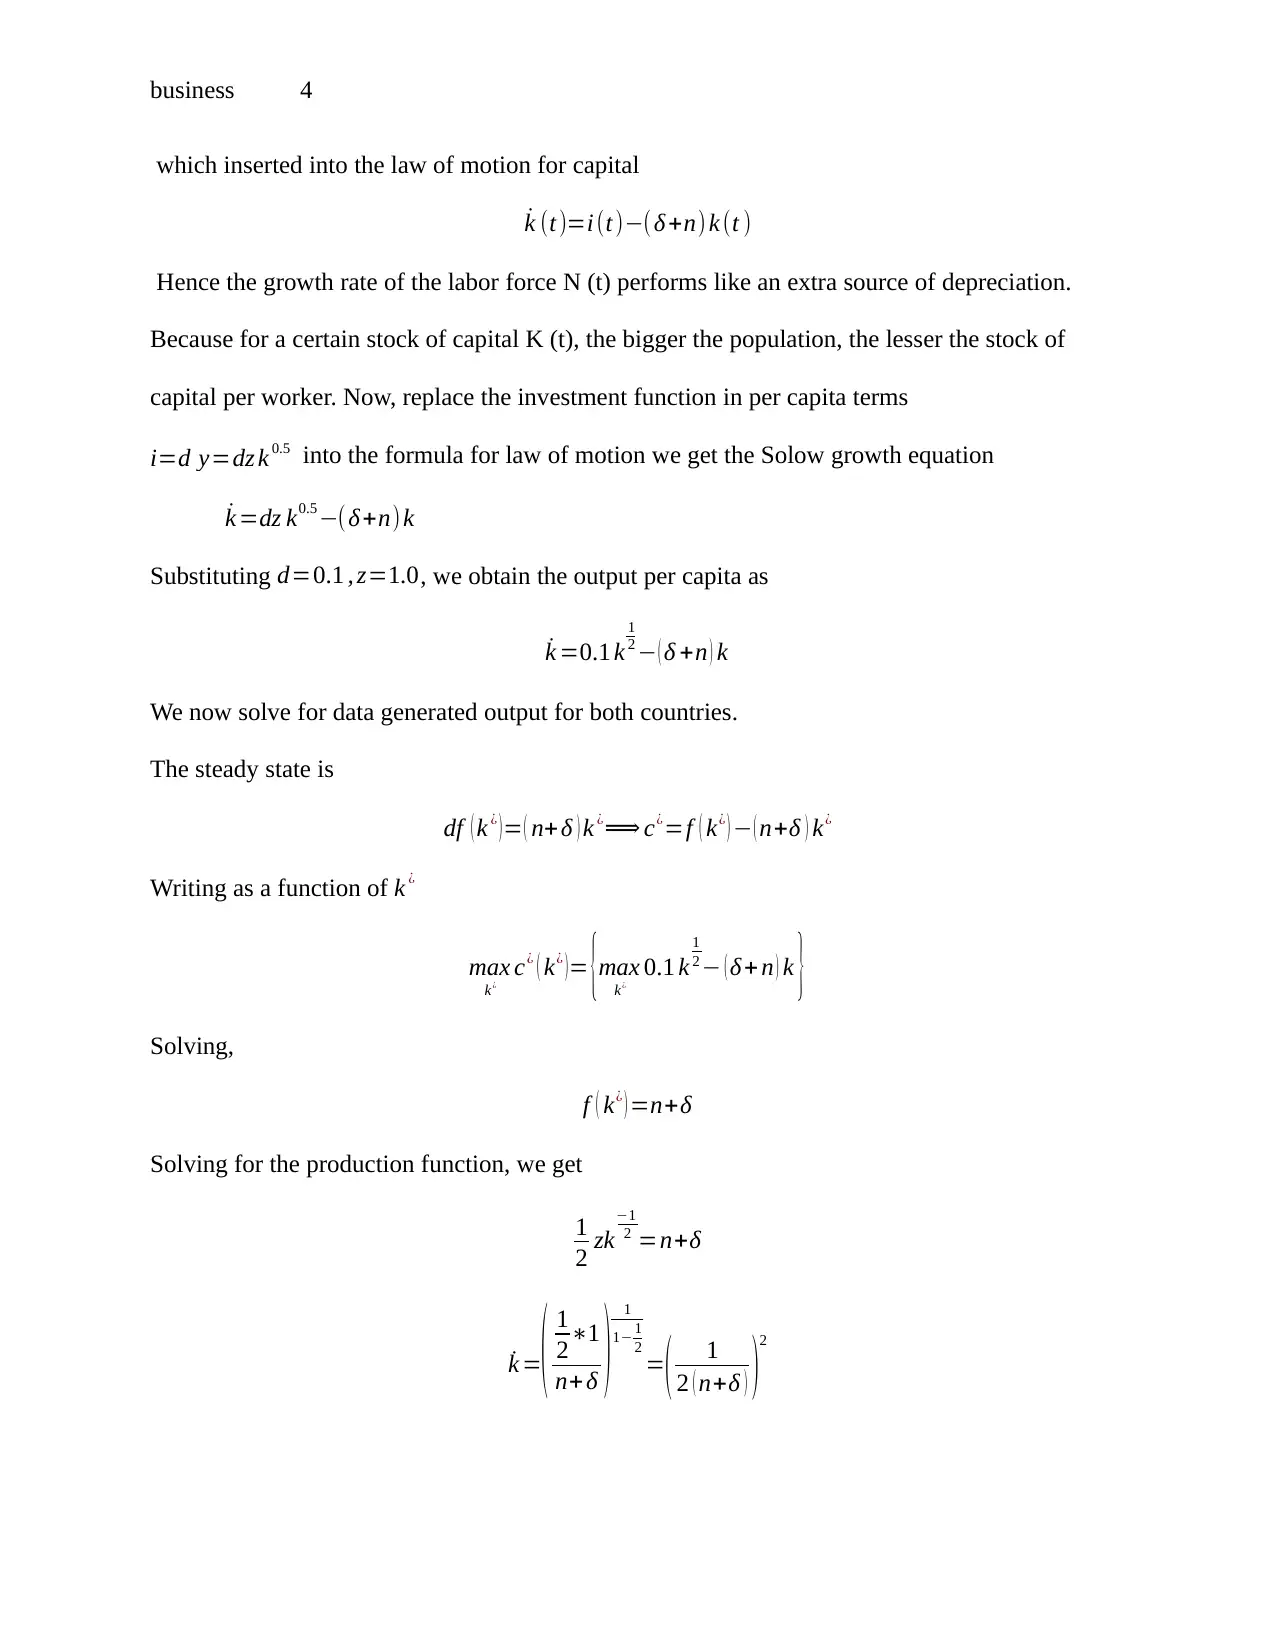
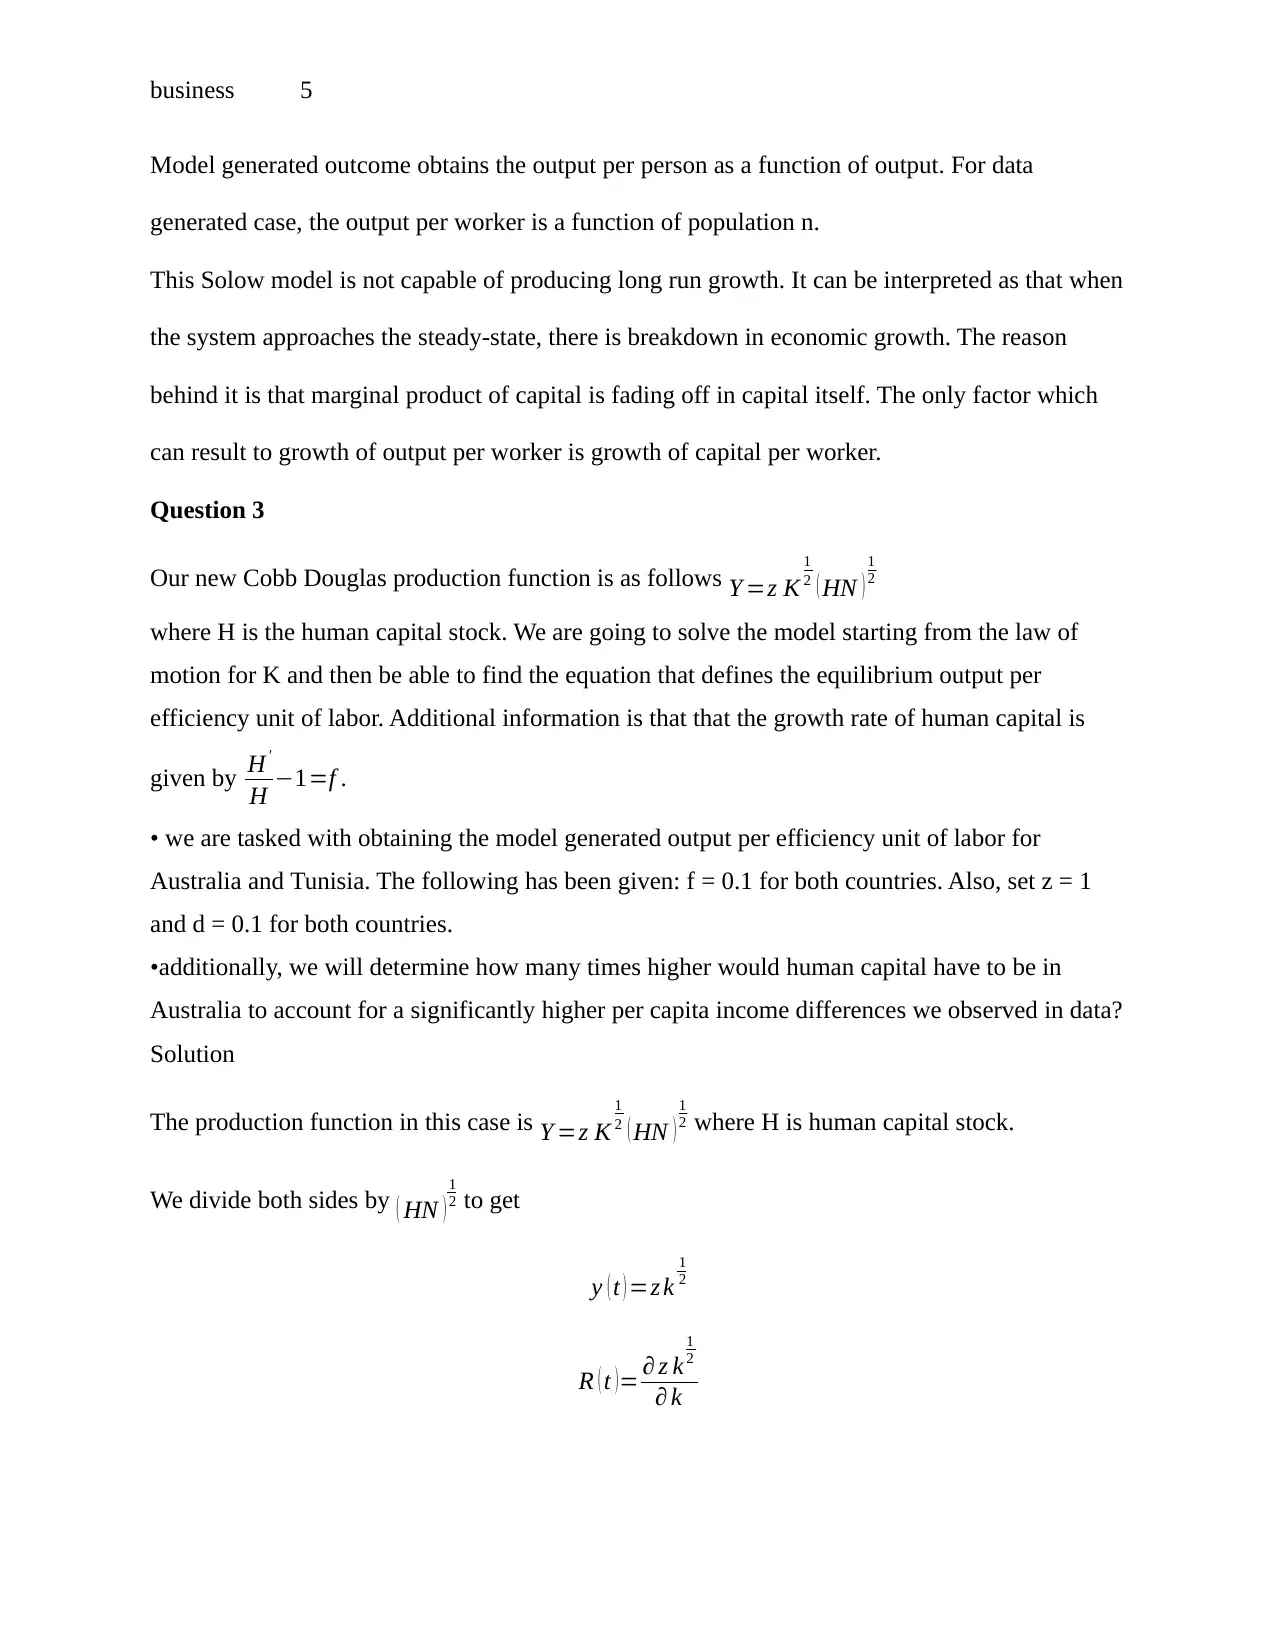
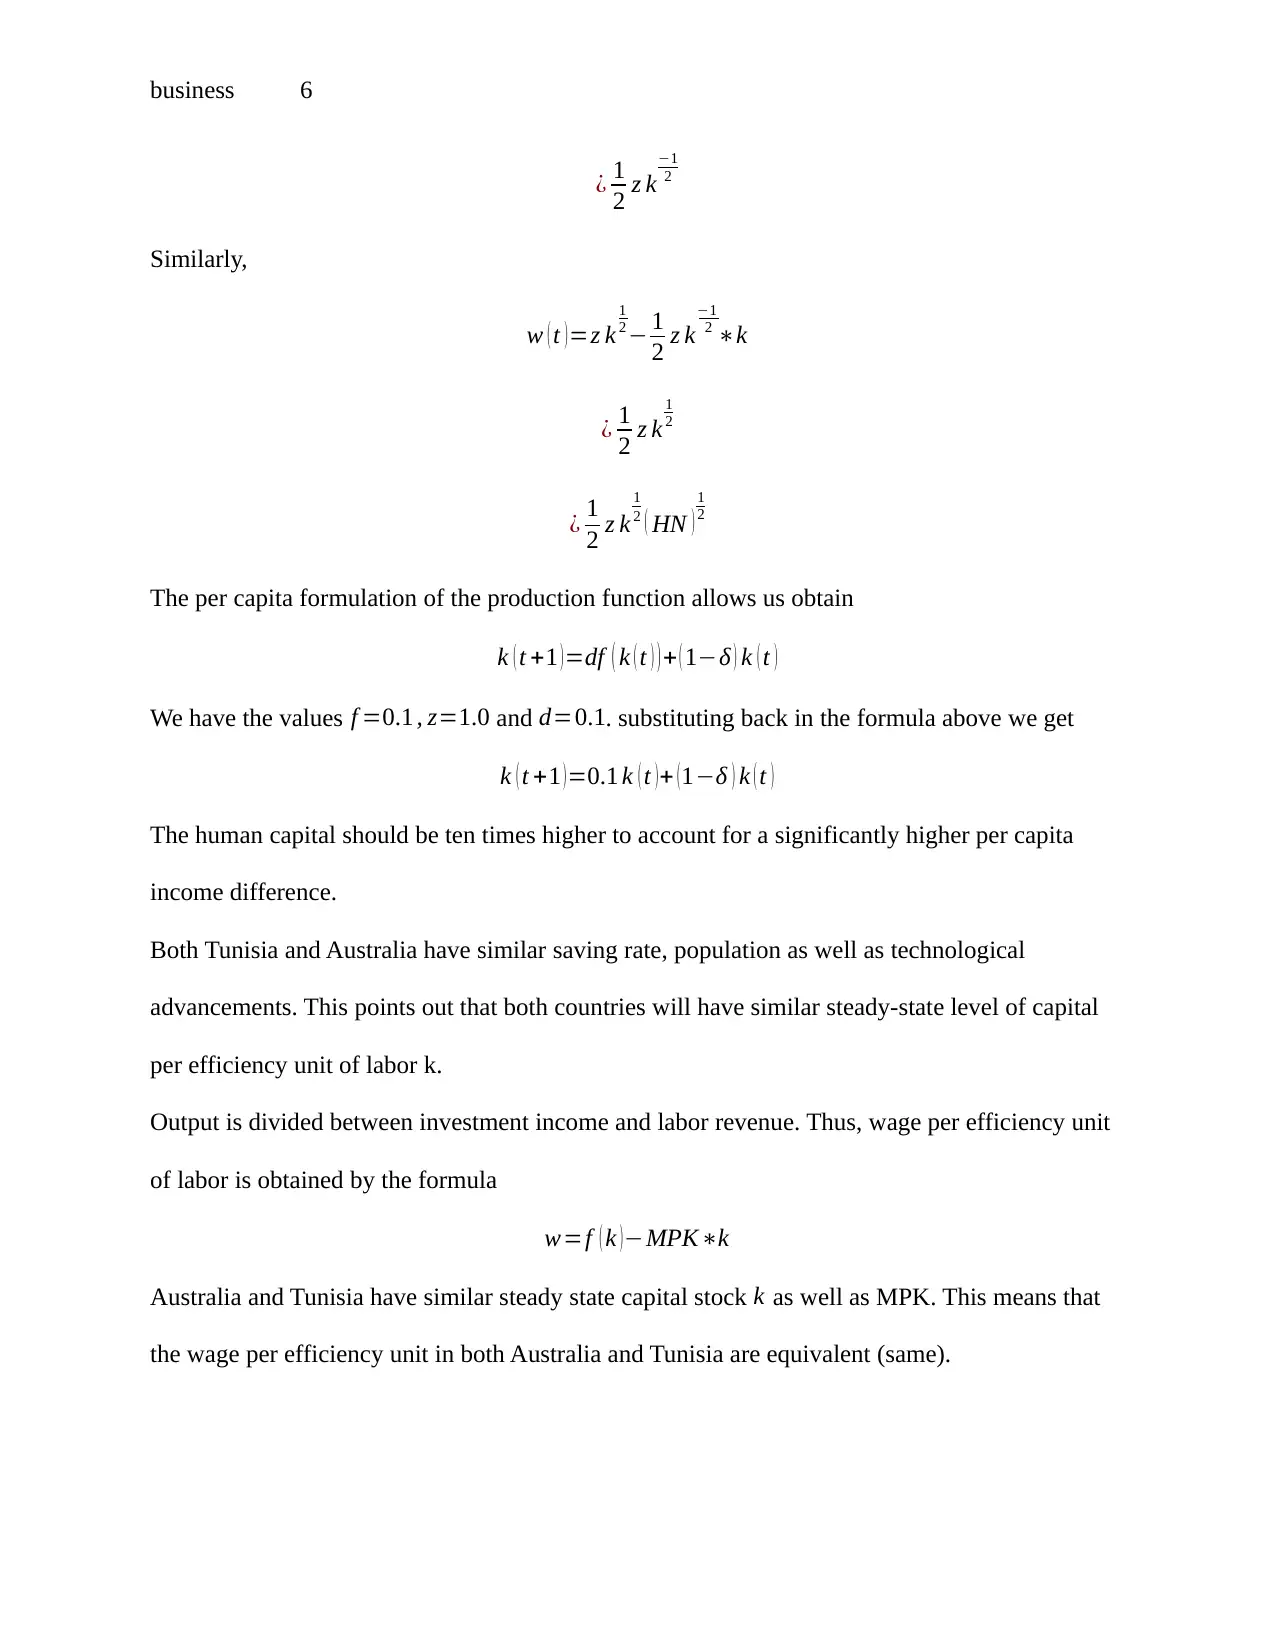
This document presents a comprehensive solution to a macroeconomics homework assignment centered on the Solow growth model. The assignment involves analyzing the model's components, including the Cobb-Douglas production function, and calculating output per person for Australia and Tunisia using provided data such as GDP, population growth, and savings rates. The solution details the derivation of equations for capital accumulation and output per capita, incorporating concepts like depreciation, population growth, and savings rates. It also addresses a modified production function that incorporates human capital, exploring its impact on output and wages. The analysis includes comparing model-generated and data-generated outcomes, scrutinizing the Solow model's limitations, and calculating the implications of human capital differences on per capita income. The document also addresses the role of technological advancements and steady-state capital levels in determining wages across different countries.
tabler-icon-diamond-filled.svg

Contribute Materials

Your contribution can guide someone’s learning journey. Share your documents today.
Document Page
Running head: business 1
economics
[Author Name(s), First M. Last, Omit Titles and Degrees]
[Institutional Affiliation(s)]
tabler-icon-diamond-filled.svg

Secure Best Marks with AI Grader

Need help grading? Try our AI Grader for instant feedback on your assignments.
Document Page
business 2
Question 2
We are asked to Start from the law of motion for the aggregate capital stock to come up with the
Solow model. For every step we will provide a brief description of the formulas and equation
used. We have n as the population growth rate, d the depreciation rate, s the saving
rate and z as the TFP. The Cobb-Douglas production function Y =Z K
1
2 N
1
2 is given. The aim of
this part is to obtain the equation that describes the equilibrium output per person.
As part of the data, we use GDP (constant $US 2010), population growth rate, population, gross
savings (% of GDP) data for 2018.
using the description above we are task with calculating:
•For both Australia and Tunisia, we need to get the model generated output per person (Since the
Solow model assumes z is the same across countries, we are given that z = 1 for both countries.
Also, d = 0.1 for both countries).
• for both Australia and Tunisia, we need to obtain the data generated output per person.
Lastly, we will compare the model generated outcomes and the data generated outcomes and
scrutinize and critique for the Solow model.
Solution
To understand Solow growth model, a short description is necessary. The production function in
this model is Y =f ( K , L ) and can also be formulated in reference to output per worker as y=f ( k )
. Take for instance a dispute leading to war occurs, the labor force is reduced when killings
happen. This results to fall in L but capital to labor ratio given by k = K
L increases. The
production function expounds that total output reduces because of lesser workers. The result here
is increase in output per worker because each worker gains more wages.
The aggregate production function:
Y (t )= AF(K (t ), N (t )) ,
Cobb-Douglas production function Y =Z K
1
2 N
1
2 ,
Document Page
business 3
Applying law of motion for the stock of capital considering discrete time we obtain:
Kt +1=I t +(1δ)Kt
The dynamics of capital over the time interval t is expressed as
K (t +)=I (t ) (1δ ) K (t)
where the flow-variables are the ones multiplied by the span of the interval. Dividing both sides
by ∆ and taking the limit as ∆ → 0, we obtain that
K (t )=I (t)δK (t )
The savings/investment function. It is presumed to be of a Keynesian nature, i.e. savings (and
investment in a closed economy) equals a constant fraction s of total income
Y (t), or S(t )=I (t)=d Y ¿t)
Let’s also assume that population growth rate is n.
We begin by converting the model from income per capita:
y (t )=Y (t) N (t)=z K
1
2 N
1
2 =z ( K
N ) 1
2 =z kα
But z=1. Substituting in the equation we get
y ( t ) =( K
N )1
2 =k
1
2
Next, the law of motion for capital ·
˙K
N = I
N δ K
N ˙K
N =iδk
Consider:
˙k = k
t =
( K
N )
t = ( ˙K N ˙N K )
N2 = K
N ˙N K
NN
˙k = ˙k +nk
Document Page
business 4
which inserted into the law of motion for capital
˙k (t)=i(t)(δ +n) k (t )
Hence the growth rate of the labor force N (t) performs like an extra source of depreciation.
Because for a certain stock of capital K (t), the bigger the population, the lesser the stock of
capital per worker. Now, replace the investment function in per capita terms
i=d y=dz k 0.5 into the formula for law of motion we get the Solow growth equation
˙k =dz k0.5(δ +n) k
Substituting d=0.1 , z=1.0, we obtain the output per capita as
˙k =0.1 k
1
2 ( δ +n ) k
We now solve for data generated output for both countries.
The steady state is
df ( k ¿ )= ( n+δ ) k ¿ c¿=f ( k¿ ) ( n+δ ) k¿
Writing as a function of k ¿
max
k¿
c¿ ( k¿ ) = {max
k¿
0.1 k
1
2 ( δ+ n ) k }
Solving,
f ( k¿ ) =n+δ
Solving for the production function, we get
1
2 zk
1
2 =n+δ
˙k =( 1
21
n+ δ ) 1
1 1
2
=
( 1
2 ( n+δ ) )
2
tabler-icon-diamond-filled.svg

Secure Best Marks with AI Grader

Need help grading? Try our AI Grader for instant feedback on your assignments.
Document Page
business 5
Model generated outcome obtains the output per person as a function of output. For data
generated case, the output per worker is a function of population n.
This Solow model is not capable of producing long run growth. It can be interpreted as that when
the system approaches the steady-state, there is breakdown in economic growth. The reason
behind it is that marginal product of capital is fading off in capital itself. The only factor which
can result to growth of output per worker is growth of capital per worker.
Question 3
Our new Cobb Douglas production function is as follows Y =z K
1
2 ( HN )
1
2
where H is the human capital stock. We are going to solve the model starting from the law of
motion for K and then be able to find the equation that defines the equilibrium output per
efficiency unit of labor. Additional information is that that the growth rate of human capital is
given by H'
H 1=f .
• we are tasked with obtaining the model generated output per efficiency unit of labor for
Australia and Tunisia. The following has been given: f = 0.1 for both countries. Also, set z = 1
and d = 0.1 for both countries.
•additionally, we will determine how many times higher would human capital have to be in
Australia to account for a significantly higher per capita income differences we observed in data?
Solution
The production function in this case is Y =z K
1
2 ( HN )
1
2 where H is human capital stock.
We divide both sides by ( HN )
1
2 to get
y ( t ) =z k
1
2
R ( t )= z k
1
2
k
Document Page
business 6
¿ 1
2 z k
1
2
Similarly,
w ( t )=z k
1
2 1
2 z k
1
2 k
¿ 1
2 z k
1
2
¿ 1
2 z k
1
2 ( HN )
1
2
The per capita formulation of the production function allows us obtain
k ( t +1 )=df ( k ( t ) ) + ( 1δ ) k ( t )
We have the values f =0.1 , z=1.0 and d=0.1. substituting back in the formula above we get
k ( t +1 )=0.1 k ( t )+ (1δ ) k ( t )
The human capital should be ten times higher to account for a significantly higher per capita
income difference.
Both Tunisia and Australia have similar saving rate, population as well as technological
advancements. This points out that both countries will have similar steady-state level of capital
per efficiency unit of labor k.
Output is divided between investment income and labor revenue. Thus, wage per efficiency unit
of labor is obtained by the formula
w=f ( k )MPKk
Australia and Tunisia have similar steady state capital stock k as well as MPK. This means that
the wage per efficiency unit in both Australia and Tunisia are equivalent (same).
Document Page
business 7
It is important to understand that workers are only interested in wage per unit labor and not wage
per efficiency unit. Practically, it is possible to track wage per unit labor as opposed to wage per
efficiency unit. We relate wage per unit labor to wage per efficiency unit labor by the formula
wage per unit of labor L=wE
Therefore, the wage per unit of labor is higher in Australia as compared to Tunisia.
chevron_up_icon
1 out of 7
circle_padding
hide_on_mobile
zoom_out_icon
logo.png

Your All-in-One AI-Powered Toolkit for Academic Success.

Available 24*7 on WhatsApp / Email

[object Object]