Statistics Assignment: Probability Distributions and Hypothesis Test
VerifiedAdded on 2023/06/09
|9
|1338
|155
Homework Assignment
AI Summary
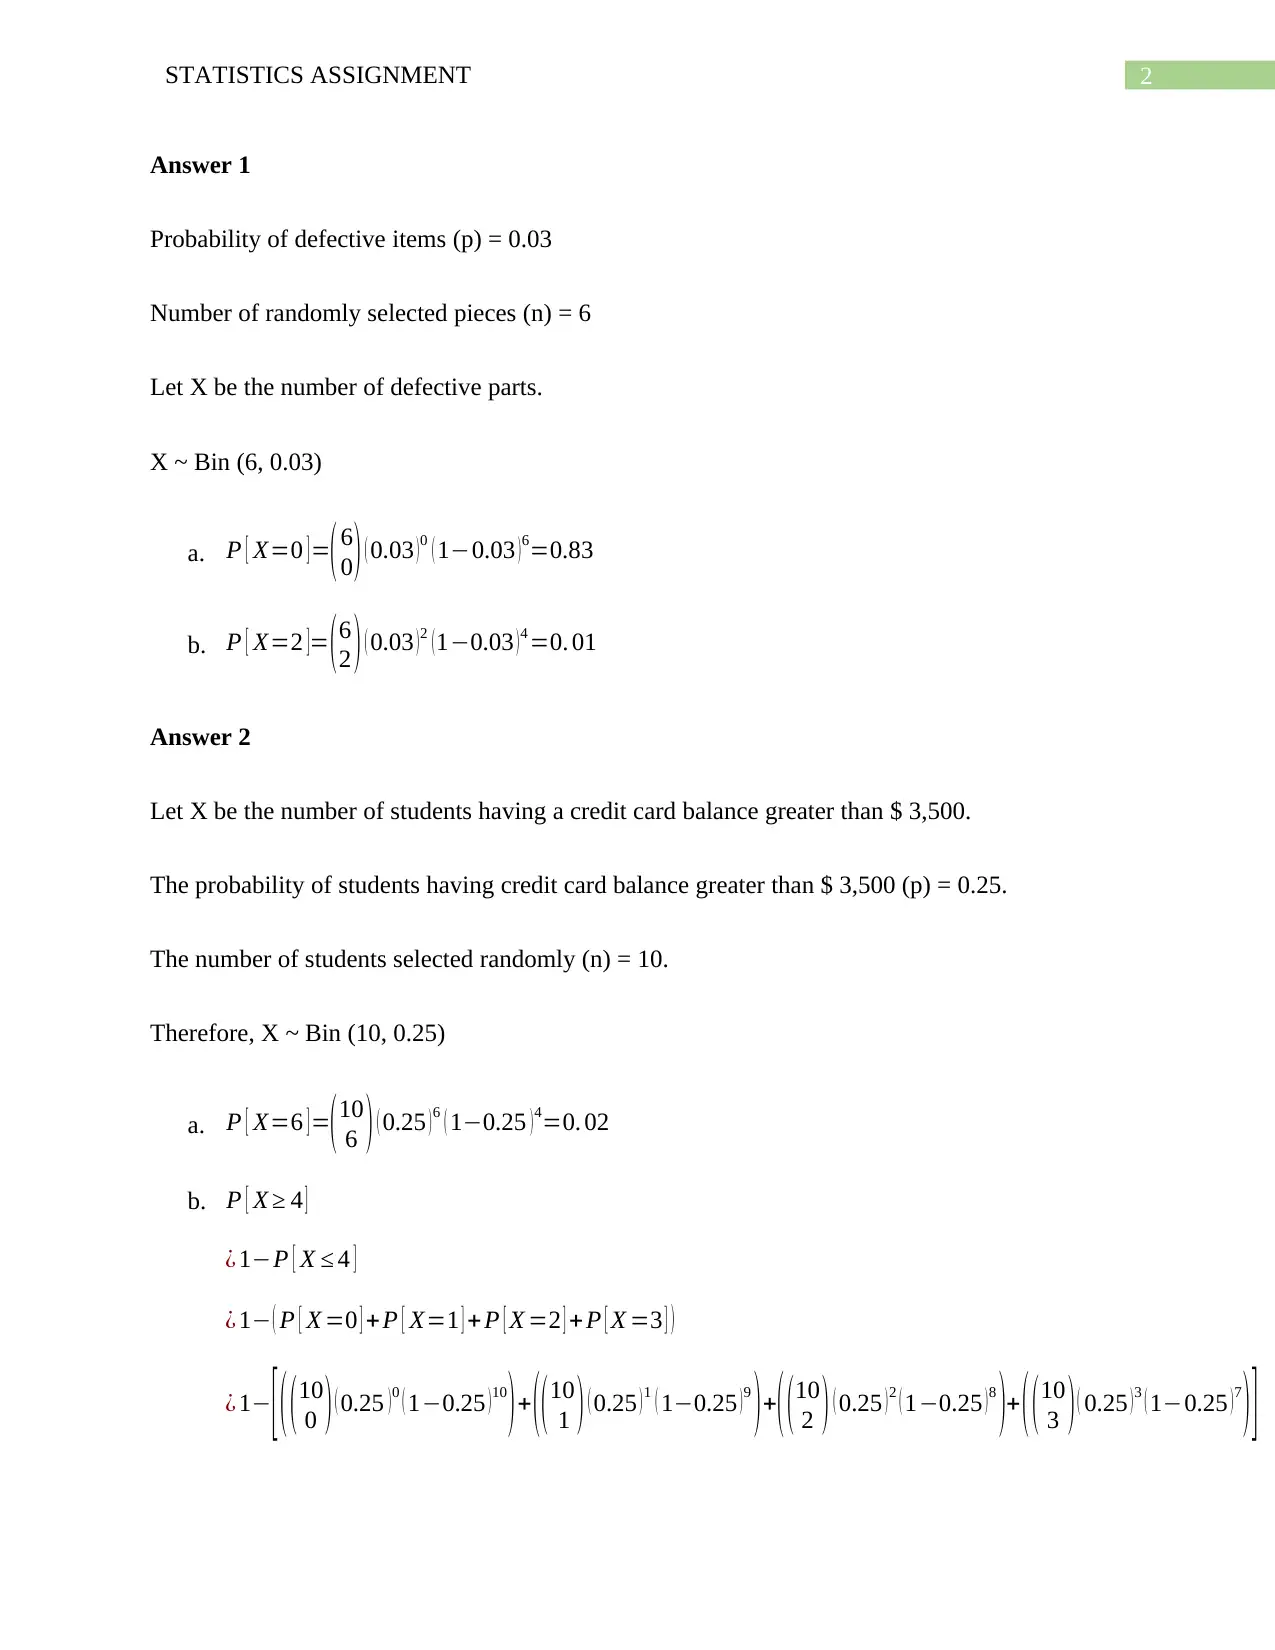
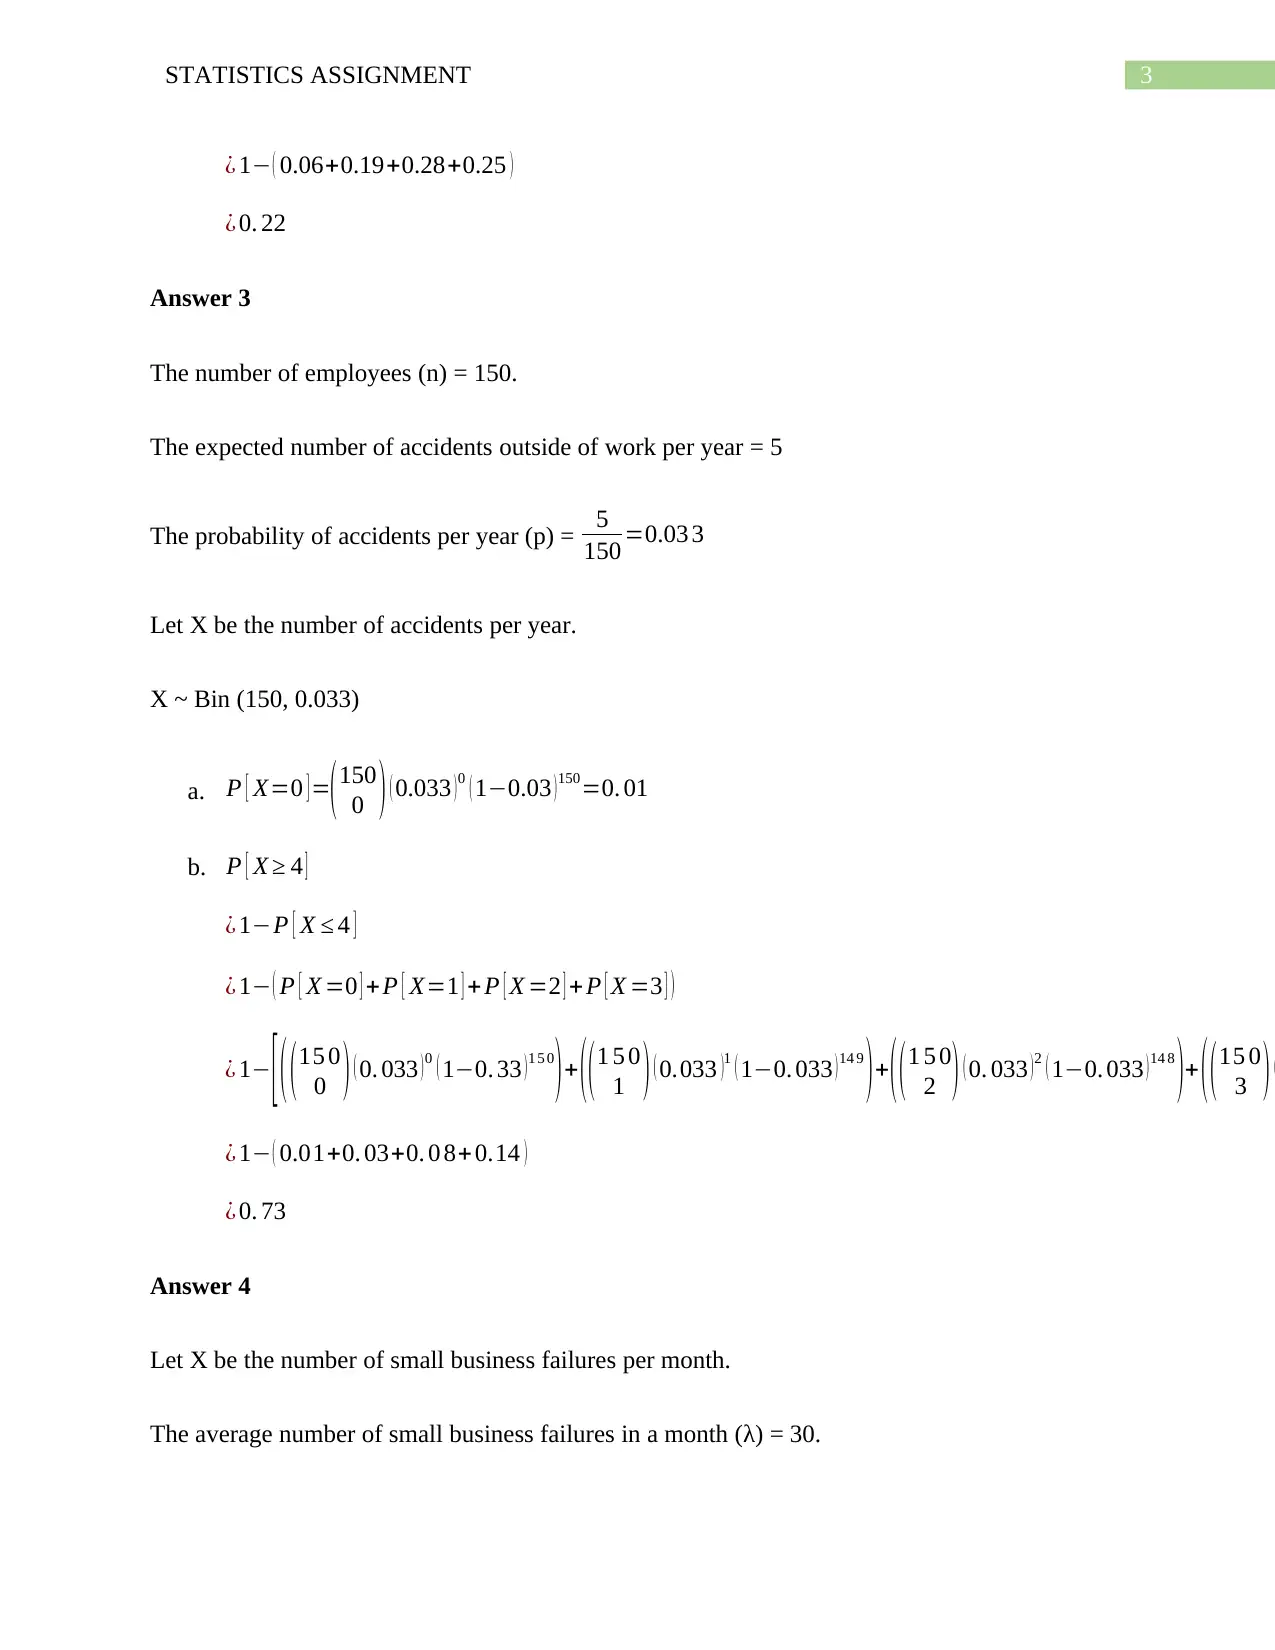
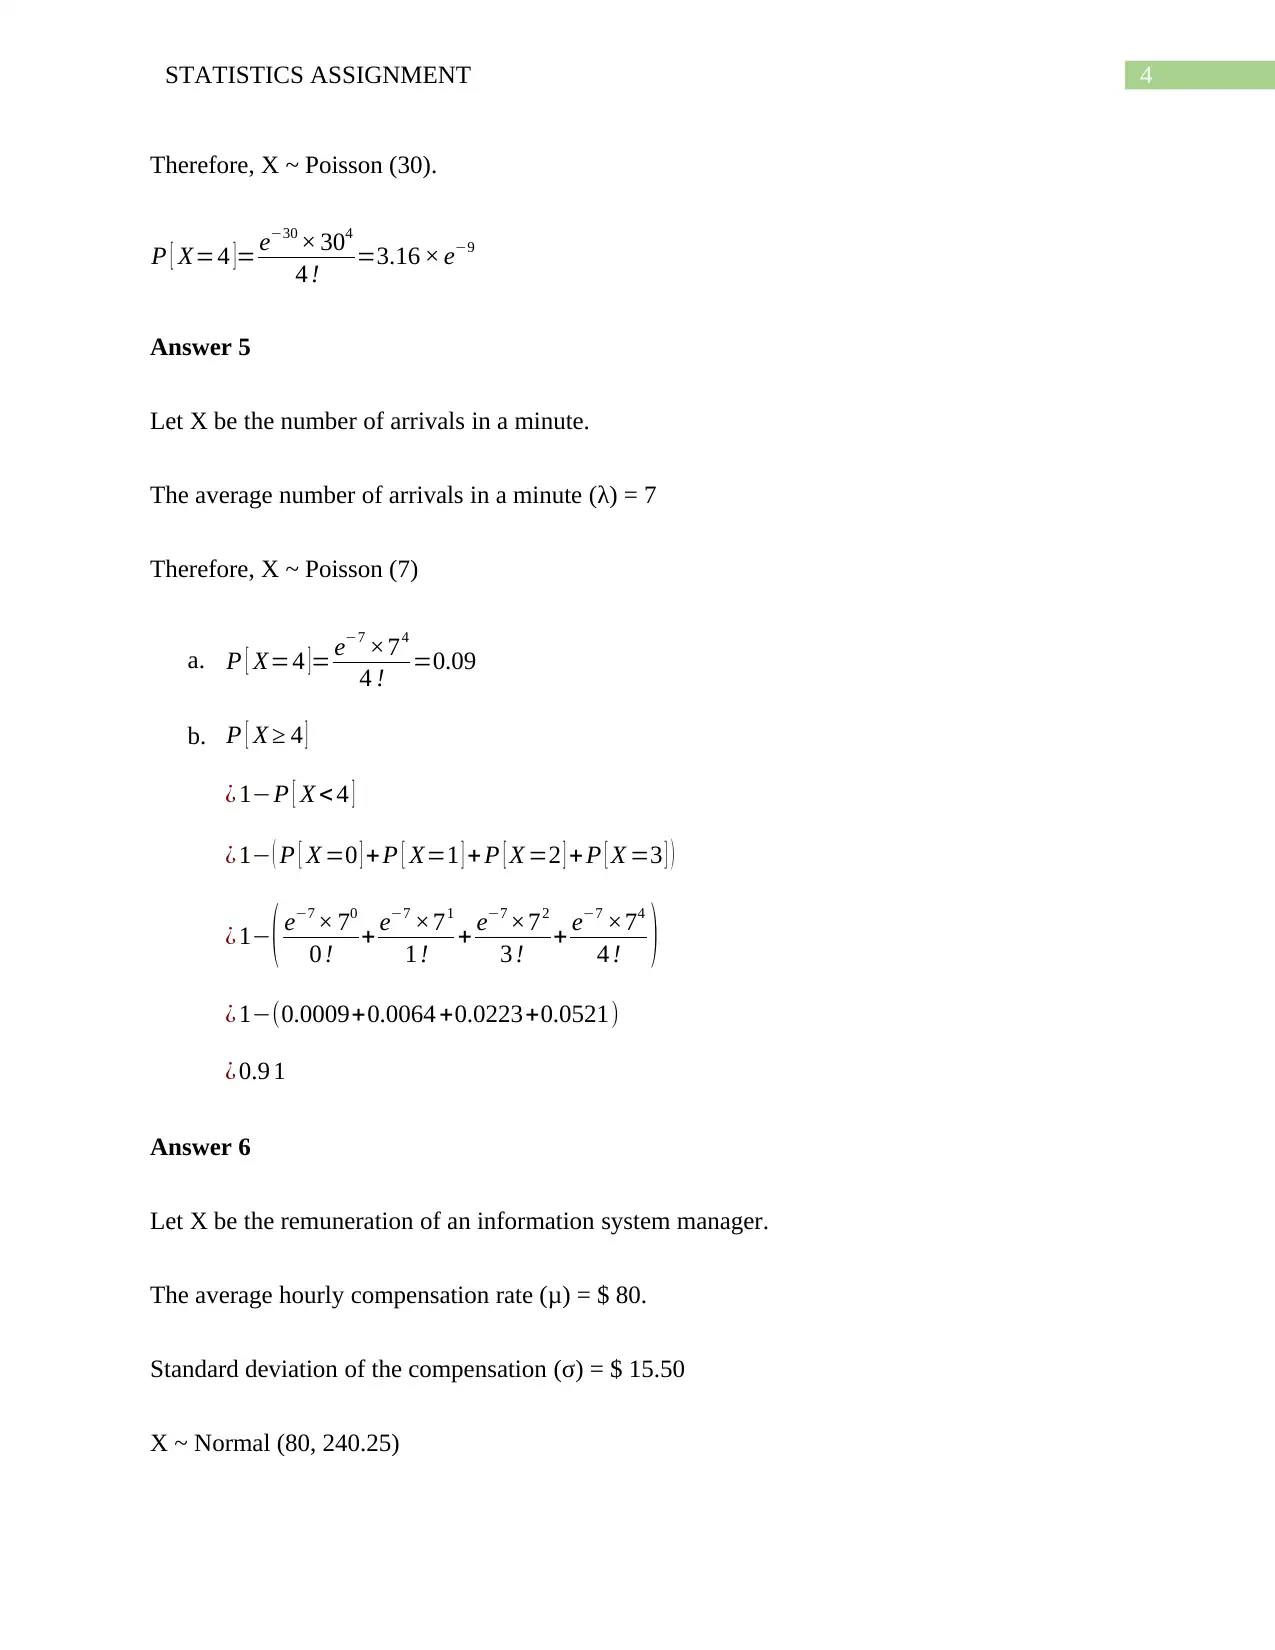
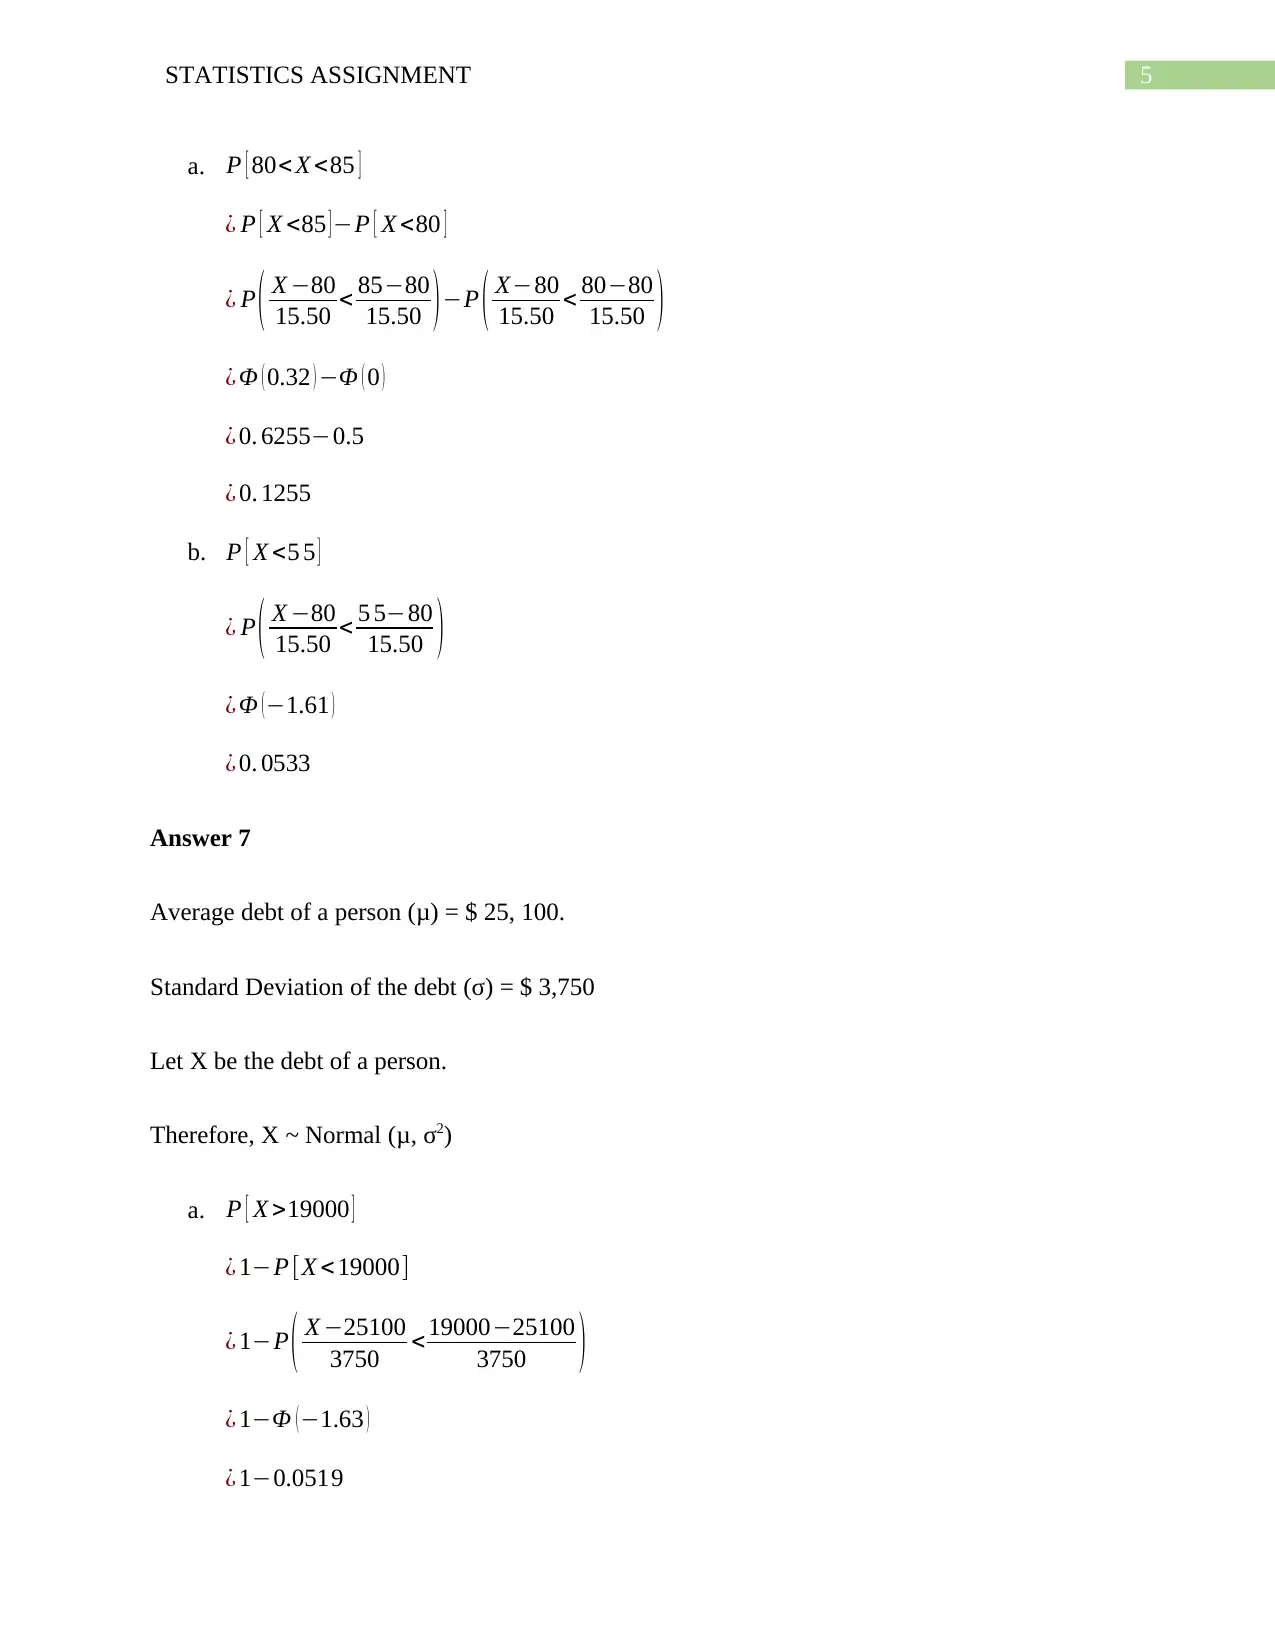
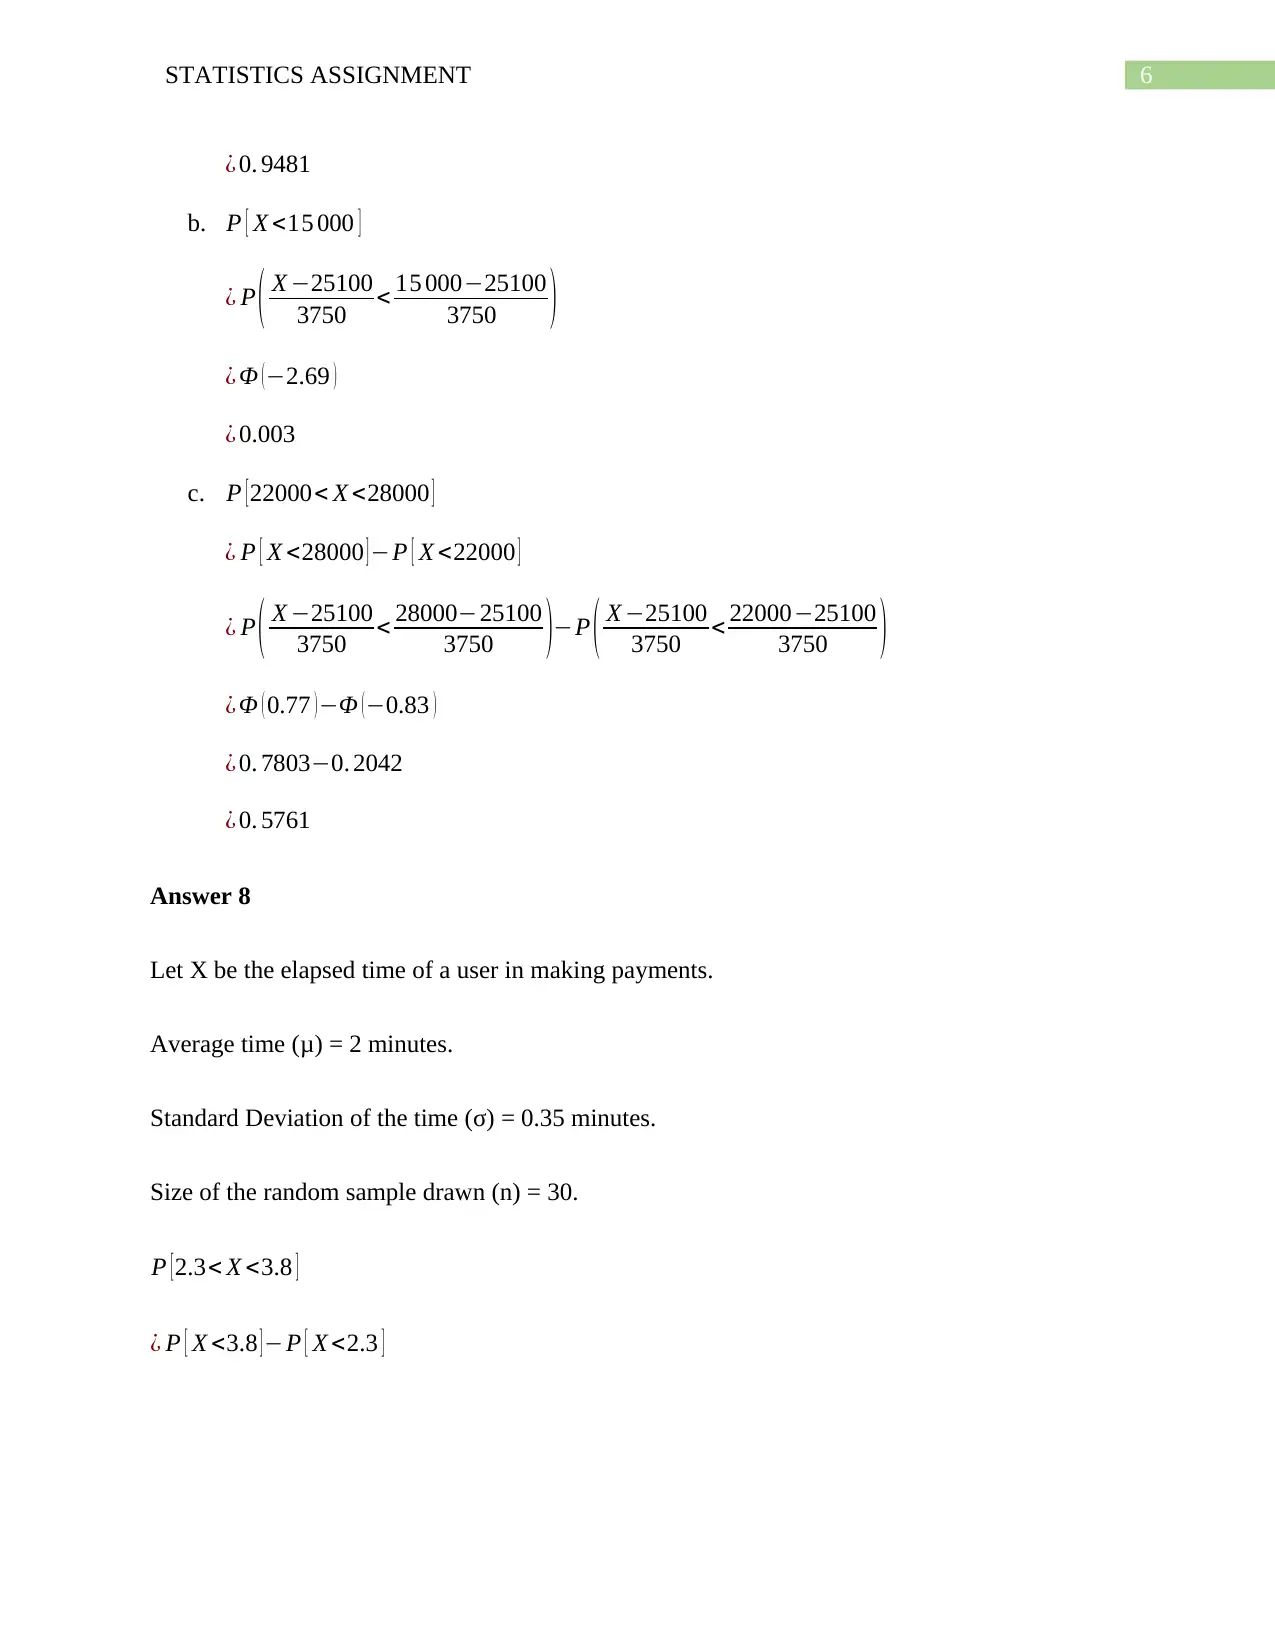
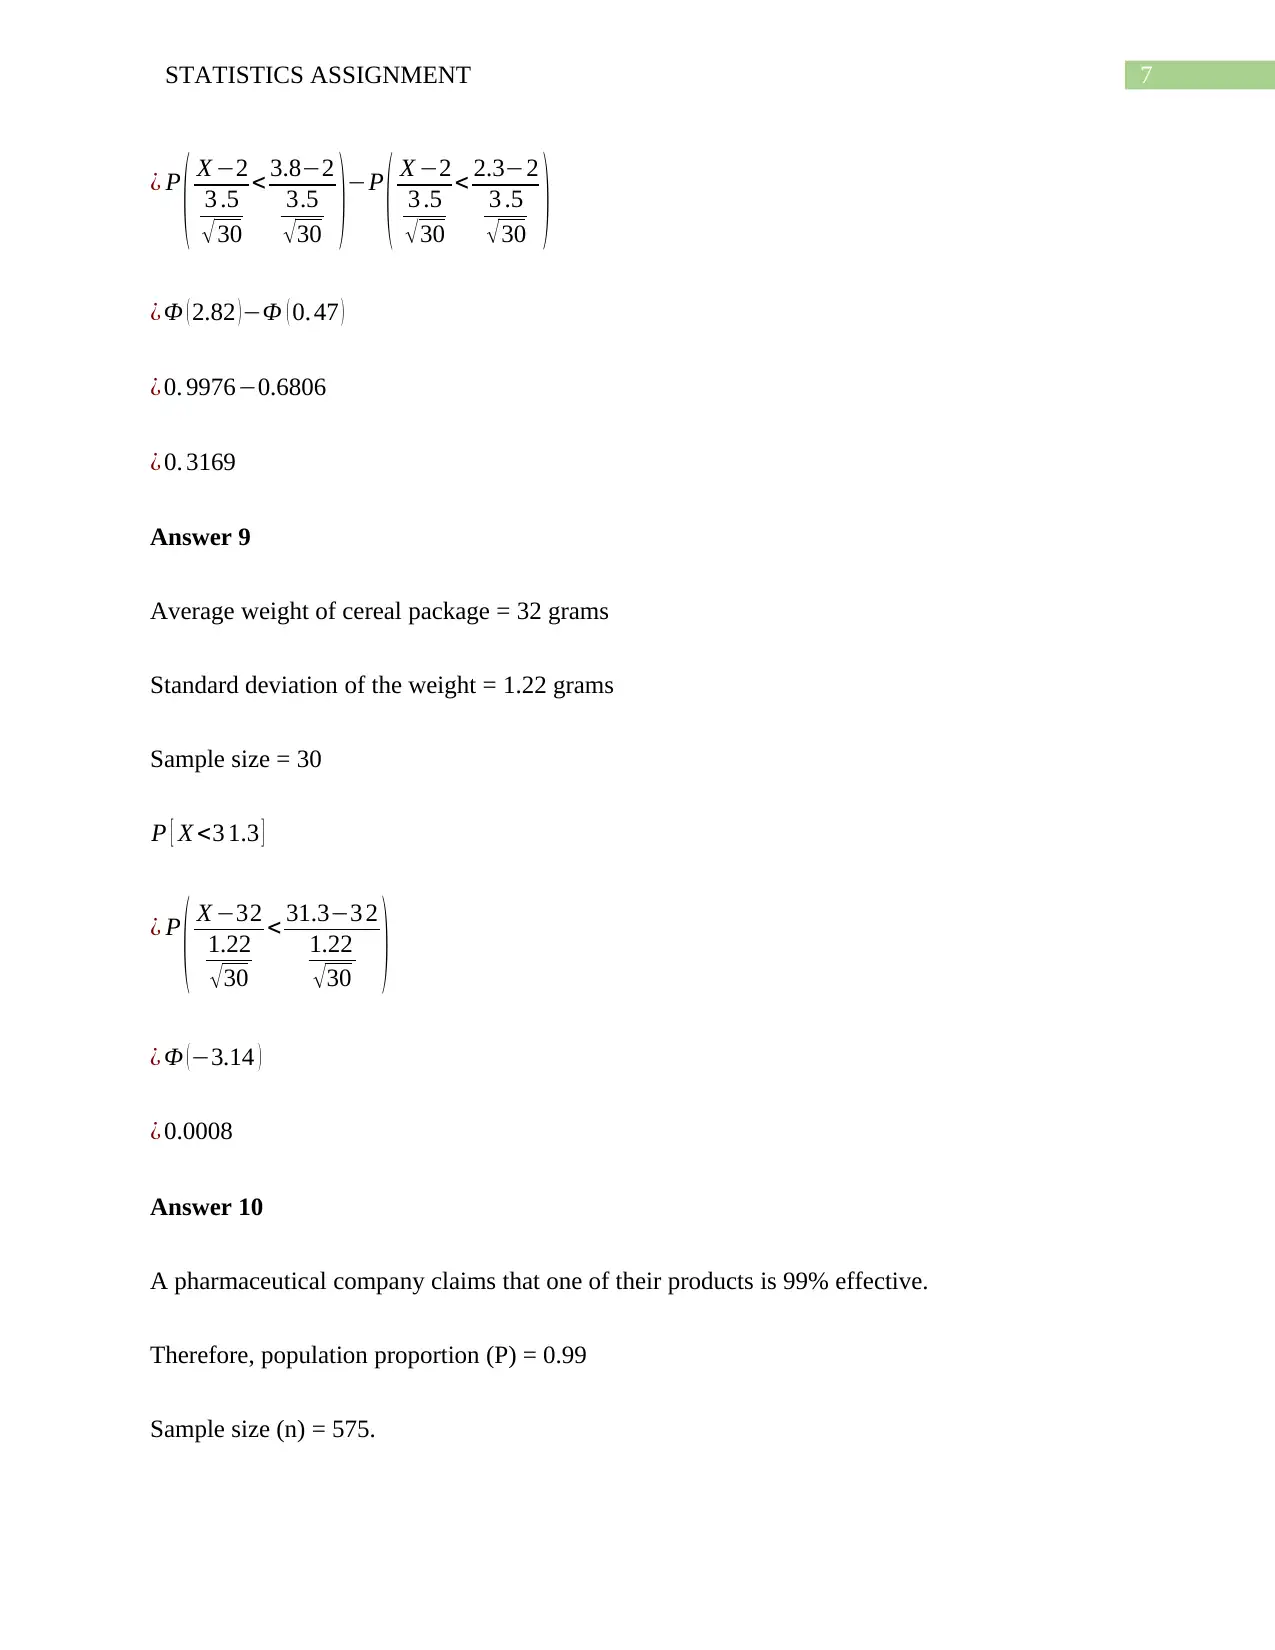
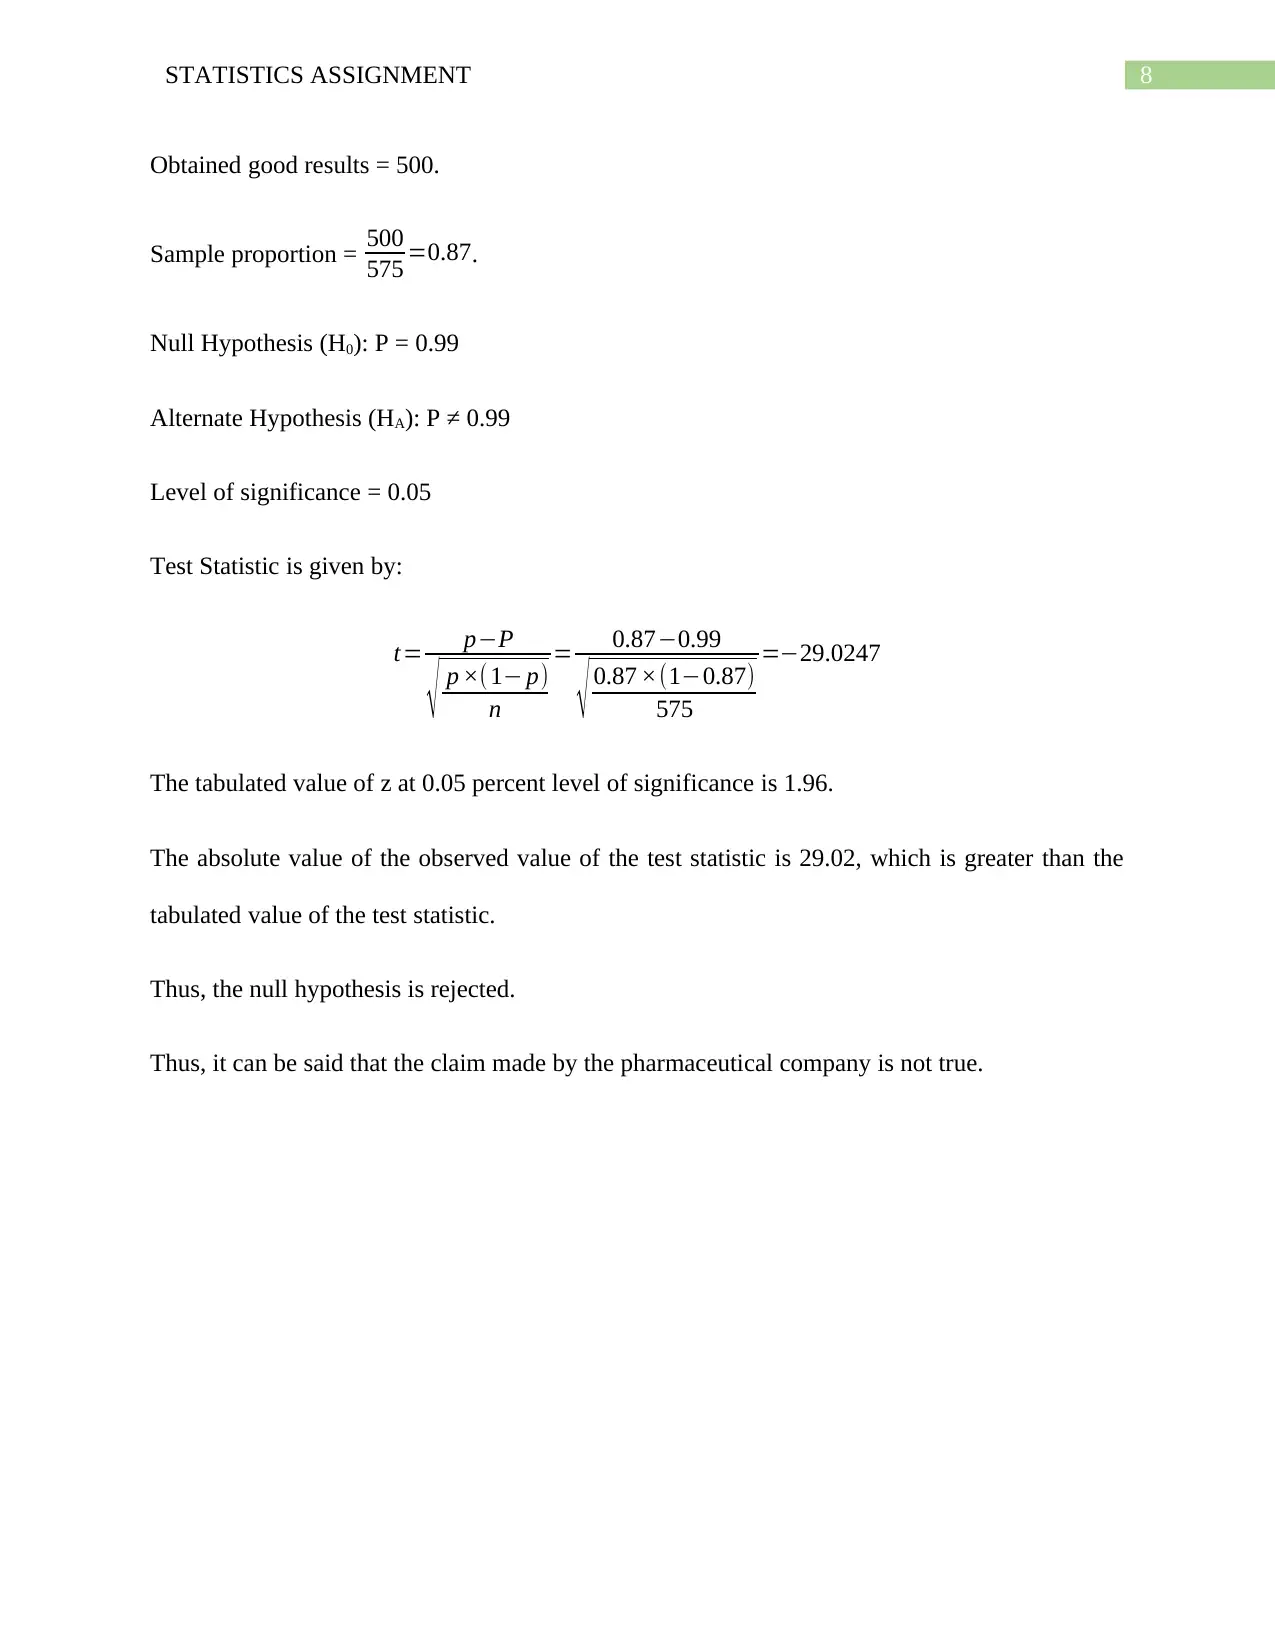
This assignment provides solutions to various statistics problems involving probability distributions and hypothesis testing. It covers binomial, Poisson, and normal distributions, calculating probabilities for different scenarios. Problems include finding the probability of defective items, analyzing credit card balances, determining accident rates, and assessing the effectiveness of a pharmaceutical product using hypothesis testing. The solutions demonstrate step-by-step calculations and interpretations.

Running Head: STATISTICS ASSIGNMENT
Statistics Assignment
Name of the Student
Name of the University
Student ID
Statistics Assignment
Name of the Student
Name of the University
Student ID
Paraphrase This Document
Need a fresh take? Get an instant paraphrase of this document with our AI Paraphraser

1STATISTICS ASSIGNMENT
Table of Contents
Answer 1..........................................................................................................................................2
Answer 2..........................................................................................................................................2
Answer 3..........................................................................................................................................3
Answer 4..........................................................................................................................................3
Answer 5..........................................................................................................................................4
Answer 6..........................................................................................................................................4
Answer 7..........................................................................................................................................5
Answer 8..........................................................................................................................................6
Answer 9..........................................................................................................................................7
Answer 10........................................................................................................................................7

2STATISTICS ASSIGNMENT
Answer 1
Probability of defective items (p) = 0.03
Number of randomly selected pieces (n) = 6
Let X be the number of defective parts.
X ~ Bin (6, 0.03)
a. P [ X=0 ] =( 6
0 ) ( 0.03 ) 0 ( 1−0.03 ) 6=0.83
b. P [ X=2 ]= (6
2 ) ( 0.03 )2 (1−0.03 )4 =0. 01
Answer 2
Let X be the number of students having a credit card balance greater than $ 3,500.
The probability of students having credit card balance greater than $ 3,500 (p) = 0.25.
The number of students selected randomly (n) = 10.
Therefore, X ~ Bin (10, 0.25)
a. P [ X=6 ] =( 10
6 ) ( 0.25 ) 6 ( 1−0.25 ) 4=0. 02
b. P [ X ≥ 4 ]
¿ 1−P [ X ≤ 4 ]
¿ 1− ( P [ X =0 ] + P [ X=1 ] + P [ X =2 ] + P [ X =3 ] )
¿ 1− [ ( ( 10
0 ) ( 0.25 ) 0 ( 1−0.25 ) 10
) + (( 10
1 ) ( 0.25 ) 1 ( 1−0.25 ) 9
) +
( ( 10
2 ) ( 0.25 ) 2 ( 1−0.25 ) 8
)+ ( ( 10
3 ) ( 0.25 ) 3 ( 1−0.25 ) 7
) ]
⊘ This is a preview!⊘
Do you want full access?
Subscribe today to unlock all pages.

Trusted by 1+ million students worldwide

3STATISTICS ASSIGNMENT
¿ 1− ( 0.06+0.19+0.28+0.25 )
¿ 0. 22
Answer 3
The number of employees (n) = 150.
The expected number of accidents outside of work per year = 5
The probability of accidents per year (p) = 5
150 =0.03 3
Let X be the number of accidents per year.
X ~ Bin (150, 0.033)
a. P [ X=0 ] =( 150
0 ) ( 0.033 ) 0 ( 1−0.03 ) 150=0. 01
b. P [ X ≥ 4 ]
¿ 1−P [ X ≤ 4 ]
¿ 1− ( P [ X =0 ] + P [ X=1 ] + P [ X =2 ] + P [ X =3 ] )
¿ 1− [ ( ( 15 0
0 ) ( 0. 033 ) 0 ( 1−0. 33 ) 1 5 0
) + (( 1 5 0
1 ) ( 0.033 )1 ( 1−0. 033 ) 14 9
) +
( ( 1 5 0
2 ) ( 0. 033 ) 2 ( 1−0. 033 ) 14 8
)+ ( ( 15 0
3 ) (
¿ 1− ( 0.01+0. 03+0. 0 8+ 0.14 )
¿ 0. 73
Answer 4
Let X be the number of small business failures per month.
The average number of small business failures in a month (λ) = 30.
Paraphrase This Document
Need a fresh take? Get an instant paraphrase of this document with our AI Paraphraser

4STATISTICS ASSIGNMENT
Therefore, X ~ Poisson (30).
P [ X=4 ]= e−30 × 304
4 ! =3.16 × e−9
Answer 5
Let X be the number of arrivals in a minute.
The average number of arrivals in a minute (λ) = 7
Therefore, X ~ Poisson (7)
a. P [ X=4 ]= e−7 ×74
4 ! =0.09
b. P [ X ≥ 4 ]
¿ 1−P [ X < 4 ]
¿ 1− ( P [ X =0 ] + P [ X=1 ] + P [ X =2 ] + P [ X =3 ] )
¿ 1− ( e−7 × 70
0 ! + e−7 ×71
1 ! + e−7 ×72
3 ! + e−7 ×74
4 ! )
¿ 1−(0.0009+0.0064 +0.0223+0.0521)
¿ 0.9 1
Answer 6
Let X be the remuneration of an information system manager.
The average hourly compensation rate (μ) = $ 80.
Standard deviation of the compensation (σ) = $ 15.50
X ~ Normal (80, 240.25)

5STATISTICS ASSIGNMENT
a. P [ 80< X <85 ]
¿ P [ X <85 ] −P [ X <80 ]
¿ P ( X −80
15.50 < 85−80
15.50 )−P ( X−80
15.50 < 80−80
15.50 )
¿ Φ ( 0.32 ) −Φ ( 0 )
¿ 0. 6255−0.5
¿ 0. 1255
b. P [ X <5 5 ]
¿ P ( X −80
15.50 < 5 5−80
15.50 )
¿ Φ (−1.61 )
¿ 0. 0533
Answer 7
Average debt of a person (μ) = $ 25, 100.
Standard Deviation of the debt (σ) = $ 3,750
Let X be the debt of a person.
Therefore, X ~ Normal (μ, σ2)
a. P [ X >19000 ]
¿ 1−P [X < 19000]
¿ 1−P ( X −25100
3750 < 19000−25100
3750 )
¿ 1−Φ ( −1.63 )
¿ 1−0.0519
⊘ This is a preview!⊘
Do you want full access?
Subscribe today to unlock all pages.

Trusted by 1+ million students worldwide

6STATISTICS ASSIGNMENT
¿ 0. 9481
b. P [ X <15 000 ]
¿ P ( X −25100
3750 < 15 000−25100
3750 )
¿ Φ ( −2.69 )
¿ 0.003
c. P [ 22000< X <28000 ]
¿ P [ X <28000 ] −P [ X <22000 ]
¿ P ( X −25100
3750 < 28000−25100
3750 )−P ( X −25100
3750 < 22000−25100
3750 )
¿ Φ ( 0.77 )−Φ (−0.83 )
¿ 0. 7803−0. 2042
¿ 0. 5761
Answer 8
Let X be the elapsed time of a user in making payments.
Average time (μ) = 2 minutes.
Standard Deviation of the time (σ) = 0.35 minutes.
Size of the random sample drawn (n) = 30.
P [2.3< X <3.8 ]
¿ P [ X <3.8 ] −P [ X <2.3 ]
Paraphrase This Document
Need a fresh take? Get an instant paraphrase of this document with our AI Paraphraser

7STATISTICS ASSIGNMENT
¿ P
( X −2
3 .5
√ 30
< 3.8−2
3.5
√30 )−P
( X −2
3 .5
√30
< 2.3−2
3 .5
√30 )
¿ Φ ( 2.82 )−Φ ( 0. 47 )
¿ 0. 9976−0.6806
¿ 0. 3169
Answer 9
Average weight of cereal package = 32 grams
Standard deviation of the weight = 1.22 grams
Sample size = 30
P [ X <3 1.3 ]
¿ P
( X −32
1.22
√30
< 31.3−3 2
1.22
√30 )
¿ Φ ( −3.14 )
¿ 0.0008
Answer 10
A pharmaceutical company claims that one of their products is 99% effective.
Therefore, population proportion (P) = 0.99
Sample size (n) = 575.
¿ P
( X −2
3 .5
√ 30
< 3.8−2
3.5
√30 )−P
( X −2
3 .5
√30
< 2.3−2
3 .5
√30 )
¿ Φ ( 2.82 )−Φ ( 0. 47 )
¿ 0. 9976−0.6806
¿ 0. 3169
Answer 9
Average weight of cereal package = 32 grams
Standard deviation of the weight = 1.22 grams
Sample size = 30
P [ X <3 1.3 ]
¿ P
( X −32
1.22
√30
< 31.3−3 2
1.22
√30 )
¿ Φ ( −3.14 )
¿ 0.0008
Answer 10
A pharmaceutical company claims that one of their products is 99% effective.
Therefore, population proportion (P) = 0.99
Sample size (n) = 575.

8STATISTICS ASSIGNMENT
Obtained good results = 500.
Sample proportion = 500
575 =0.87.
Null Hypothesis (H0): P = 0.99
Alternate Hypothesis (HA): P ≠ 0.99
Level of significance = 0.05
Test Statistic is given by:
t= p−P
√ p ×( 1− p)
n
= 0.87−0.99
√ 0.87 ×(1−0.87)
575
=−29.0247
The tabulated value of z at 0.05 percent level of significance is 1.96.
The absolute value of the observed value of the test statistic is 29.02, which is greater than the
tabulated value of the test statistic.
Thus, the null hypothesis is rejected.
Thus, it can be said that the claim made by the pharmaceutical company is not true.
⊘ This is a preview!⊘
Do you want full access?
Subscribe today to unlock all pages.

Trusted by 1+ million students worldwide
1 out of 9
Related Documents

Your All-in-One AI-Powered Toolkit for Academic Success.
+13062052269
info@desklib.com
Available 24*7 on WhatsApp / Email
Unlock your academic potential
Copyright © 2020–2025 A2Z Services. All Rights Reserved. Developed and managed by ZUCOL.